Canadian Dollar Futures: Inflation Breakout TestToday's 6C setup is about whether Canadian inflation can force a clean CAD break rather than another hold of the USD/CAD base. The spot reference is simple: 1.40 is the line the market has been defending.
Where the edge is
The edge is event timing, not a medium-term macro call. Last week's BoC message keeps inflation and oil pass-through central to CAD pricing, while oil support keeps CAD demand alive if the post-release break holds.
Evidence
Canada's inflation figures are due today at 1:30pm London. The BoC held at 2.25% on July 15 and said inflation should ease gradually, but warned it would not let higher oil prices become persistent inflation. That makes this a real CAD catalyst.
Trade idea
For 6C, stay conditional into the release and favour CAD only if the post-CPI move confirms acceptance beyond the decision area. If USD/CAD preserves its base after the data, the 6C continuation idea loses its edge.
--------------------
When charting futures, the data provided could be delayed. Traders working with the ticker symbols discussed in this idea may prefer to use CME Group real-time data plan on TradingView: tradingview.com/cme/ .
This consideration is particularly important for shorter-term traders, whereas it may be less critical for those focused on longer-term trading strategies.
General Disclaimer:
The trade ideas presented herein are solely for illustrative purposes forming a part of a case study intended to demonstrate key principles in risk management within the context of the specific market scenarios discussed. These ideas are not to be interpreted as investment recommendations or financial advice. They do not endorse or promote any specific trading strategies, financial products, or services. The information provided is based on data believed to be reliable. However, its accuracy or completeness cannot be guaranteed. Trading in financial markets involves risks, including the potential loss of principal. Each individual should conduct their own research and consult with professional financial advisors before making any investment decisions. The author or publisher of this content bears no responsibility for any actions taken based on the information provided or for any resultant financial or other losses.
USD/CAD EXCHANGE RATE FUTURES
No trades
No trades
In-depth trading ideas
Can Oil Rescue the Loonie From Trade Turmoil?The Canadian dollar sits at a genuine crossroads this summer. Two forces are pulling it in opposite directions at once. A cautious central bank and an unresolved trade fight weigh it down. A sudden oil rally props it back up. Canadian Dollar futures have spent weeks locked in a range between 0.71 and 0.74, and that narrow band tells the whole story of a currency caught between domestic weakness and external support.
Macroeconomics: A Central Bank Standing Still
The Bank of Canada held its overnight rate at 2.25% on July 15, its sixth consecutive hold. Canadian GDP was roughly unchanged from the first quarter of 2025 to the first quarter of 2026. Unemployment has hovered between 6.5% and 7% for a year, pointing to real slack in the economy.
Inflation tells a more complicated story. It sat near 2% for a year and a half before the Middle East war pushed oil prices higher, and Canada's own budget office now expects headline inflation to reach 2.5% in 2026, up from an earlier 2.0% forecast. The Federal Reserve, meanwhile, holds its target range at 3.50% to 3.75%. That rate gap keeps capital drawn toward the US dollar, even as Canada is projected to post the second-fastest growth in the G7 through 2026 and 2027.
Metric Canada United States
Policy rate 2.25% 3.50%-3.75%
Inflation (2026 forecast) 2.5% Elevated, energy-driven
Unemployment 6.5%-7% N/A
Net debt to GDP 10.2% (lowest in G7) N/A
Geopolitics: CUSMA's Unresolved Deadline
Trade policy handed the loonie a fresh dose of uncertainty this month. The July 1 deadline for Canada, the United States, and Mexico to review and potentially extend CUSMA for another sixteen years passed without a full agreement. Washington declined to commit, so the pact now shifts to annual reviews ahead of its 2036 expiry, while existing tariffs on Canadian goods stay in place.
That overhang matters because it has already reshaped Canadian trade behavior. Businesses report actively diversifying export markets and reconfiguring supply chains to reduce US tariff exposure. Employment losses have concentrated specifically in tariff-exposed sectors and regions, with manufacturing-heavy London, Ontario posting 8.4% unemployment against just 3.8% in trade-insulated Quebec City.
A second geopolitical channel cuts the other way. The US-Iran conflict pushed crude oil sharply higher through mid-July, with the US reinstating a naval presence near the Strait of Hormuz and WTI climbing toward the low $80s, up more than 10% in a single week. Canada's budget office now models WTI averaging $80 a barrel in the second quarter, well above its original forecast. As a major oil exporter, Canada captures that upside directly, and it has been the single biggest offset to trade-driven currency weakness.
Event Date Effect on CAD
CUSMA review deadline passes without extension July 1, 2026 Bearish
BoC holds rate, sixth straight July 15, 2026 Neutral
Naval buildup near Strait of Hormuz Mid-July 2026 Bullish (oil-linked)
Industry Trends and Business Models
Canadian exporters are rewriting their playbooks in real time. Companies hit hardest by US tariffs are pursuing new markets outside North America and rebuilding supply chains around that diversification. This is a genuine business model shift, not a temporary adjustment, since forecasters do not expect a return to broadly open, low-tariff trade with Washington anytime soon.
The oil and gas sector is moving in the opposite direction: expanding. Higher crude prices and stronger demand for Canadian crude are drawing increased investment into energy projects, with positive spillover effects into adjacent industries. That investment is expected to lift nominal GDP by roughly $37 billion a year on average through 2030 relative to pre-conflict forecasts.
Management and Leadership: Steering Through Two Shocks
The Bank of Canada's leadership faces a genuine balancing act. It must weigh a labor market with real slack against inflation that is rising for reasons entirely outside its control, an external oil shock rather than domestic overheating. Holding rates steady for six straight meetings reflects that awkward position: cutting risks fueling energy-driven inflation further, while hiking would punish an already-soft labor market.
Federal fiscal leadership is responding in parallel. Canada's Spring Economic Update explicitly incorporated the Middle East conflict's economic impact, using elevated oil prices as partial justification for accelerating major energy projects and catalyzing new private investment. That is a deliberate policy choice to convert an external shock into domestic economic advantage.
Technology, Science, and High-Tech
The Bank of Canada itself flags artificial intelligence as a structural force reshaping the economy, driving greater automation and digitalization even as tariffs curb investment elsewhere. Canada's AI research base, anchored by Montreal's Mila institute and the Toronto-Waterloo corridor's Vector Institute, gives this trend real institutional depth rather than just corporate adoption.
That AI investment is showing up in the data too. Statistics Canada's survey of planned 2026 capital expenditures shows businesses stepping up spending, even as tariff-exposed sectors pull back, a split that reflects where genuine confidence still exists in the economy.
Patent Analysis and Innovation
Canada's technological innovation consistently ranks among the top drivers of foreign direct investment into the country, cited alongside natural resources as a leading factor in surveyed investor motivation. That reputation rests substantially on AI and machine learning patent activity concentrated in the Toronto and Montreal research clusters, giving Canada a differentiated pitch beyond its traditional commodity-exporter identity.
Cybersecurity Considerations
A currency this tied to energy exports carries a cybersecurity dimension worth naming directly. Canadian oil and gas infrastructure, along with the financial systems settling cross-border energy trade, represent high-value targets precisely because so much of the country's export revenue and currency strength flows through them. Protecting those systems has become inseparable from protecting the loonie's fundamental value proposition.
Company Culture and Innovation
Canadian exporters are visibly shifting culture under pressure. Firms once comfortable with near-total US market dependence now actively reward diversification and rapid reconfiguration, a genuine break from decades of assumed North American trade stability. That adaptability, forced rather than chosen, may prove to be Canada's most durable economic asset from this period.
The Pharmaceutical Connection
Currency swings feed directly into Canada's pharmaceutical and biotech import costs, since much of the sector's raw materials and specialized equipment are priced in US dollars. A weaker loonie raises input costs for Canadian drug manufacturers and biotech research operations at exactly the moment trade uncertainty already complicates supply planning. It is a secondary effect next to oil and trade policy, but a real one for an industry sensitive to margin compression.
Closing Thoughts
The Canadian dollar is fighting two very different battles at once, and neither is close to resolved. Domestically, a stalled economy and an unresolved trade relationship argue for further weakness. Externally, an oil shock nobody wanted is doing more to support the currency than any policy lever available in Ottawa. Watch three things going forward: whether the 0.71 support level in CAD futures holds, whether Washington signals any movement on CUSMA tariffs, and whether the Iran conflict extends or reverses its disruption to Strait of Hormuz shipping. Any one of the three could decide which force wins out this summer.
Canadian Dollar Futures: BoC Breakout SetupCanadian dollar futures have a conditional upside setup around today's Bank of Canada decision. A policy message that supports CAD, confirmed by a sustained break of the tested floor in spot USD/CAD, could extend the currency's recovery; confirmation is essential because the expected hold and cautious medium-term CAD outlook are largely consensual.
Where the edge is
CAD shorts are already being covered while rising oil provides an independent support channel. If supportive BoC guidance forces spot USD/CAD through its tested floor, further short covering can accelerate gains in 6C rather than produce only a routine policy reaction.
Evidence
Spot USD/CAD remains in a bearish trend from 1.4284, although fading momentum and near-oversold conditions argue against chasing. The BoC is widely expected to hold at 2.25% and describe policy as broadly appropriate, while some research retains a modestly negative medium-term CAD view. That caution contrasts with active CAD short covering and oil support.
Trade idea
Buy 6C only if the BoC message supports CAD and spot USD/CAD closes below 1.4040 without quickly reclaiming that floor. Do not anticipate the break. A spot recovery above today's rejection area would invalidate the policy-led continuation setup.
--------------------
When charting futures, the data provided could be delayed. Traders working with the ticker symbols discussed in this idea may prefer to use CME Group real-time data plan on TradingView: tradingview.com/cme/ .
This consideration is particularly important for shorter-term traders, whereas it may be less critical for those focused on longer-term trading strategies.
General Disclaimer:
The trade ideas presented herein are solely for illustrative purposes forming a part of a case study intended to demonstrate key principles in risk management within the context of the specific market scenarios discussed. These ideas are not to be interpreted as investment recommendations or financial advice. They do not endorse or promote any specific trading strategies, financial products, or services. The information provided is based on data believed to be reliable; however, its accuracy or completeness cannot be guaranteed. Trading in financial markets involves risks, including the potential loss of principal. Each individual should conduct their own research and consult with professional financial advisors before making any investment decisions. The author or publisher of this content bears no responsibility for any actions taken based on the information provided or for any resultant financial or other losses.
USD/CAD bear trap above 1.4016 June 2026, 9:06 AM London, UK
As London opens, the session is being shaped by post-RBA and post-BOJ price action rather than a clean broad-Dollar trend. AUD/USD is the clearest near-term battlefield, sitting close to today's 0.7060/65 New York cut expiries after the RBA held rates but kept hawkish language alive. USD/JPY remains elevated around 160.25 after the BOJ hike was shrugged off, yet intervention risk, 160.50/161.00 option resistance and the pending press conference argue against a lazy topside chase. EUR/USD is pinned below the 1.1600 area with large post-Fed option resistance overhead, while GBP/USD, EUR/GBP and EUR/CHF are event-gated by UK CPI, BoE and SNB risk later this week. The best tactical posture is selective. Respect timed option mechanics, avoid stale risk-on chasing, and focus on where late buyers or sellers are trapped.
--------------------
AUD/USD — Spot: 0.7060
Technical Analysis
- The 10-day average has crossed below the 100-day average, and spot is back below the 100-day average, keeping the chart tone defensive.
- 0.7088 is now the rejected June 15 high, while 0.7042 has been tested today and 0.7036 is the next clean closing-basis support from Monday.
- A daily close below 0.7036 would strengthen the bearish channel signal. Holding the 0.7055 area keeps the pair in a choppy post-RBA range.
Sell-side Research
- ANZ expected the RBA to hold and saw scope for an intraday AUD/USD rally if hawkish communication continued.
- Morgan Stanley expected the RBA to leave rates unchanged at 4.35%, with guidance still likely to lean hawkish as inflation pressures broaden.
Market Chatter
- Today's largest AUD/USD expiries are reported around 0.7060/65, leaving spot inside the active strike zone into the New York cut.
- The RBA held rates, warned hikes might not be over, yet the pair still dipped to 0.70425 before stabilising.
- China retail sales and urban investment disappointed, adding a regional drag to the Aussie after the policy event.
- Clustered stops sit near 0.7040 and 0.7088, making both edges vulnerable to sweep-and-reject price action.
Strategy
The underpriced path is not chasing post-RBA downside while option gravity holds near 0.7060/65. Respect the pin first, then favour downside only if 0.7040/36 breaks and holds after the cut, with 0.7088 the no-short boundary.
--------------------
USD/JPY — Spot: 160.25
Technical Analysis
- The same-day technical read describes disappointing price action inside a shallow bull trend.
- Today's 160.05/37 range shows 160.02/05 has already been tested as thin intraday support, while 160.50/161.00 remains the nearby topside battlefield.
- 160.59 from last week and the 161 handle are the immediate acceptance tests, with 162.00 and 165.00 only larger barrier context.
Sell-side Research
- MUFG argued a 25 bp BOJ hike was fully priced and unlikely by itself to reverse yen weakness.
- Goldman Sachs saw only limited yen support from gradual BOJ tightening, with broader macro and US outlook still keeping JPY on the back foot.
- HSBC flagged stretched short-JPY futures and options positioning and warned Japan may soon intervene again.
Market Chatter
- The BOJ hike was shrugged off, keeping dollar-yen elevated while the press conference and intervention watch remain live.
- Market talk points to option resistance around 160.50/161.00 today, with larger barriers at 162.00 and 165.00.
- Downside expiries from the 159 handle are said to be supportive, while Tokyo-fix importer demand remains a recurring bid source.
- Stop-liquidity is clustered near 160.55 above spot and 159.75 below, creating a clear trap zone around the next move.
Strategy
The obvious long is vulnerable because intervention fear and option resistance sit directly above spot. The better tactic is volatility or a failed-sweep fade around 160.50/161.00, unless price holds above that zone and retests it from above.
--------------------
EUR/USD — Spot: 1.1596
Technical Analysis
- Monday's rally squeezed shorts but faded from 1.1622, leaving spot back below the 1.1600 area in early London.
- Near resistance is the 1.1599 intraday technical zone, then the 1.1630/33 cloud-base and Fibonacci cluster. 1.1562 is the nearest refreshed intraday support.
- Daily momentum improved, but a close inside 1.1630 is still needed to neutralise the May-June bear trend.
Sell-side Research
- ING keeps a mildly bearish one-month EUR/USD view and says dollar demand could push the pair toward 1.13/14 in July.
- Bank of America sees two-way USD risk into the FOMC, with a hawkish surprise more likely but dovish delivery the pain trade.
- ANZ expects a hawkish FOMC tone, but sees limited scope for markets to price materially more tightening after recent data.
Market Chatter
- Large strikes around 1.1600 run through the Fed window, which may keep price action contained before the decision.
- A reported 9bn option cluster at 1.1640/55 expires at Thursday's New York cut, setting a clear near-term headwind above spot.
- Option markets have sold EUR downside hedges, but the pair has returned to a familiar consolidation range.
- Clustered stops near 1.1608 and 1.1563 define the immediate squeeze-versus-breakdown battlefield.
Strategy
The post-cut upside idea has failed to hold 1.1600, but downside is not clean before the Fed window. The underpriced trade is a trap response: respect EUR/USD short-squeeze risk if 1.1608 is reclaimed, otherwise wait for 1.1563 to hold below.
--------------------
GBP/USD — Spot: 1.3415
Technical Analysis
- Sterling failed to sustain Monday's rally to 1.3460 and is now testing the 200-day average area around 1.3418.
- The 1.3409/18 technical band is the live pivot, while 1.3391 has already held today. Overhead resistance starts around 1.3464 and 1.3487.
- The false-break risk remains high because yesterday's upper shadow left bulls unable to convert the range-top push.
Sell-side Research
- Bank of America says UK political uncertainty can weigh on growth and prefers using volatility to express political concerns.
- Danske expects the BoE to remain sidelined and sees a relatively weak UK growth outlook weighing on its GBP call.
- Bank of America sees two-way USD risk into FOMC, with the dollar vulnerable if the Fed does not validate hawkish pricing.
Market Chatter
- Cable traded a tight 1.3391-1.3423 range by the London morning, hugging the 1.34 area before the Fed meeting begins.
- UK CPI is due tomorrow at 7:00 London, with BoE, labour and retail sales risk also clustered this week.
- Monday's Middle East relief bid faded near the top of the recent 1.33-1.35 range.
- Stop-liquidity near 1.3380 sits below today's low and may attract a flush if the 1.3409 area gives way.
Strategy
The failed 1.3418 reclaim warns that late cable buyers are exposed, but tomorrow's UK CPI limits aggression. Prefer fading failed rebounds below 1.3418, while a clean hold above 1.3423 shifts the setup back to squeeze management.
--------------------
USD/CAD — Spot: 1.4008
Technical Analysis
- The pair has reclaimed 1.40 after Monday's lower tail, keeping the bull trend alive despite overbought daily momentum.
- 1.4023/24 combines the upper weekly volatility band with the 2026 high. Support is better mapped at 1.3955/49 from the 10-day and 200-hour averages.
- Long candle shadows warn that the upper range is unstable, but stronger rejection is still needed before the short side improves.
Sell-side Research
- Credit Agricole forecasts USD/CAD around current levels into H2 2026 and near 1.35 by year-end.
- Bank of America remains bullish USD versus CAD into the FOMC, while recognising two-way risk from the meeting.
Market Chatter
- Lower oil after the Middle East relief move has tempered CAD support despite broader risk appetite.
- Recent long lower tails suggest an underlying USD bid has been difficult to fade.
- Retail traders remain heavily short USD/CAD, which can keep squeeze pressure alive while 1.40 holds.
Strategy
The previous 1.40 downside break has turned into a bear trap. The underpriced path is a final squeeze toward 1.4023/24 while 1.40 holds, but do not chase if that high rejects again during the FOMC risk window.
--------------------
EUR/GBP — Spot: 0.8644
Technical Analysis
- The cross is fighting the bear trend after a long lower shadow, with Monday's rebound warning of a possible direction change.
- 0.8652 has already capped the latest bounce, while 0.8662 and 0.8673 are refreshed resistance levels. The lower volatility boundary sits near 0.8618.
- A close above the June 4 high at 0.8656 would strengthen the reversal signal.
Sell-side Research
- Bank of America remains short EUR/GBP but sees long volatility as prudent around UK political and BoE risk.
- Danske expects the BoE to stay sidelined and forecasts EUR/GBP moving higher toward 0.89 over a 6-12 month horizon.
Market Chatter
- UK CPI is due tomorrow, with the BoE decision and Makerfield by-election risk following on Thursday.
- Monday's headwind around 0.8650 shows sellers still defending the upper end of the short-term range.
- Stop-liquidity below 0.8605 is distant for the morning, making an immediate downside chase less attractive.
Strategy
The repeated failure to hold below 0.8637 leaves late EUR/GBP sellers exposed, but UK CPI is close enough to cap conviction. Prefer corrective upside while 0.8628 holds, using 0.8662/73 as the acceptance and profit-taking zone.
--------------------
EUR/CHF — Spot: 0.9219
Technical Analysis
- EUR/CHF again rejected the 200-day average area near 0.9230, keeping the broader 0.90-0.92 range-top debate alive.
- Today's rebound from 0.9195 has reclaimed the 0.9200 area, but 0.9228/30 remains the nearby stop-run and rejection zone.
Sell-side Research
- Goldman Sachs expects the SNB to remain comfortably on hold at 0.0% this week, with risks tilted slightly toward hikes if inflation pass-through strengthens.
Market Chatter
- SNB event risk is due Thursday, and recent official comments highlighted increased willingness to intervene in FX.
- CHF has remained a relative outperformer despite the US-Iran agreement, showing it is not trading purely as a risk-off proxy.
- Clustered stops just above 0.9228 could pull the cross into a sweep before any cleaner range rejection appears.
Strategy
The underpriced path is a stop-run into 0.9228/30 rather than a clean upside breakout. Fade only if that sweep fails, while a hold above 0.9230 would delay the range-top rejection before Thursday's SNB risk.
--------------------
Market Summary
AUD/USD — 0.7060 — Pin first
- Market consensus: Post-RBA price action is soft, but today's 0.7060/65 expiry zone can slow follow-through.
- Recommendation: Respect the expiry pin, then follow downside only if 0.7040/36 holds below.
USD/JPY — 160.25 — Trap watch
- Market consensus: BOJ hike was priced, USD/JPY stays elevated, but intervention and option resistance cap chase value.
- Recommendation: Use volatility or fade a failed 160.50/161.00 sweep unless retests hold above.
EUR/USD — 1.1596 — Trap watch
- Market consensus: EUR/USD remains range-bound, with Fed risk and large post-Fed option caps overhead.
- Recommendation: Avoid midpoint chasing. Respect squeeze above 1.1608 or wait for 1.1563 acceptance.
GBP/USD — 1.3415 — Sell failed strength
- Market consensus: Sterling's relief rally faded, while UK CPI and BoE risk keep positioning cautious.
- Recommendation: Fade failed rebounds below 1.3418, but reduce aggression before UK CPI.
USD/CAD — 1.4008 — Squeeze risk
- Market consensus: Oil weakness, USD bid tone and one-sided retail shorts keep upside squeeze risk alive.
- Recommendation: Stay with squeeze pressure above 1.40, reassess into 1.4023/24 rejection risk.
EUR/GBP — 0.8644 — Rebound risk
- Market consensus: Sell-side views are split, but UK event risk leaves late EUR/GBP shorts exposed.
- Recommendation: Prefer corrective upside while 0.8628 holds, with 0.8662/73 the first test.
EUR/CHF — 0.9219 — Stop-run watch
- Market consensus: SNB risk and repeated rejection near 0.9230 keep the cross range-sensitive.
- Recommendation: Let 0.9228/30 sweep first, then fade only if the break fails.
--------------------
Futures / Spot FX Context
Although the market review above is based primarily on spot FX analysis, listed FX futures may provide a relevant and transparent way for traders to express or hedge views on the same underlying currency themes. Futures prices may differ from spot prices due to factors such as interest rate differentials, contract expiry, liquidity, and basis, so traders should always refer to the appropriate futures contract and real-time market data before making any decision.
CME Group FX futures offer a centrally cleared, regulated marketplace where counterparty credit risk is mitigated through CME Clearing. They also provide transparent order-book pricing and execution rules, including a first-on-price, first-to-fill framework, which can support fairer access to liquidity across market participants. These features may make futures suitable vehicles for traders who want exposure to major FX themes within a standardized, exchange-traded framework.
When charting futures, the data provided could be delayed. Traders working with the ticker symbols discussed in this idea may prefer to use CME Group real-time data plan on TradingView: tradingview.com/cme/ .
This consideration is particularly important for shorter-term traders, whereas it may be less critical for those focused on longer-term trading strategies.
General Disclaimer:
The trade ideas presented herein are solely for illustrative purposes forming a part of a case study intended to demonstrate key principles in risk management within the context of the specific market scenarios discussed. These ideas are not to be interpreted as investment recommendations or financial advice. They do not endorse or promote any specific trading strategies, financial products, or services. The information provided is based on data believed to be reliable; however, its accuracy or completeness cannot be guaranteed. Trading in financial markets involves risks, including the potential loss of principal. Each individual should conduct their own research and consult with professional financial advisors before making any investment decisions. The author or publisher of this content bears no responsibility for any actions taken based on the information provided or for any resultant financial or other losses.
6C Short — $6CU26 breakdown continues below 0.7180; short under HTF structure is firmly bearish with persistent lower highs/lower lows and price now breaking beneath the recent 0.7180-0.7200 shelf. LTF confirms with a failed reclaim above 0.7200 followed by expanding downside candles into fresh lows. Short continuation is actionable on a break of 0.7171, with invalidation back above the breakdown/retest area near 0.71855 and target at the next downside magnet around 0.7150.
📍 Entry: 0.71710
🛑 Stop: 0.71855
🎯 Target: 0.71500
⚖️ R:R: 1.45
I think I’ve finally cracked the code on this market.Last time I analyzed USD/CAD, I missed the mark because I was focused on a minor structure within a larger one. Now, I believe I have the order flow right. In my view, the price is moving toward the center.
Buy everything below the open on Monday, all in.
The Loonie’s Tug-of-War: Oil Support vs. Dollar Safe HavenThe Canadian dollar futures contract is currently trading around 0.7345, trapped in an unusual macroeconomic equilibrium. The Loonie is caught between two opposing forces: a sharp rise in oil prices that should support the Canadian dollar, and strong safe-haven demand for the U.S. dollar triggered by escalating military tensions between the United States and Iran. This balance is inherently unstable. When it eventually breaks, the move could be significant, and several institutional analyses suggest that the bias may gradually be shifting toward a stronger Canadian dollar.
Fundamental analysis: strengthening oil support
Coordinated strikes involving the United States and Israel against Iran have pushed oil prices sharply higher, with WTI climbing above $110 per barrel and Brent reaching $114. Iraqi production is reportedly down significantly, and the Strait of Hormuz is facing partial disruptions.
For Canada, which exports more than three million barrels of oil per day to the United States, such developments should normally be clearly supportive for the Canadian dollar.
However, USD/CAD has remained confined to a relatively narrow range throughout the week. The positive impact of higher oil revenues for Canada has been offset by the safe-haven appeal of the U.S. dollar during periods of geopolitical stress.
Another important element is Canada’s relative insulation from certain U.S. tariffs. In the current context, institutional positioning appears to be gradually shifting toward a more constructive stance on the Loonie, even though the U.S. dollar remains structurally strong.
Technical analysis: compression before a breakout
On the daily timeframe, the Canadian dollar continues to trade within a zone of indecision, and several classic signals associated with a compression phase are emerging.
The 20-day moving average is acting as a pivot level, while Bollinger Bands are tightening, a configuration frequently observed before a significant directional move.
A breakout above the 0.7420–0.7450 area would confirm that oil-driven dynamics are dominating and could trigger an acceleration linked to dealer positioning and momentum flows.
Conversely, if the 0.7300–0.7320 zone were to give way, it would confirm that the U.S. dollar’s safe-haven demand remains the dominant force in the market.
From a volume profile perspective, the 0.7300–0.7340 range contains the bulk of recent traded volume, reinforcing the idea that this zone represents the current equilibrium level where buyers and sellers are balanced.
Sentiment analysis: bearish retail positioning, more constructive institutions
Retail sentiment data shows that roughly two-thirds of traders are currently long USD/CAD, meaning they are positioned against the Canadian dollar. Such imbalances are often interpreted through a contrarian lens, which can be supportive for a potential appreciation of the CAD.
Meanwhile, weekly COT data indicates that asset managers maintain a moderately long position in Canadian dollar futures. This suggests a constructive institutional bias toward the currency, though positioning is far from extreme and therefore leaves room for additional accumulation if the macro environment becomes more favorable.
Options analysis
The options chain reveals a notable feature: open interest is heavily concentrated around the 0.7350–0.7400 area, which corresponds almost exactly to the current trading range.
There is also a meaningful accumulation of call options around the 0.74 strike. This level could play an important role if a breakout occurs, as dealers may need to adjust their hedging activity, potentially amplifying directional momentum.
Implied volatility currently reflects a degree of uncertainty regarding the next major move. However, the structure of the options market suggests that participants are positioning for a directional expansion once the current compression phase resolves.
Trade idea: bias toward an upside breakout
Given the current compression, the supportive institutional signals for the Canadian dollar, and the technical structure of the market, the bias may lean toward a bullish breakout scenario.
Primary scenario: bullish breakout
Entry: Buy above 0.7420 (daily close confirmation)
Stop: 0.7340
Target 1: 0.7500
Target 2: 0.7550
Alternative scenario: bearish breakdown
Entry: Sell below 0.7300 (daily close confirmation)
Stop: 0.7380
Target 1: 0.7220
Target 2: 0.7145
Hedging via options
For traders seeking exposure to a potential Canadian dollar move while limiting directional risk, one possible strategy is to buy a strangle by simultaneously purchasing an out-of-the-money call and an out-of-the-money put.
This approach allows traders to benefit from a volatility expansion regardless of the direction of the move, provided the price travels far enough beyond the current range over the coming weeks.
Such strategies are particularly relevant during compression phases, when realized volatility is low but the probability of a sharp breakout is increasing.
Final thoughts
The Canadian dollar currently sits in a fragile equilibrium between two powerful macro forces: rising oil prices that support the currency, and persistent safe-haven demand for the U.S. dollar.
This compression could precede a meaningful directional move.
Several potential catalysts stand out:
developments in geopolitical tensions in the Middle East
further changes in global oil market dynamics
any shift in tone from the Federal Reserve regarding monetary policy
In this environment, a breakout above 0.7420 could represent the technical signal confirming the start of a more pronounced move in favor of the Canadian dollar.
---
When charting futures, the data provided could be delayed. Traders working with the ticker symbols discussed in this idea may prefer to use CME Group real-time data plan on TradingView: tradingview.com/cme/ .
This consideration is particularly important for shorter-term traders, whereas it may be less critical for those focused on longer-term trading strategies.
General Disclaimer:
The trade ideas presented herein are solely for illustrative purposes forming a part of a case study intended to demonstrate key principles in risk management within the context of the specific market scenarios discussed. These ideas are not to be interpreted as investment recommendations or financial advice. They do not endorse or promote any specific trading strategies, financial products, or services. The information provided is based on data believed to be reliable; however, its accuracy or completeness cannot be guaranteed. Trading in financial markets involves risks, including the potential loss of principal. Each individual should conduct their own research and consult with professional financial advisors before making any investment decisions. The author or publisher of this content bears no responsibility for any actions taken based on the information provided or for any resultant financial or other losses.
High-Potential PatternThe United States and Canada have always maintained a deeply intertwined economic relationship, shaped by nearly 9,000 kilometers of shared border and an unparalleled level of trade integration. Within this framework, the USD/CAD pair holds a special place among major currencies: it frequently alternates between extended directional trends and prolonged consolidation phases. Since early summer, the dominant trend has clearly worked against the Canadian dollar, with a steady and persistent rise in USD/CAD. As this move now appears mature, more analysts and investors are beginning to anticipate a potential turning point. The central question becomes: can the CAD finally initiate a sustainable reversal?
Fundamental Analysis
The Bank of Canada cut its policy rate to 2.25% on October 29, marking its fourth reduction of the year. However, unlike its previous decisions, the tone of the accompanying statement was noticeably more measured. The central bank now emphasizes that further rate cuts are not guaranteed, noting that current monetary policy is consistent with the evolution of inflation and labor market dynamics. While acknowledging the economic slowdown, the BoC views current financial conditions as sufficiently accommodative to help the economy navigate this adjustment period. In other words, the bank is signaling a technical pause after an already substantial easing cycle. This stance limits expectations for additional rapid cuts, offering structural support to the CAD by stabilizing Canada–U.S. rate differentials.
In the United States, the Federal Reserve also cut rates by 25 basis points on the same day. However, Chair Jerome Powell struck a more hawkish tone than anticipated, stressing macroeconomic uncertainty and the need to preserve flexibility before considering further easing. As a result, the implied probability of a rate cut in December dropped from 95% at the end of last month to less than 50% today, according to the CME FedWatch indicator.
At the intersection of these two dynamics, the CAD benefits from relative support: the BoC has more explicitly signaled the end of its cycle, while the Fed has merely slowed its pace without ruling out additional easing. This imbalance creates an environment where a CAD rebound appears fundamentally credible.
Commodity prices remain an important driver of CAD movements, but they currently have a neutral to slightly positive influence. Oil remains too weak to provide strong support, but the resilience of copper and industrial metals helps stabilize the Loonie after several weeks of pressure.
Technical Analysis
From a chart perspective, an initial attempt at a Canadian dollar rebound is emerging. The USD/CAD pair is testing key support at 1.40, a pivotal level watched closely across the market.
The CAD December futures contract (6CZ5) is moving away from a recent low of 0.7086 set on November 6. To confirm a more meaningful reversal, the CAD must break through successive resistance zones at 0.7220, 0.7320, and 0.7440. A move toward the latter would represent a genuine test and a potential profit-taking zone.
The current structure resembles an accumulation phase following a long bearish sequence. As long as support at 0.7086 holds, the odds of a rebound remain valid.
Sentiment Analysis
FX/CFD broker data shows balanced positioning on USD/CAD. Retail traders display no significant directional bias for now, limiting the availability of contrarian signals. However, it is well-established that as the CAD strengthens, retail traders tend to increase their short exposure, a typical behavior during trend reversals.
On the institutional side, the U.S. government shutdown has prevented the publication of the weekly COT report for several weeks, depriving the market of a key indicator. Nonetheless, several major U.S. bank desks continue to share their views:
JPMorgan believes that although Canadian fundamentals have improved only modestly, they remain strong enough to support a corrective move in the CAD.
Morgan Stanley and Goldman Sachs note that the USD has lost part of its post-FOMC momentum, opening the door to a temporary rebalancing in favor of cyclical currencies, including the CAD.
Crédit Agricole CIB highlights that U.S.–Canada data divergences now lean in favor of a lower USD/CAD in the near term.
Institutional consensus remains cautious, but several major players have begun positioning for a USD/CAD correction, reinforcing the notion of a potential inflection point.
Listed Options Analysis
Positions in listed options, assessed via the CME Group’s Open Interest Heatmap, reveal several areas of interest that may influence price behavior.
For the 6CZ5 contract, although put clusters appear between 0.7150 and 0.70, indicating lingering downside risk, there is a notable concentration of calls around the 0.7200 and 0.7300 strikes. This accumulation of open interest creates attraction zones that may exert a magnetic effect if the CAD initiates a normalization move.
Interestingly, a significant density of positions is also visible between 0.74 and 0.7450, aligned with the previously mentioned technical resistance. This suggests that if the market begins to rebound, gamma flows and option-seller repositioning could facilitate a move toward 0.7440 rather than impede it.
Trade Idea
Buy 6CZ5 at current levels, targeting a move toward 0.7320 and then 0.7440. Set a stop on a daily close below 0.7086, the November 6 low, with the option to re-enter near 0.70 if needed.
This strategy relies on a gradual CAD recovery supported by aligned fundamentals, technicals, and options-market signals.
Final Thoughts
Recent U.S. dollar strength, fueled by Jerome Powell’s more hawkish tone, has given the USD renewed momentum. Paradoxically, this may represent an opportunity to buy CAD at better levels. The Bank of Canada appears to have reached the end of its easing cycle, while nothing suggests the Fed is ruling out further cuts in the coming months, particularly in an environment of reduced macro visibility and still-restrictive financial conditions.
Taken together, fundamentals, technicals, sentiment, and options positioning, the overall picture favors a corrective rebound in the CAD after a lengthy period of weakness. If support around 0.7086 continues to hold, the scenario of a move toward 0.7320 and then 0.7440 gains substantial credibility.
---
When charting futures, the data provided could be delayed. Traders working with the ticker symbols discussed in this idea may prefer to use CME Group real-time data plan on TradingView: tradingview.com/cme/ .
This consideration is particularly important for shorter-term traders, whereas it may be less critical for those focused on longer-term trading strategies.
General Disclaimer:
The trade ideas presented herein are solely for illustrative purposes forming a part of a case study intended to demonstrate key principles in risk management within the context of the specific market scenarios discussed. These ideas are not to be interpreted as investment recommendations or financial advice. They do not endorse or promote any specific trading strategies, financial products, or services. The information provided is based on data believed to be reliable; however, its accuracy or completeness cannot be guaranteed. Trading in financial markets involves risks, including the potential loss of principal. Each individual should conduct their own research and consult with professional financial advisors before making any investment decisions. The author or publisher of this content bears no responsibility for any actions taken based on the information provided or for any resultant financial or other losses.
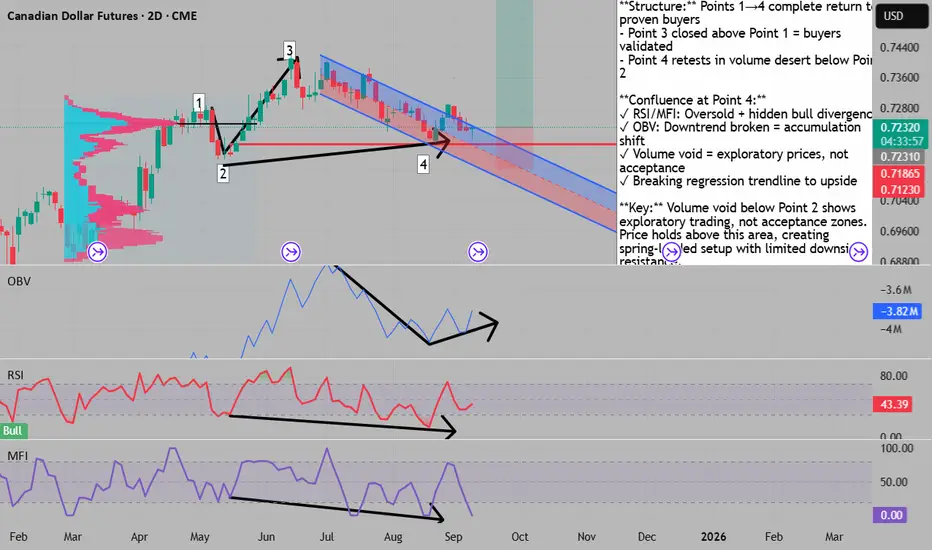
The Exploratory Void: CAD's Volume Desert Signals Reversal# The Exploratory Void: CAD's Volume Desert Signals Reversal
## The Setup Architecture
Price has completed a textbook return journey from **Point 1 to Point 4**, but the real story lies in what happened at **Point 3**. When Point 3 closed decisively above Point 1, it validated a critical market structure shift. Since Point 3 represents the terminus of the swing originating from Point 2, these levels now constitute **proven buyers** rather than the sellers who dominated at Point 1.
## The Volume Desert Phenomenon
The area below **Point 2** represents what I call a **"volume desert"** - a zone where trading activity has dried up to minimal levels. This isn't just low volume; it's a rejection of these price levels by the market collective. These sparse trades represent **exploratory probes** rather than areas of genuine acceptance. Importantly, **Point 4 respects this level by holding above Point 2**, refusing to enter the volume void - a bullish signal that buyers are defending higher ground.
## Convergence Signals at Point 4
**Momentum Oscillator Alignment**
• **RSI:** Oversold + Hidden bullish divergence
• **MFI:** Oversold + Hidden bullish divergence
The dual oversold readings combined with hidden divergences on both indicators suggest this pullback is exhausted.
**Volume Flow Reversal**
The **OBV downtrend line has been definitively broken**, indicating a shift in the underlying accumulation/distribution dynamics. Smart money appears to be accumulating during this retracement.
**Regression Channel Breakout**
Price action is currently **challenging the regression trendline to the upside**. Rather than rejecting from this mathematical mean, we're seeing acceptance above it - a bullish structural development.
## The Turning Point Reaction
The most recent bar at **Point 4** shows a textbook bullish reversal formation right at the critical juncture where multiple technical factors converge. This isn't a gradual turn; it's a **sharp rejection** that confirms buyers are defending this zone aggressively.
## Market Psychology Interpretation
The journey from **Points 1→4** tells a story of market psychology evolution:
• **Point 1:** Sellers in control
• **Point 2:** Initial buyer emergence
• **Point 3:** Buyers prove dominance by closing above Point 1
• **Point 4:** Retest of buyer commitment above the volume void
The lack of volume below Point 2 creates a **spring-like effect** - without sellers to provide resistance, any buying pressure can create outsized moves.
## Trade Dynamics
This setup combines:
• **Structural confirmation** (proven buyers at Point 3)
• **Technical divergences** (RSI/MFI)
• **Volume analysis** (both OBV breakout and volume void)
• **Mathematical validation** (regression line break)
The confluence suggests a **high-probability reversal scenario** where risk can be clearly defined below Point 4.
## Critical Observation
The fact that **Point 4 holds above Point 2** is particularly significant. Despite the retracement from Point 3, buyers defended the Point 2 level, refusing to let price enter the "exploratory" volume desert below. This respect for Point 2 as support, combined with the volume void beneath it, creates an **asymmetric opportunity**. The low-volume area below acts as a deterrent to further selling, while the proven buyer zone above Point 1 provides a target for the next expansion.
---
**Key Takeaway:** The convergence of volume void dynamics, momentum divergences, and structural support at Point 4 creates an institutional-grade reversal setup with clearly defined risk parameters.
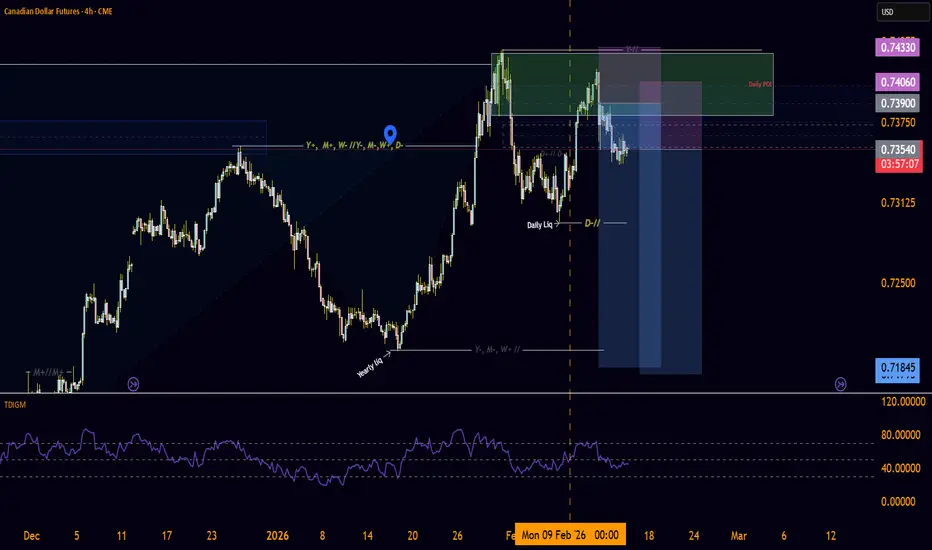
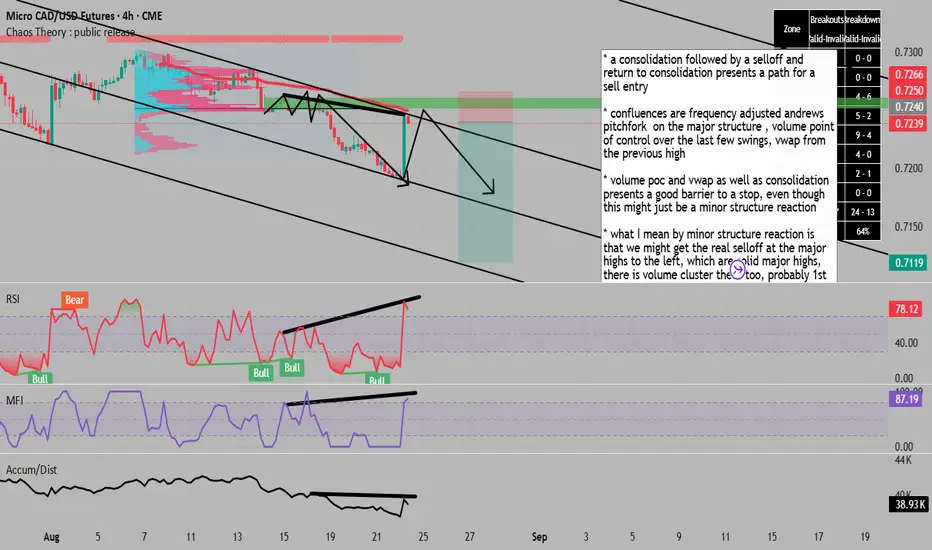
price returns to minor structure, but too many confluences =SELL* a consolidation followed by a selloff and return to consolidation presents a path for a sell entry
* confluences are frequency adjusted andrews pitchfork on the major structure , volume point of control over the last few swings, vwap from the previous high
* volume poc and vwap as well as consolidation presents a good barrier to a stop, even though this might just be a minor structure reaction
* what I mean by minor structure reaction is that we might get the real selloff at the major highs to the left, which are solid major highs, there is volume cluster there too, probably 1st or second standard deviation off the vwap and 1.5 , 1.618 or 2 level on andrews
* we could just break above and use that consolidation as support for an expanding structure.
* it's all about what the chart is doing now, not what we think, because any of those thoughts could have randomly come into my mind first.
* if I did not have all these tools pointing right at price I would wait for price to come up with an alert, but its just too much co-incidence for me not to try it.
* bearish divergence on rsi, mfi and accum/dist
* also overbought on rsi and mfi
* open market sells
clear downtrend with continuation signals using divergence+chaos1. sellers push down
2. buyers make the first stand. strong volitile candle.... all for nothing ...
regardless of lack of buyers they have not accumulated enough energy for anything
significant
3. a double top in the local scope
* notice #1 and #3, both are highs , #1 is a proven high and #3 is a local high
* notice the peaks of the RSI and MFI , using a horizontal line
* did you know we can use this to predict future reversals? horizontal lines off the
rsi or mfi ?
* due ot this and the obvious downtrend, with the lack of buyer activity and failure of that
big buyer wick, I believe we have a strong case for the next leg down.
* not to mention the hidden bear divergence on mfi + rsi too
* I see the overbought, but this can be ignored during times of strong volatility
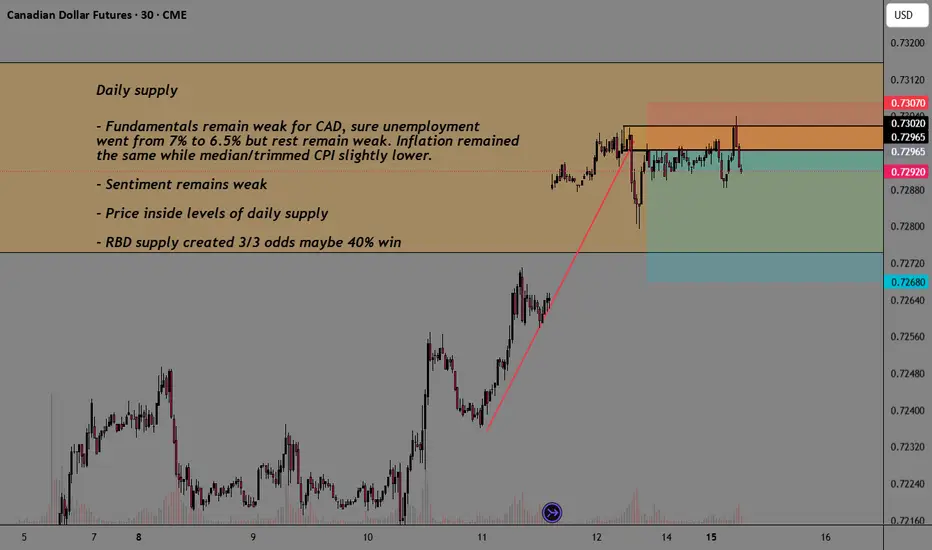
6C : Short levelIt is possible to take a short-term short from the red level with an arrow. I would recommend taking short-term trades and not sitting around waiting for huge profits. But this is already at your discretion.
⚠️ VOLATILITY WARNING ⚠️
Trading around major news can be extremely unpredictable. Trade responsibly!
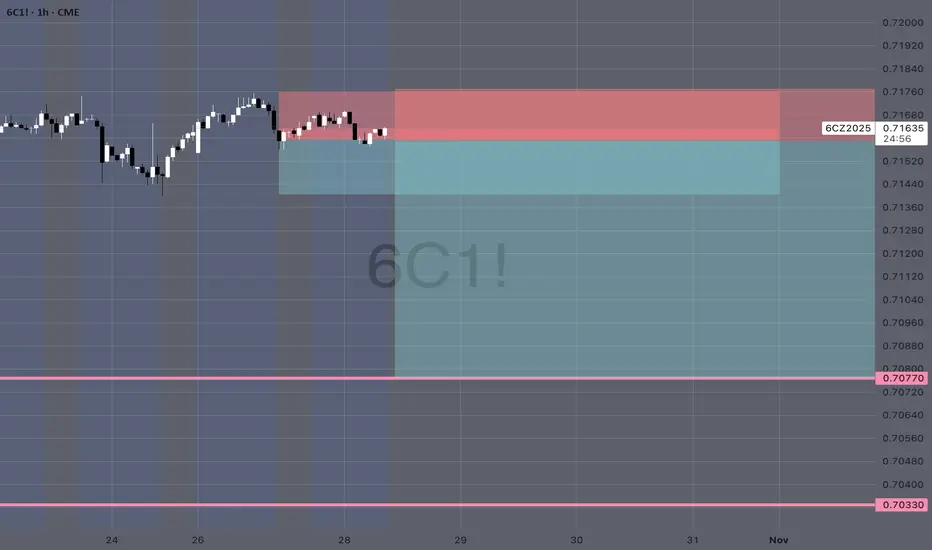
Canadian Dollar Futures (6C1!) Nears Key Monthly SupplyThe Canadian Dollar Futures (6C1!) remain in a downtrend, now testing a critical monthly supply zone after an initial rejection. With Commercials heavily short, Smart Money flat, and Retail traders still bullish, this setup favors another potential downside move. Traders should watch for a retest or breakout spike for optimal short entries.
COT Report: Who’s Betting on the Loonie?
Commercials (Big Players): Increasing short positions, signaling expectations of further downside.
Non-Commercials (Smart Money): Flat, showing hesitation—no strong conviction in either direction.
Retail Traders: Still net long, often a contrarian indicator at key turning points.
This alignment suggests that while momentum may see short-term bounces, the broader trend remains bearish.
✅ Please share your thoughts about 6C1! in the comments section below and HIT LIKE if you appreciate my analysis. Don't forget to FOLLOW ME; you will help us a lot with this small contribution.