SENTUSDT SPOT
No trades
No trades
Peers for comparison
Open interest
Open interest
Price
Liquidations
Long
Short
Price
SENT Poised to Climb: Key Technicals Align for a Long MoveBYBIT:SENTUSDT.P
SENT — Long
Stop loss: 0.014547
Take profit: 0.014944
SENT is showing bullish potential 📈. On the 2h chart, the SMA20 at 0.0152 is above the SMA50 at 0.0148, indicating a positive trend alignment. Aroon indicators confirm strength with Aroon Up at 85.7, heavily outweigh
SENT at a Critical Resistance — Breakout or Rejection?SENT/USDT is currently in a very interesting position as price is testing the main Descending Trendline that has been pressuring price action for several months.
The yellow downtrend line shows a consistent structure of Lower Highs (LH) since the peak around $0.02850. As long as price remains below
SENTUSDT 1D#SENT is on the verge of a potential breakout. Keep an eye on the daily chart. In case of a breakout above the descending resistance and the Ichimoku Cloud, the potential upside targets are:
🎯 $0.01772
🎯 $0.01963
🎯 $0.02154
🎯 $0.02426
🎯 $0.02772
⚠️ Always use a tight stop-loss and maintain proper
Sent - Bullish - RR: 1:11Dear my friends,
Observing the SENT/USDT trading pair on the 4H timeframe, I spotted an opportunity and would like to share it with you.Looking at the downtrend line since March, the price has truly respected this trendline. After touching the trendline 3 times, the price fell back each time. Only o
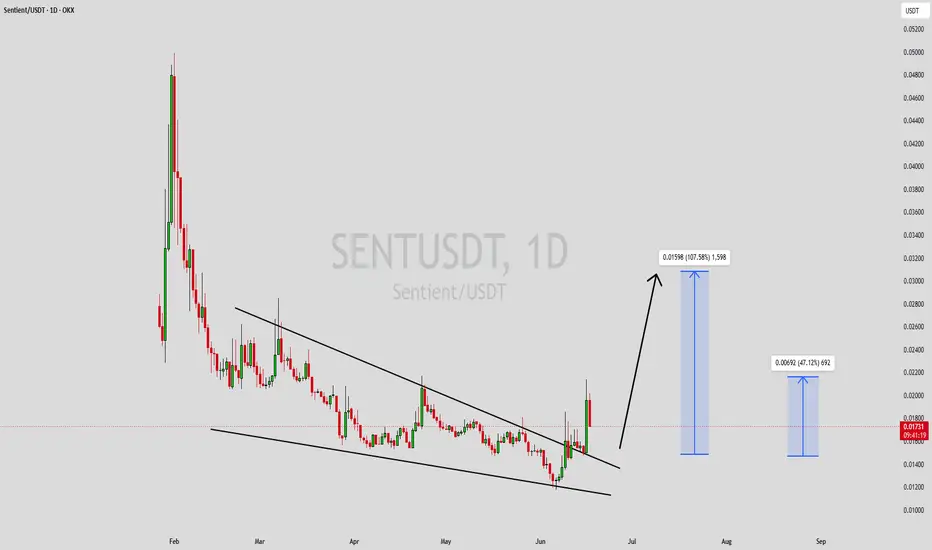
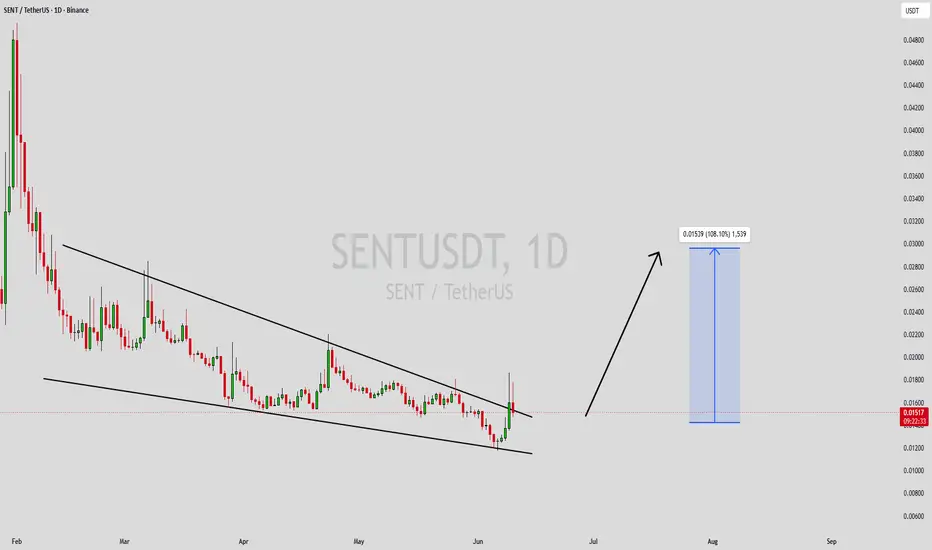
SENTUSDT Forming Falling WedgeSENTUSDT is forming a clear falling wedge pattern, a classic bullish wave signal that often indicates an upcoming breakout. The price has been consolidating within a narrowing range, suggesting that selling pressure is weakening while buyers are beginning to regain control. With consistent volume co
SENTUSDT 1D#SENT has broken above both the falling wedge resistance and the SMA50 on the daily chart. The daily candle has not closed yet, but RSI and MACD are indicating the potential for further bullish continuation.
The potential upside targets are:
🎯 $0.01923
🎯 $0.02182
🎯 $0.02391
🎯 $0.02600
🎯 $0.02898
🎯
SENTUSDT Forming Falling WedgeSENTUSDT is forming a clear falling wedge pattern, a classic bullish wave signal that often indicates an upcoming breakout. The price has been consolidating within a narrowing range, suggesting that selling pressure is weakening while buyers are beginning to regain control. With consistent volume co
SENTUSDT 1D#SENT is moving inside a falling wedge pattern on the daily chart. In case of a breakout above the wedge resistance and the daily EMA50, the potential upside targets are:
🎯 $0.01923
🎯 $0.02182
🎯 $0.02391
🎯 $0.02600
🎯 $0.02898
🎯 $0.03278
⚠️ Always use a tight stop-loss and maintain proper risk mana
See all ideas
Summarizing what the indicators are suggesting.
Oscillators
Neutral
Oscillators
Neutral
Summary
Neutral
Summary
Neutral
Summary
Neutral
Moving Averages
Neutral
Moving Averages
Neutral
Frequently asked questions
The current price of SENTUSDT SPOT (SENT) is 0.016580 USDT.
For broader market analysis, dive into the technicals on the SENT price chart and read the latest SENTUSDT SPOT news:
– Sentient (SENT) - INDODAX Listing - 05 March 2026
For broader market analysis, dive into the technicals on the SENT price chart and read the latest SENTUSDT SPOT news:
– Sentient (SENT) - INDODAX Listing - 05 March 2026
Markets don't sleep, here's what's going on with SENTUSDT SPOT at the moment:
– Sentient (SENT) - INDODAX Listing - 05 March 2026
See more updates in real-time with our News Flow.
– Sentient (SENT) - INDODAX Listing - 05 March 2026
See more updates in real-time with our News Flow.
It's worth checking SENT price change for various periods to get the full picture:
– 1 day — +0.31%
– 1 week — −9.45%
– 1 month — −17.53%
SENTUSDT SPOT's all-time low was 0.002000 USDT (Jan 22, 2026), and its highest price is 0.049426 USDT (Feb 1, 2026). Find more dynamics in the Crypto Heatmap and on the SENT price chart.
– 1 day — +0.31%
– 1 week — −9.45%
– 1 month — −17.53%
SENTUSDT SPOT's all-time low was 0.002000 USDT (Jan 22, 2026), and its highest price is 0.049426 USDT (Feb 1, 2026). Find more dynamics in the Crypto Heatmap and on the SENT price chart.
SENTUSDT SPOT is a volatile asset, and investing in it carries both potential risks and rewards. It may not be suitable for every investor. Before investing, consider the following:
– Volatility: Cryptocurrency prices can change rapidly. Conduct technical analysis, review fundamental and market information before making a decision.
– Security: Use reputable exchanges and secure wallets to help protect your assets. Explore reliable brokers and research any service provider before using it.
– Trading strategy: Different approaches carry different levels of risk. Learn how spot and derivatives markets work, follow crypto news, explore the Crypto Screener, and review community trading ideas.
– Diversification: Spreading investments across multiple assets may help reduce concentration risk.
– Long-term perspective: Some investors choose to hold cryptocurrencies for the long term to weather short-term price fluctuations.
– Volatility: Cryptocurrency prices can change rapidly. Conduct technical analysis, review fundamental and market information before making a decision.
– Security: Use reputable exchanges and secure wallets to help protect your assets. Explore reliable brokers and research any service provider before using it.
– Trading strategy: Different approaches carry different levels of risk. Learn how spot and derivatives markets work, follow crypto news, explore the Crypto Screener, and review community trading ideas.
– Diversification: Spreading investments across multiple assets may help reduce concentration risk.
– Long-term perspective: Some investors choose to hold cryptocurrencies for the long term to weather short-term price fluctuations.
SENTUSDT SPOT (SENT) reached its highest price of 0.049426 USDT on Feb 1, 2026.
View more SENTUSDT SPOT dynamics on the SENT price chart and scan other coins to find out what crypto hits its all-time high.
Buying SENTUSDT SPOT depends on your goals, risk tolerance, and understanding of the market. Crypto markets are famous for their volatility, that's why we always recommend you studying all the available stats before adding crypto assets to your portfolio. One of them is technical ratings — a score that suggests buying or selling an asset.
SENTUSDT SPOT's ratings are:
– Today: sell
– 1-week: sell
– 1-month: strong sell
Worth considering before buying
– Investment horizon
– Risk tolerance
– Overall portfolio fit
Potential market scenarios
– Price growth during strong demand
– Declines during corrections or negative news
– Short-term volatility
Find inspiration in SENTUSDT SPOT trading ideas and keep track of what's moving crypto markets with our crypto news feed.
SENTUSDT SPOT's ratings are:
– Today: sell
– 1-week: sell
– 1-month: strong sell
Worth considering before buying
– Investment horizon
– Risk tolerance
– Overall portfolio fit
Potential market scenarios
– Price growth during strong demand
– Declines during corrections or negative news
– Short-term volatility
Find inspiration in SENTUSDT SPOT trading ideas and keep track of what's moving crypto markets with our crypto news feed.
Sentiment around SENTUSDT SPOT varies and changes with market conditions, news, and price trends.
How to gauge trader sentiment:
– Trading ideas: See how traders analyze SENT, including bullish and bearish setups
– Minds: Follow real-time opinions, reactions, and discussions
– Crypto Coins Screener: Set up the Sentiment filter to see traders' attitudes across the market
What to look for:
– Common trends in sentiment (bullish vs bearish)
– Key price levels and scenarios traders are watching
– Reactions to news or market events
How to gauge trader sentiment:
– Trading ideas: See how traders analyze SENT, including bullish and bearish setups
– Minds: Follow real-time opinions, reactions, and discussions
– Crypto Coins Screener: Set up the Sentiment filter to see traders' attitudes across the market
What to look for:
– Common trends in sentiment (bullish vs bearish)
– Key price levels and scenarios traders are watching
– Reactions to news or market events
The safest way to buy SENTUSDT SPOT is through a well-known and reliable crypto exchange. Create an account, fund it, and place a buy order.
You can trade SENTUSDT SPOT directly from TradingView:
– Choose an exchange: Explore our supported trading partners and pick one that fits your needs
– Compare options: View available exchanges side by side to evaluate fees and features
– Connect your account: Open Supercharts, click "Trade", select your exchange, and log in
– Start trading: Place orders directly from the chart
Tip: If you're new to trading, try paper trading first — it lets you practice strategies in real market conditions without risking funds.
You can trade SENTUSDT SPOT directly from TradingView:
– Choose an exchange: Explore our supported trading partners and pick one that fits your needs
– Compare options: View available exchanges side by side to evaluate fees and features
– Connect your account: Open Supercharts, click "Trade", select your exchange, and log in
– Start trading: Place orders directly from the chart
Tip: If you're new to trading, try paper trading first — it lets you practice strategies in real market conditions without risking funds.