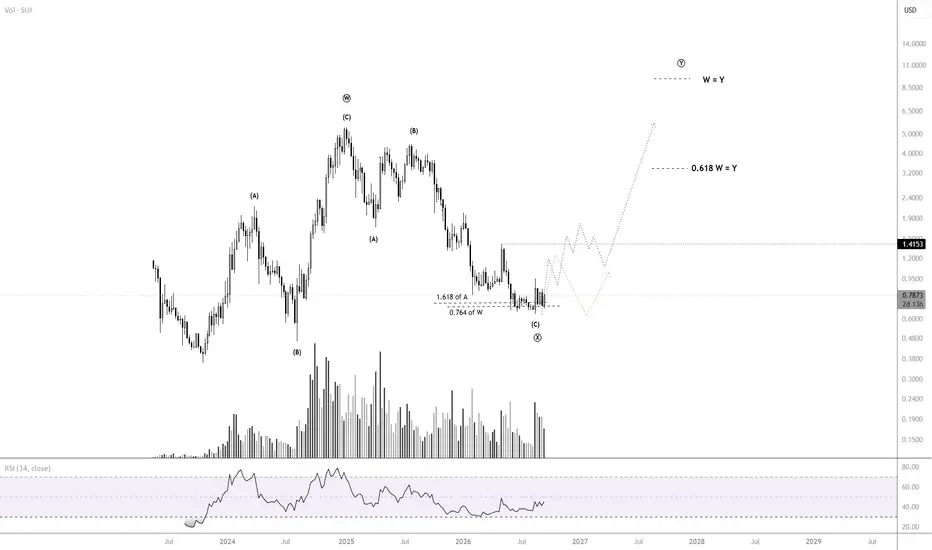
SUI massive risk/reward reversal.SUI around $0.82–$0.85 is becoming a very interesting risk/reward setup. The chart shows a major rejection from the $0.64–$0.70 area followed by a powerful move back toward $0.85, with volume expanding significantly — exactly what you want to see during a potential trend reversal. If SUI reclaims $0
SUI: Consolidating at Lower Boundary of Daily Expanding TriangleSUI: Consolidating at Lower Boundary of Daily Expanding Triangle – Macro Long Setup Targeting New All-Time Highs
SUI is presenting a compelling macro position-building opportunity as its daily market structure confirms a technical retest of the lower boundary within a large expanding triangle patt
SUI: Tight 8-Week Consolidation Below $1 HandleSUI: Tight 8-Week Consolidation Below $1 Handle – Expanding Triangle Model and the Virtue of Patience
SUI has been maintaining a remarkably disciplined range-bound structure, logging a streak of 8 consecutive weekly candles compressed entirely beneath the $1.00 psychological round-number ceiling.
SUI: Tight Weekly CompressionSUI: Tight Weekly Compression – All-Time High Breakout Scenario Based on Historical Cycles
SUI is entering a highly pivotal technical compression phase on the weekly timeframe, carving out a compelling macro trading opportunity. The current price action is moving sideways within an extremely tight
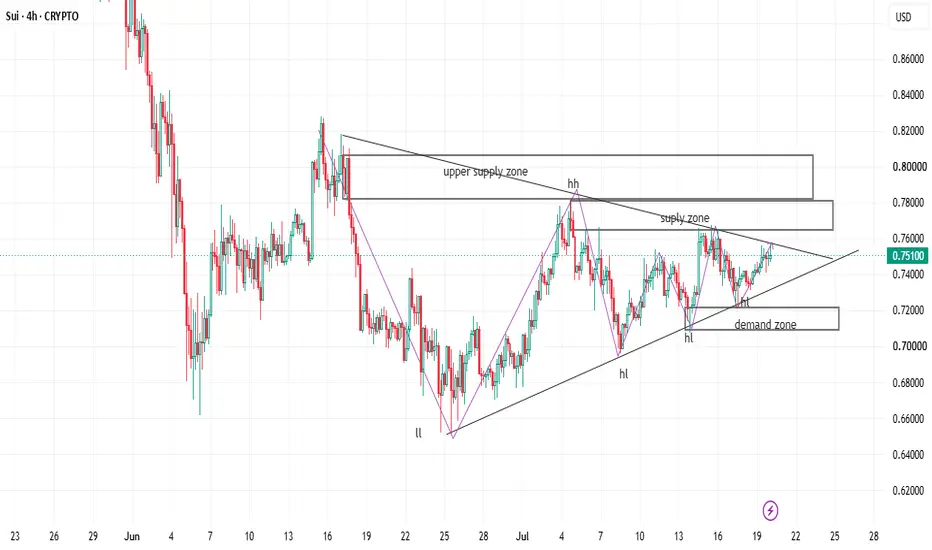
SYMMENTYRICAL TRIANGLE, A BIG CONSOLIDATION ON SUI/USDTThe symmetrical triangle which has formed on the price of sui is a consolidation phase that has been happening ever since the price reached the swing low , where the price never broke the low it kept correcting forming higher lows. Converging buyer and sellers forming a symmetrical triangle , whi
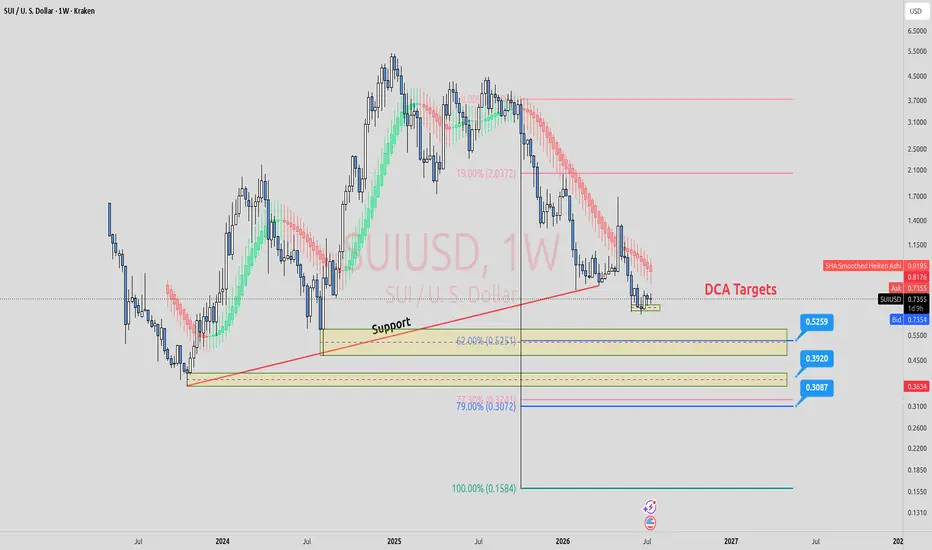
SUI | DCA |Is Still Too Expensive For Me.These are my planned DCA buy targets for SUI.
The first DCA zone has the highest probability of being reached and holding. The lower levels are simply additional targets if the market continues to move down.
For my Fibonacci levels, I used the large bearish impulse candle as the starting point, as
SUI: Consolidation at Historical SupportSUI: Consolidation at Historical Support – Macro Pattern Breakout Opportunity Signals New Growth Cycle
SUI is displaying impressive structural resilience, opening up a highly promising technical setup on the macro timeframe. Observing the visual weekly data on chart , SUI's price structure has for
See all ideas
Summarizing what the indicators are suggesting.
Oscillators
Neutral
Oscillators
Neutral
Summary
Neutral
Summary
Neutral
Summary
Neutral
Moving Averages
Neutral
Moving Averages
Neutral
Displays a symbol's price movements over previous years to identify recurring trends.