In-depth trading ideas
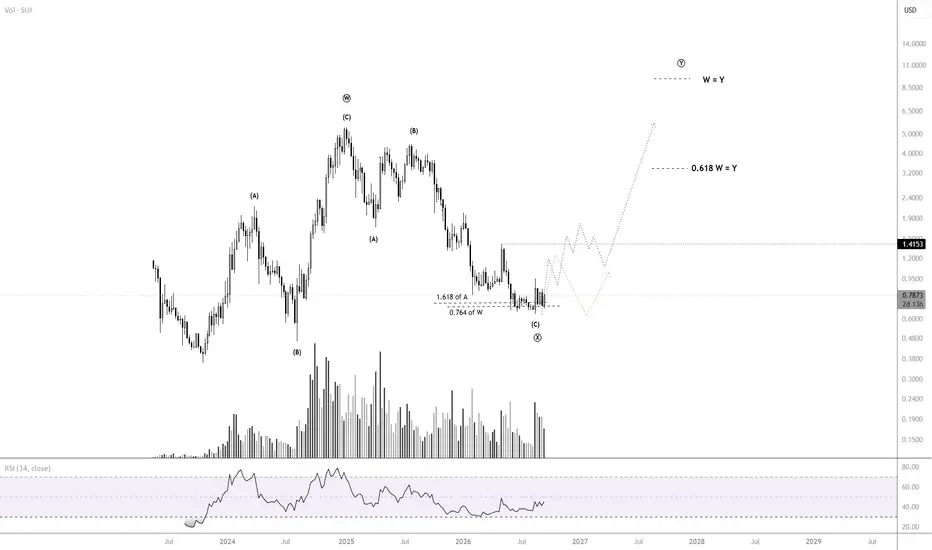
SUI massive risk/reward reversal.SUI around $0.82–$0.85 is becoming a very interesting risk/reward setup. The chart shows a major rejection from the $0.64–$0.70 area followed by a powerful move back toward $0.85, with volume expanding significantly — exactly what you want to see during a potential trend reversal. If SUI reclaims $0.90–$1.00, the next major levels are roughly $1.25–$1.40, followed by $2.00 and potentially $3+ in a strong crypto cycle. Fundamentally, SUI is moving far beyond the “another L1” narrative, with development around stablecoin payments, institutional finance, Bitcoin DeFi and AI-agent infrastructure. It also now has the 21Shares Sui ETF trading on Nasdaq, giving traditional investors regulated SUI exposure. And the Eric Trump connection is factual: World Liberty Financial, the Trump-family-backed crypto venture, partnered with Sui and said it planned to include Sui assets in its strategic “Macro Strategy” reserve; Eric Trump was identified as WLF’s Web3 Ambassador and publicly endorsed the collaboration. That doesn't mean Eric Trump is personally accumulating SUI — there is no solid evidence for that — but the strategic relationship is real. At ~$0.83, I see $0.64–$0.70 as the major invalidation zone, $1.00 as the first confirmation, and $1.25–$1.40 as the next major breakout target. The combination of a heavily reset chart + expanding utility + institutional access + the WLF relationship makes SUI one of the more interesting high-risk/high-upside setups in crypto right now. COINBASE:SUIUSD
CRYPTOCAP:SUI not financial advice
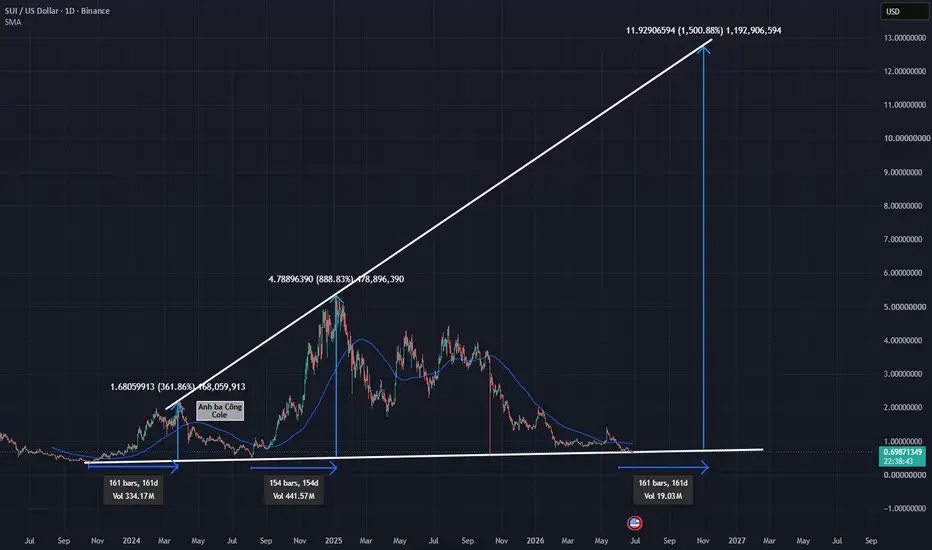
SUI: Consolidating at Lower Boundary of Daily Expanding TriangleSUI: Consolidating at Lower Boundary of Daily Expanding Triangle – Macro Long Setup Targeting New All-Time Highs
SUI is presenting a compelling macro position-building opportunity as its daily market structure confirms a technical retest of the lower boundary within a large expanding triangle pattern. Historical price behavior highlights that every touchpoint along this primary support baseline previously ignited an explosive expansion leg, propelling price action directly toward the upper boundary ceiling.
Based on the visual data from the daily chart , two prior structural cycles delivered massive rallies of 361.8% and 888.8% respectively, each requiring an extended accumulation duration exceeding 150 days (161 days and 154 days). Currently, price candles are coiling tightly above the $0.670 support floor, positioned under the dynamic MA100 trendline. This prolonged sideways phase represents a necessary energy-building window to absorb overhead supply before launching the next markup wave.
This technical framework delivers a high-edge macro Long execution opportunity featuring superior risk-to-reward parameters. The optimal trading strategy is to patiently accumulate Long positions around the current $0.670 zone, placing a tight protective stop-loss parameter directly beneath the lower triangle support boundary. The strategic long-term take-profit target aims toward the upper channel boundary around the $12.000 mark.
Disclaimer: This is not financial advice, DYOR.
SUI: Tight 8-Week Consolidation Below $1 HandleSUI: Tight 8-Week Consolidation Below $1 Handle – Expanding Triangle Model and the Virtue of Patience
SUI has been maintaining a remarkably disciplined range-bound structure, logging a streak of 8 consecutive weekly candles compressed entirely beneath the $1.00 psychological round-number ceiling. Looking back at historical weekly price action, whenever this asset concludes a similar tight accumulation phase, the market subsequently witnesses an explosive rally, progressively shaping a macro expanding triangle framework.
Based on the visual data from the weekly chart , two previous explosive expansion cycles propelled prices to conquer fresh historic highs. Should this historical pattern repeat itself, SUI holds the structural potential to launch a massive multi-leg wave, aiming directly at a macro supercycle target above the $10.00 threshold in the future.
However, the broader crypto market environment currently remains subdued and lacks decisive liquidity drivers. Entering positions prematurely during a prolonged sideways lull introduces the risk of capital stagnation. Consequently, the smartest trading approach right now is to remain patient on the sidelines, awaiting confirmed volume expansion and a decisive daily breakout close before executing trend-following Long positions.
Disclaimer: This is not financial advice, DYOR.
SUI: Tight Weekly CompressionSUI: Tight Weekly Compression – All-Time High Breakout Scenario Based on Historical Cycles
SUI is entering a highly pivotal technical compression phase on the weekly timeframe, carving out a compelling macro trading opportunity. The current price action is moving sideways within an extremely tight volatility range. In market structure theory, this persistent consolidation indicates that selling pressure is completely exhausted, allowing institutional liquidity to quietly accumulate positions in preparation for the next expansion phase.
Based on the visual data from the weekly chart, SUI's cyclicality is repeating with remarkable precision. During the previous two tight compression phases, the market logged explosive, vertical rallies lasting approximately 22 to 23 weeks. This recurring behavior has systematically established a large-scale macro ascending expansion triangle.
Currently, the price action is undergoing its third compression phase directly at the structural support floor. Should historical patterns repeat accurately, this range-bound compression will serve as the launchpad for a powerful bullish wave. The projected target for this cycle aims to propel SUI toward a new all-time high exceeding the $12 milestone by the end of the year. This represents an ideal window for patient investors to build long-term positions ahead of the breakout.
Disclaimer: This is not financial advice, DYOR.
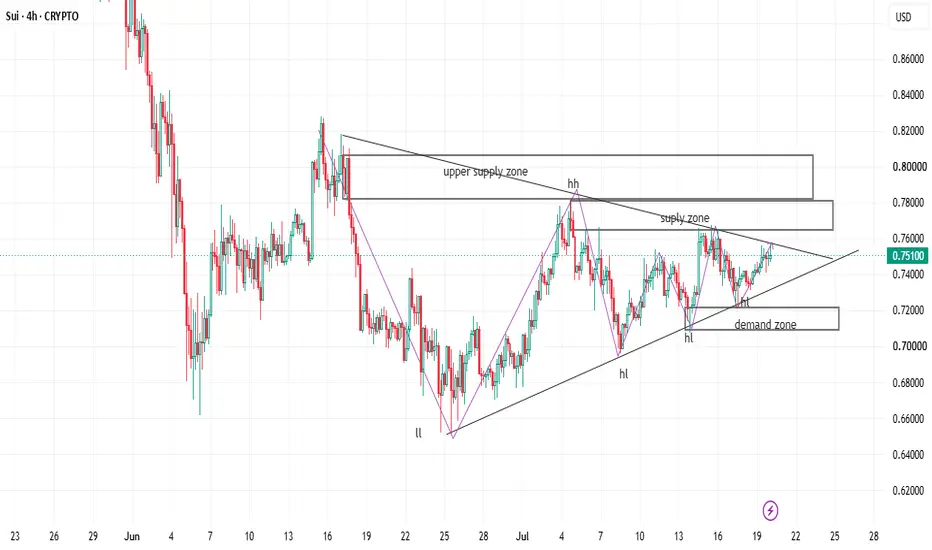
SYMMENTYRICAL TRIANGLE, A BIG CONSOLIDATION ON SUI/USDTThe symmetrical triangle which has formed on the price of sui is a consolidation phase that has been happening ever since the price reached the swing low , where the price never broke the low it kept correcting forming higher lows. Converging buyer and sellers forming a symmetrical triangle , which it's around and near the breakout , we are waiting for the breakout , an uptrend breakout signifies beginning of the bullish market , and a downtrend break out means continuation of the downtrend
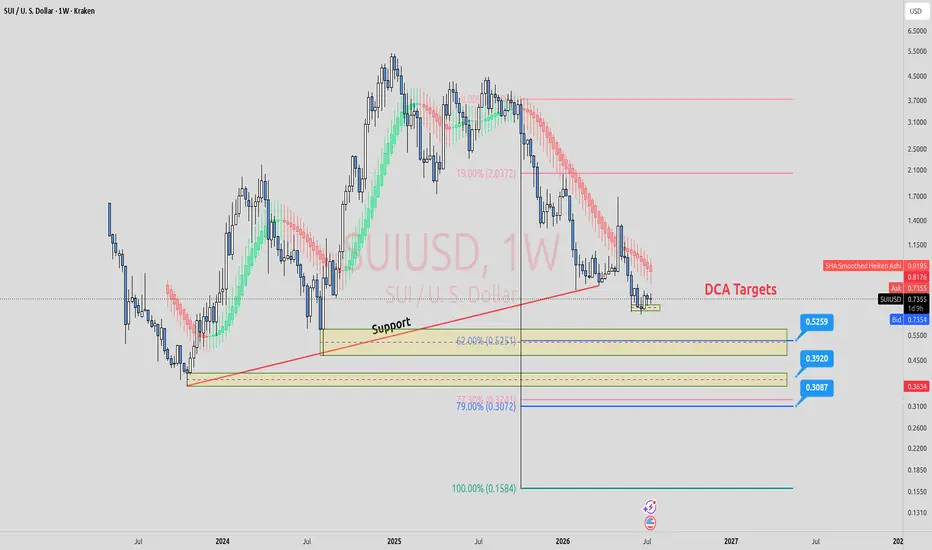
SUI | DCA |Is Still Too Expensive For Me.These are my planned DCA buy targets for SUI.
The first DCA zone has the highest probability of being reached and holding. The lower levels are simply additional targets if the market continues to move down.
For my Fibonacci levels, I used the large bearish impulse candle as the starting point, as I consider it the key move that changed the market structure.
I'm using the SHA (Smoothed Heikin Ashi) indicator because it helps me identify the trend and can also act as dynamic support and resistance.
The major support on the left side of the chart has already been broken, so for now I still consider SUI to be in a downtrend.
Personally, I don't expect August to be very supportive for altcoins, as buying activity is often weaker during this period.
These are simply my planned DCA accumulation levels if the price continues lower.
Good luck everyone! 🍀📈
SUI: Consolidation at Historical SupportSUI: Consolidation at Historical Support – Macro Pattern Breakout Opportunity Signals New Growth Cycle
SUI is displaying impressive structural resilience, opening up a highly promising technical setup on the macro timeframe. Observing the visual weekly data on chart , SUI's price structure has formed a well-defined broadening triangle pattern, characterized by sequentially higher highs and higher lows. Currently, the price action has corrected back to the solid support floor around the $0.74 mark—the exact launchpad that triggered two explosive historical rallies.
The encouraging news is that despite the relatively stagnant broader market conditions during this period, SUI demonstrates immense intrinsic strength with absolutely no signs of a deep sell-off. This persistent sideways consolidation behavior has maintained its ground for over a month right at this strategic baseline, proving that the bears' selling pressure is completely exhausted. Once the broader market synchronization turns positive, this compressed zone will serve as the perfect springboard for SUI to trigger a major breakout and complete its third macro upward wave.
Looking back at historical data, the previous two explosive cycles consistently required a duration of 22 to 23 weeks to reach their respective peaks. If history repeats itself in alignment with this technical cyclicality, SUI possesses a strong probability of establishing a fresh all-time high around early November 2026. This makes it an ideal window to place this asset on a high-priority watchlist.
Disclaimer: This is not financial advice, DYOR.
Sui and the optimistic unknownkeep in mind I don't keep with news on any projects anymore. so I don't know how many times Sui has been down this past year or how many tps It does. I saw Sui perform so well last cycle while I was sidelined. I would like the think most decent alts have at least two cycles in them. this could flop hard due to no interest. I place Sui along side hype in my high risk portfolio.
not financial advice and always dyor
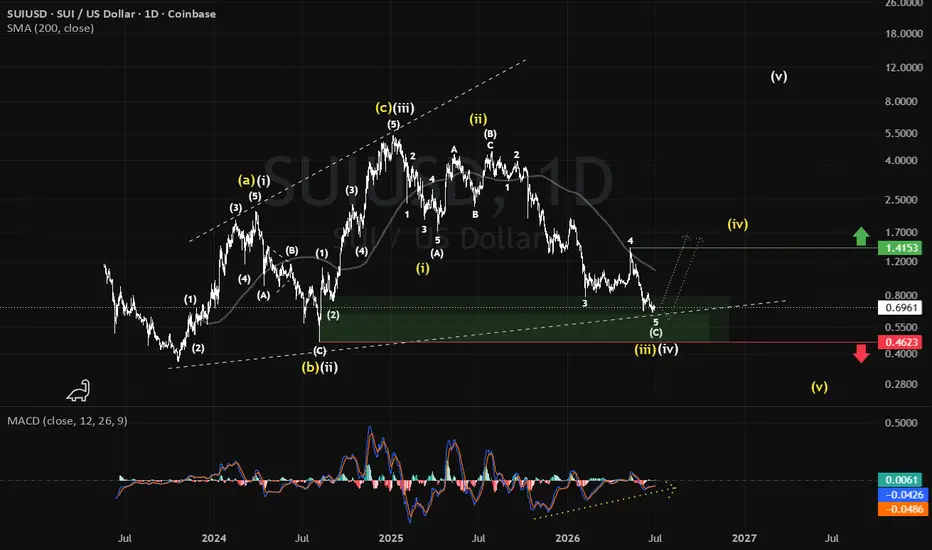
SUI: Large Caps Bullish Comeback#SUI
#Sui is a large-cap project. After its rally in late 2024, it entered a bearish downtrend. Now, with bullish divergences forming in a major demand zone, a trend reversal could occur.
Breaking $0.462 invalidates this idea, while passing $1.415 is a bullish confirmation.
SUI: Cyclical Price Compression Under the Round-Number BaselineSUI: Cyclical Price Compression Under the Round-Number Baseline – An Accumulation Playbook Ahead of the 2026 Progressive Breakout
SUI is carving out a highly textbook macro accumulation structure, unlocking a premium long-term trade setup based on the absolute symmetry of historical capital flows. Observing the daily visual chart, immediate price action is precisely mirroring the technical footprints of its previous explosive cycles. The core technical highlight is that price candles have operated overextended for a significant duration beneath the 100-period moving average (MA100) trendline, while active buying momentum remains tightly compressed below the 1 USD round-number threshold.
From a professional standpoint, this temporary short-term exhaustion is an essential baseline footprint for the bulls to capture underlying market liquidity. Looking back at market history, the first primary breakout wave in late 2023—ignited while the asset traded beneath the 1 USD floor—triggered a decisive expansion from 0.33 USD straight to 2.07 USD over a span of more than 160 days. Following that, the second cycle starting in August 2024 printed an identical roadmap where the price coiled deep underneath the dynamic MA100 ceiling before engineering a massive rally of nearly 900%, hitting 5.3 USD by year-end.
At this current juncture in 2026, as all technical data points realign, the global market layout is expanding into a macro ascending broadening wedge pattern. If this progressive cyclical repetition remains fully validated, the primary target objective for the next expansion leg is mathematically anchored toward the 12.6 USD milestone. The optimized playbook now is to proactively accumulate strategic long-term buy (Long) entries, while strictly enforcing disciplined stop-losses and monitoring the layout closely to guarantee optimal capital preservation.
this is not investment advice, DYOR
SUI Retesting a Multi-Year Rising TrendlineSUI is currently sitting on a major long-term ascending trendline that has supported every major correction since the beginning of its market cycle.
After a prolonged decline from the $5+ peak, price has compressed back into a critical support zone around $0.65–0.70, where buyers are attempting to defend the broader bullish structure.
This is a high-impact area because the next move will likely determine whether SUI begins a new accumulation phase or enters a deeper bear market.
Short-Term Outlook
As long as price remains above the rising trendline and the $0.65–0.70 support zone, bulls remain in control.
Targets: $1.00 → $1.30 → $1.70
Stop-loss: Below $0.60
Long-Term Outlook
The long-term structure remains constructive while the trendline support holds.
The correction from the cycle highs has already removed a large amount of excess speculation.
A successful defense of current support could become the foundation for the next major expansion phase.
Targets: $1.70 → $2.50 → $4.00
Extended Target: $5.00+
Stop-loss: Weekly close below $0.55
Summary
SUI is testing one of the most important support levels on its entire chart: the long-term ascending trendline near $0.70. If buyers continue defending this area, the token could begin a recovery toward $1.30–1.70 initially, with potential for a larger move toward $2.50–4.00 over the longer term.
However, a decisive breakdown below the trendline would invalidate the bullish structure and significantly increase the probability of a deeper decline toward the $0.40–0.50 region.
SUI: Approaching Historical Cycle BoundariesSUI: Approaching Historical Cycle Boundaries – A Patient Playbook Awaiting Macro Breakout Confirmations
SUI is carving out a highly unique structural setup on the weekly timeframe, presenting remarkable cyclical symmetry that allows us to prepare for a major long-term layout in 2026. Historical price action reveals that the asset previously engineered two massive macro growth waves with almost identical durations, ranging between 22 to 23 weeks for each expansion phase. This recurring trajectory has gradually formed an expanding triangle pattern characterized by a consistent sequence of higher highs and higher lows.
Observing the visual technical chart, the price candles have recently printed their third contact point along the pattern's lower boundary support baseline. Based on strict historical precedents, this underlying floor is expected to serve as the launchpad for a brand-new impulsive wave targeting higher technical peaks over the next 22 to 23 weeks.
However, from a professional analysis standpoint, the current market landscape has yet to flash any high-probability bullish reversal triggers to back the buyers. Buying momentum remains in a stagnant phase, and capital inflows are moving at a relatively sluggish pace. Therefore, the most intelligent and disciplined strategy right now is to avoid rushing into early buy (Long) positions. Patiently remain on the sidelines, waiting for broader market sentiment to improve or for SUI's trading volume to demonstrate positive expansion before triggering an entry.
this is not investment advice, DYOR
Liquidity Dreams and Reality Bites: Why the Banana Zone..was just a marketing ploy.
The Narrative vs. The Chart:
We’ve been sold a story.
For years, the "Banana Zone" has been peddled as an inevitable, macro-driven surge fuelled by global M2 liquidity.
It’s a compelling story—it’s easy to understand, it justifies high-risk allocation, and it keeps capital locked in the ecosystem during the long, painful sideways grinds.
The Savage Reality:The charts tell a different story.
While the "macro-bros" are waiting for the fuelled parabolic move to save their bags, the actual price action in high-beta assets like SUI shows something else entirely: Distribution.
The 3 Pillars of the "Banana Zone"
Myth:Liquidity does not = $ Price:
Liquidity is a necessary condition for speculative growth, but it is not a sufficient one.
Relying on M2 alone ignores structural failures in adoption, developer flight, and the massive overhang of unlocked supply waiting to hit the market.
Branding as Alpha: Framing a cycle as a "Banana Zone" is brilliant marketing.
It creates a psychological trap that keeps you holding through a 50% drawdown because you’re waiting for a vertical line that may never come.
The Macro-God Complex: When you try to boil the entire global economy down to a single "Everything Code," you lose the ability to see the technical reality right in front of you.
My Take: Look at the chart.
We aren't in a "pre-parabolic accumulation phase." We are seeing technical exhaustion.
I’m trading the price action, not the macro-fable.
If the "Banana Zone" were real, we wouldn't need to be sold on it by influencers every single week.
The Lesson:Don't let a catchy name keep you from seeing a structural top.
If the macro thesis doesn't manifest as technical strength, the thesis is just a story.
And stories don't pay the bills.
#BananaZone #RaoulPal #MacroThesis #SUI #CryptoReality #TradingView #MarketMechanics
Short Term & Long Term Bullish Trend Reversal AnalysisI have labeled the chart (for a more in depth breakdown) for short term and long term bullish trend reversal analysis. It includes:
Strong Bullish Reversal on 5m-4hr Time Frame (Confirmed)
CRT Bullish Reversal on Weekly Time Frame (Confirmed)
Rising 3 Methods (potentially) Bullish Reversal on Weekly Time Frame (TBD)
**Not Labeled-The Stochastic RSI is oversold on most of the higher time frames.**
Anything can happen and this is not financial advice. Just my view on a beat down token.
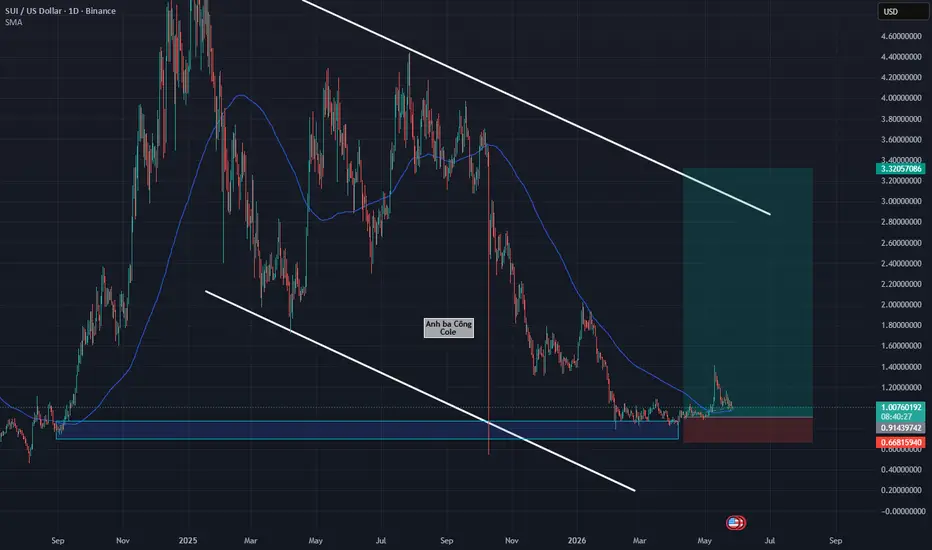
SUI: Strategic Retracement at Psychological LevelsSUI confirms a potential recovery signal after completing a technical correction to the "steel" support zone of $1 and the MA100 line. Given its previous 55% growth foundation, the current structure favors the bulls within this value area. The priority strategy is to establish a Long position at the current support, with a tight stop-loss below the MA100 to optimize the RR ratio and anticipate the next growth leg in 2026.
this is not investment advice, DYOR