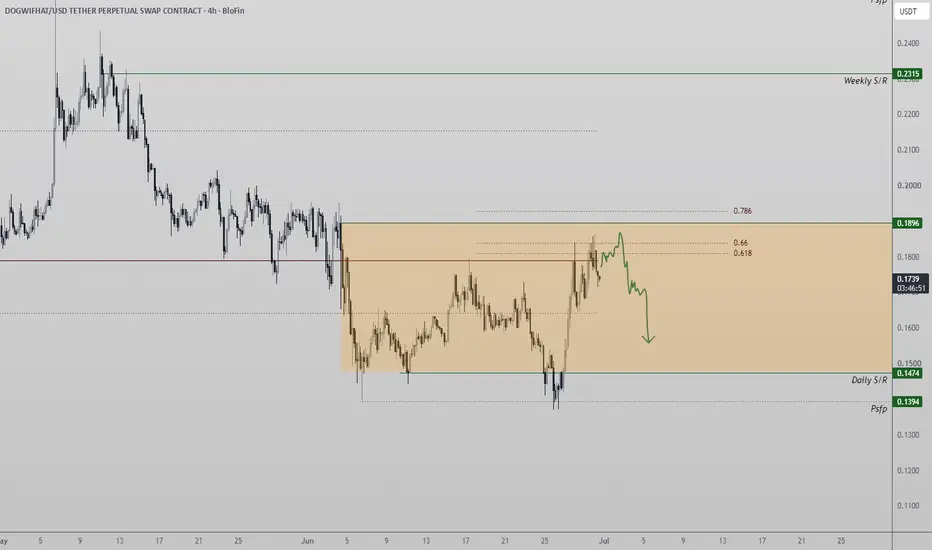
WIF: liquidity sweep before the next leg downThe Macro Picture 🗺️
WIF has been locked in a descending structure since the May $0.24 structural peak, grinding out lower highs and lower lows on the daily. The June flush to $0.14 set the macro floor, and while the bounce to $0.185 offered hope, it was sold aggressively — a textbook lower high in
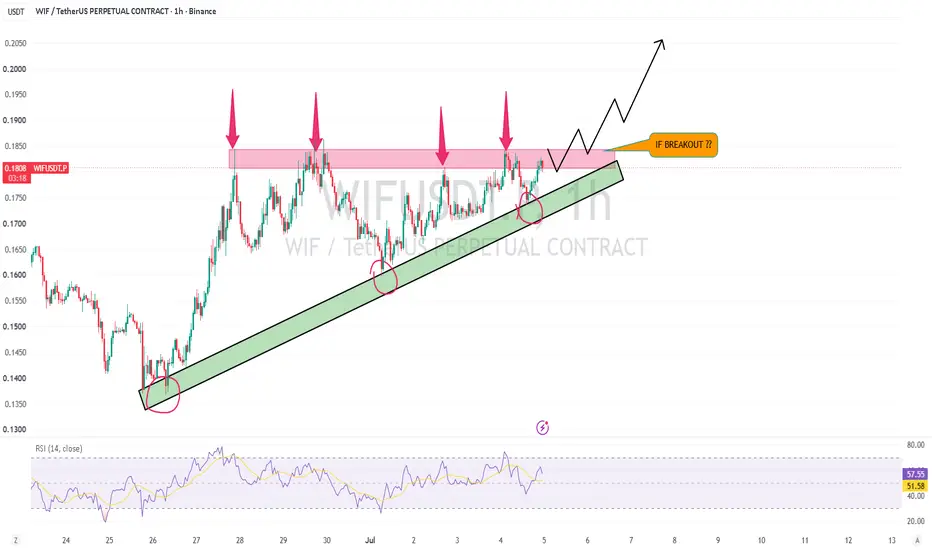
$WIF Is Trapped... But One Move Could Change Everything CRYPTOCAP:WIF Is Trapped... But One Move Could Change Everything 👀
Most traders are only watching the price.i'm watching the structure.
WIF has been respecting a rising trendline while repeatedly getting rejected from the same resistance zone. Every rally has stalled here, which tells us sellers a
short Roddy01-SIGNALSPROVIDERInstructions:
Entry point: yellow
Stop loss: red
Take profit: green
👉Leverage x 5-10-20 for crypto
👉Leverage x 20-50-100 for commodities, stocks, indices, and forex
👉Margin 1-5% max.
Always practice risk and money management.
Invest a maximum of 5% on any trade or across all your trades.
Invest on
WIFUSDT - Descending Trendline, Breakout or Rejection?The WIF/USDT chart on the 2-Day (2D) timeframe remains in a well-defined downtrend structure. This is confirmed by a Descending Trendline connecting a series of Lower Highs from the market peak until now.
🔥 Interestingly, price has once again approached this Descending Trendline after spending seve
WIF Breaks Channel Resistance, Eyes Higher LevelsWIF has successfully broken above its long-standing falling wedge, signaling a notable shift in short-term market structure. After reclaiming the former resistance as support, buyers have maintained control and are now attempting to build momentum above the breakout zone.
Price is currently holding
WIF Price Rejected at Key ResistanceDogwifhat (WIF) is currently trading beneath a major resistance confluence, with price rejecting from both the 0.618 Fibonacci retracement and a significant daily resistance level. This area represents an important decision point for the market, as it has historically attracted strong selling pressu
WIFUSDT Forming Falling WedgeWIFUSDT is forming a clear falling wedge pattern, a classic bullish wave signal that often indicates an upcoming breakout. The price has been consolidating within a narrowing range, suggesting that selling pressure is weakening while buyers are beginning to regain control. With consistent volume con
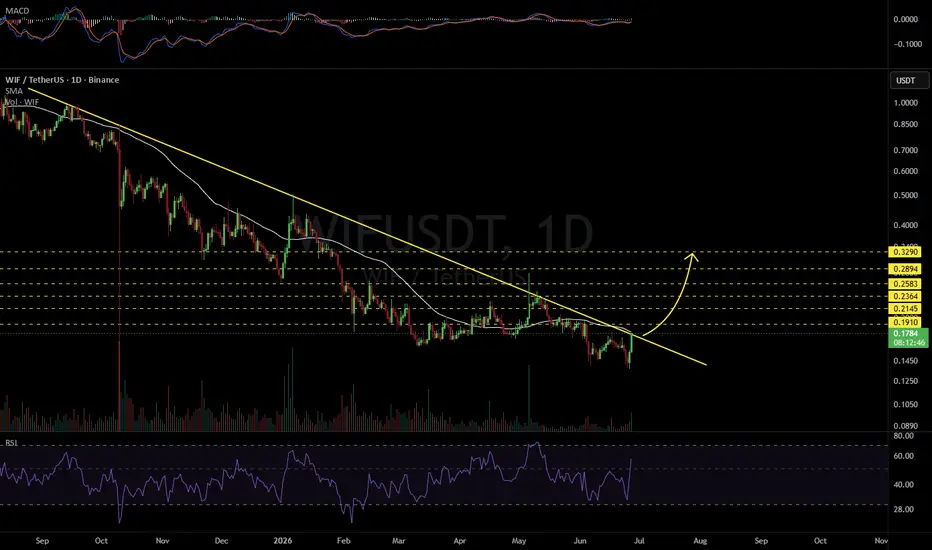
WIFUSDT 1D#WIF is on the verge of breaking out above the descending resistance and the daily SMA50. In case of a confirmed breakout, the potential upside targets are:
🎯 $0.1910
🎯 $0.2145
🎯 $0.2364
🎯 $0.2583
🎯 $0.2894
🎯 $0.3290
⚠️ Always remember to use a tight stop-loss and maintain proper risk management.
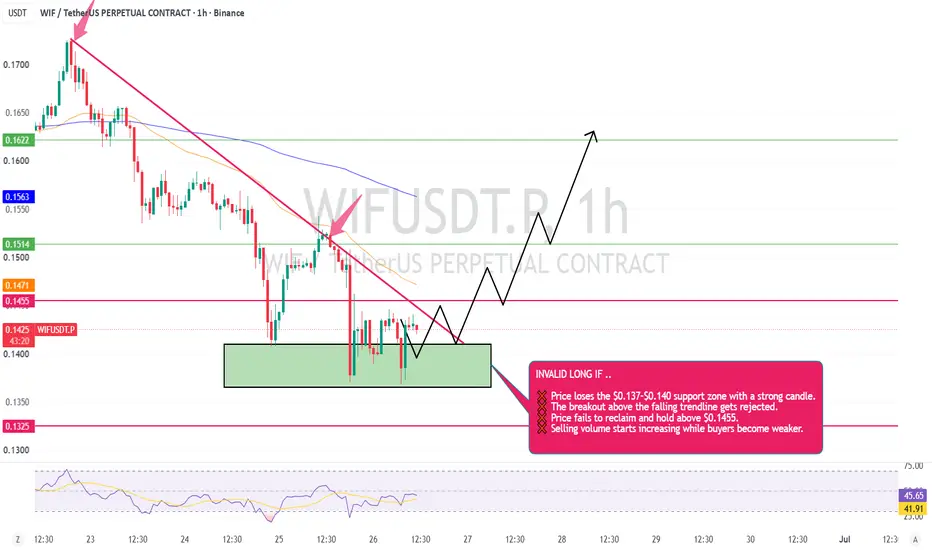
WIFUSD Bulls Are Defending This Level Or Breake ??
CRYPTOCAP:WIF is still holding the demand zone around $0.137–$0.140, and sellers haven't been able to push it lower. That's a good sign for now.
If buyers can keep the momentum and break above the falling trendline, we could see WIF slowly move toward the next resistance levels. The main thing
WIF At Support, Bounce Likely ?Dogwifhat (WIF) is currently trading at a highly significant technical level where multiple forms of support are converging. Price action has retraced into a key zone that combines the 0.618 Fibonacci retracement with an important daily support level, creating a strong area of technical confluence.
See all ideas
Summarizing what the indicators are suggesting.
Oscillators
Neutral
SellBuy
Strong sellStrong buy
Strong sellSellNeutralBuyStrong buy
Oscillators
Neutral
SellBuy
Strong sellStrong buy
Strong sellSellNeutralBuyStrong buy
Summary
Neutral
SellBuy
Strong sellStrong buy
Strong sellSellNeutralBuyStrong buy
Summary
Neutral
SellBuy
Strong sellStrong buy
Strong sellSellNeutralBuyStrong buy
Summary
Neutral
SellBuy
Strong sellStrong buy
Strong sellSellNeutralBuyStrong buy
Moving Averages
Neutral
SellBuy
Strong sellStrong buy
Strong sellSellNeutralBuyStrong buy
Moving Averages
Neutral
SellBuy
Strong sellStrong buy
Strong sellSellNeutralBuyStrong buy
Displays a symbol's price movements over previous years to identify recurring trends.