WIF: liquidity sweep before the next leg downThe Macro Picture 🗺️
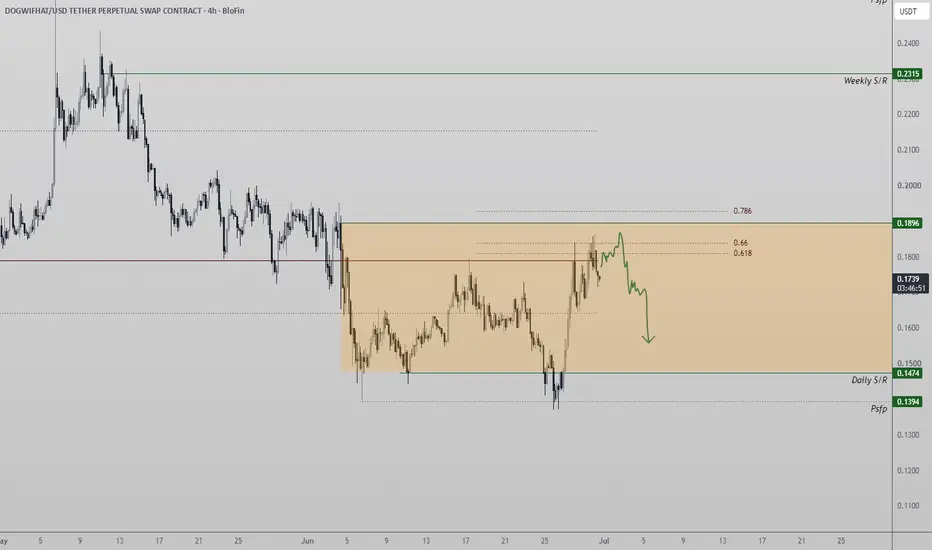
WIF has been locked in a descending structure since the May $0.24 structural peak, grinding out lower highs and lower lows on the daily. The June flush to $0.14 set the macro floor, and while the bounce to $0.185 offered hope, it was sold aggressively — a textbook lower high inside the broader downtrend. Price now sits at $0.16, rolling back over with RSI fading from 60 toward the midline. This is a market where every rally becomes supply, and the path of least resistance still points down toward the range lows that desperately need a retest.
The Setup ⚙️
The Ceiling: The $0.185 shelf is the decision line. This former support flipped into resistance, and the bears defended it on the last approach — as marked by the red projection, the rejection was immediate.
The Rejection: Above sits the $0.185–$0.20 supply block. Price would need to reclaim this entire band to neutralize the bearish structure, and momentum offers no support for that case yet.
The Trigger: A liquidity sweep below $0.15 would clear out over-leveraged longs stacked at the local support and open the path toward the $0.14 macro floor.
The Roadmap: Primary target sits at $0.14 — the green roadmap points there as the natural draw on liquidity below the range. Invalidation: a sustained 4H close back above $0.185 would invalidate this bearish thesis and signal a structural reset in favor of the bulls.
More setups in profile.
#WIF #CRYPTO #dogwifhat #Memecoins #TechnicalAnalysis
In-depth trading ideas
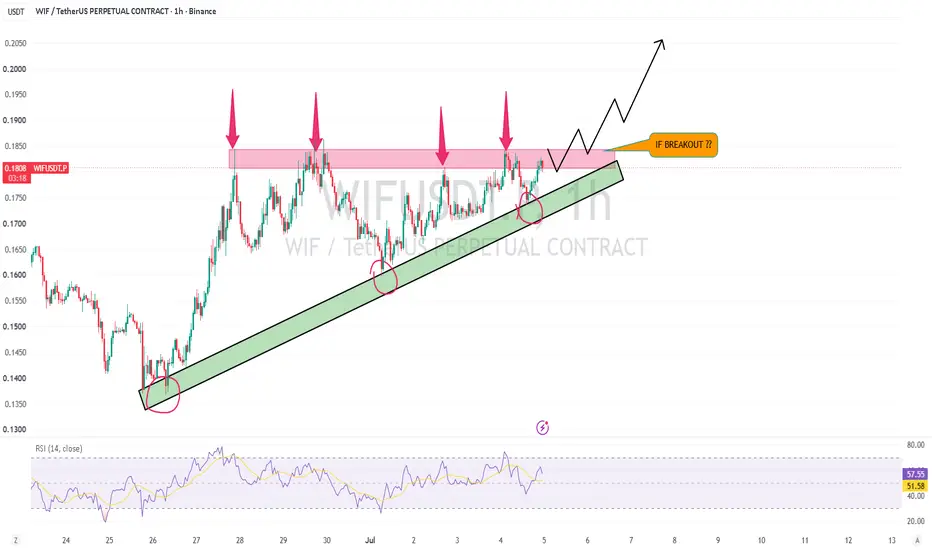
$WIF Is Trapped... But One Move Could Change Everything CRYPTOCAP:WIF Is Trapped... But One Move Could Change Everything 👀
Most traders are only watching the price.i'm watching the structure.
WIF has been respecting a rising trendline while repeatedly getting rejected from the same resistance zone. Every rally has stalled here, which tells us sellers are still defending this level.
Now price is getting squeezed between support and resistance.
A breakout above this resistance with strong volume could trigger a fresh bullish move and open the door for higher prices. But if this ascending trendline breaks instead, the current bullish structure weakens and a deeper pullback becomes much more likely.
❌ What Would Invalidate the Bullish Setup?
• Price breaks and closes below the ascending trendline with strong bearish momentum.
• Resistance rejects price again and creates another clear lower high.
• Sellers reclaim the breakout level after a fake breakout (bull trap).
• Volume increases on the downside, showing sellers are taking control.
short Roddy01-SIGNALSPROVIDERInstructions:
Entry point: yellow
Stop loss: red
Take profit: green
👉Leverage x 5-10-20 for crypto
👉Leverage x 20-50-100 for commodities, stocks, indices, and forex
👉Margin 1-5% max.
Always practice risk and money management.
Invest a maximum of 5% on any trade or across all your trades.
Invest only what you can afford to lose, as no one is in control of the market.
👉Our analyses are primarily based on:
breakouts: two trend lines (ascending and descending) and a line indicating a horizontal breakout.
chart patterns: shoulders and head, triangle parttern, elliott impulse, etc etc.
We don't always have the time to track them at all times or to represent them visibly, given the numerous signals, the number of channels to manage, and especially because of the often rapid pace of market movements.
indicators: We associate at least two indicators with this technique.
👉Depending on the circumstances, we use specific indicators, often setting 3 or more take profit levels.
👉Indeed, there are good days in trading and also bad days. No one can promise to win every trade, and like all traders worldwide, we also experience stop-loss orders. However, we win more than we lose and remain positive.
👉You can close the position before or after the take profit orders indicated by the green lines if you are personally satisfied; the same applies to stop loss orders.
👉We must stay positive, clear-headed, and humble.
we cannot provide all instructions or all trades here on this channel.
Good luck to us all, and may God guide us. Amen.
WIFUSDT - Descending Trendline, Breakout or Rejection?The WIF/USDT chart on the 2-Day (2D) timeframe remains in a well-defined downtrend structure. This is confirmed by a Descending Trendline connecting a series of Lower Highs from the market peak until now.
🔥 Interestingly, price has once again approached this Descending Trendline after spending several months consolidating near the lows. This makes the current price action extremely important, as it could determine the next major market direction.
---
📐 Technical Structure
📉 1. Descending Trendline (Dynamic Resistance)
🔸 The yellow trendline acts as the primary Dynamic Resistance.
🔸 As long as price remains below this trendline, the overall Bearish Market Structure remains valid.
🔸 A valid breakout requires a candle close above the trendline, ideally supported by a noticeable increase in trading volume.
---
📦 2. Base Formation / Accumulation Zone
Over the past several months, price has been moving sideways after experiencing a prolonged decline.
This suggests that:
✅ Selling pressure is gradually weakening.
✅ Sellers are beginning to lose momentum.
✅ Buyers are defending the support area.
This type of consolidation often serves as the foundation for a potential trend reversal, provided the major resistance is successfully broken.
---
🎯 3. Key Resistance Levels
The major resistance levels to monitor are:
🟡 0.1940
🟡 0.2320
🟡 0.2690
🟡 0.3300
🟡 0.4100
These levels may act as both price targets and profit-taking zones if a confirmed breakout occurs.
---
📚 Pattern Overview
🔻 Descending Triangle / Descending Trend Structure
Pattern Characteristics:
✅ Consecutive Lower Highs.
✅ A downward-sloping resistance trendline.
✅ Price consolidating near a key support area.
From a technical perspective, this pattern is generally considered a Bearish Continuation Pattern. However, if price breaks above the trendline with strong buying volume, it may evolve into a Bullish Reversal Pattern.
---
🚀 Bullish Scenario 📈
The bullish case becomes increasingly valid if:
✅ A candle successfully closes above the Descending Trendline.
✅ The breakout is confirmed by increasing trading volume.
✅ Price performs a successful retest, turning the previous resistance into new support.
🎯 Bullish Targets:
🥇 TP1: 0.1940
🥈 TP2: 0.2320
🥉 TP3: 0.2690
🏅 TP4: 0.3300
👑 TP5: 0.4100
If all major resistance levels are reclaimed, the current medium-term downtrend could transition into a new uptrend.
---
🔻 Bearish Scenario 📉
The bearish outlook remains dominant if:
❌ Price gets rejected at the Descending Trendline.
❌ A strong bearish rejection candle forms near resistance.
❌ Buying volume weakens significantly.
If the lower support zone breaks, price could continue making new Lower Lows, confirming that the bearish trend remains intact.
---
✅ Key Confirmation Signals
✔️ A breakout should be accompanied by high trading volume.
✔️ Avoid FOMO before the 2-Day candle closes convincingly above the Descending Trendline.
✔️ A successful retest generally offers a lower-risk entry compared to chasing the initial breakout.
---
📌 Conclusion
WIF is currently trading at a critical technical level.
📉 The Descending Trendline has acted as a major resistance for several months, making the current price reaction highly significant.
🟢 If the Breakout Succeeds:
➡️ Supported by strong trading volume.
➡️ Opens the possibility of a Bullish Reversal, with upside targets at:
🎯 0.1940 → 0.2320 → 0.2690 → 0.3300 → 0.4100
🔴 If Rejection Occurs:
➡️ The Bearish Market Structure remains intact.
➡️ Price could continue its downtrend and establish new Lower Lows.
💡 Until a confirmed breakout occurs, the more disciplined approach is to wait for confirmation rather than entering based on anticipation alone.
> ⚠️ Disclaimer: This analysis is provided for educational and informational purposes only and should not be considered financial advice or a recommendation to buy or sell any asset. Always conduct your own research (DYOR) and apply proper risk management before making any trading decisions.
#WIF #Dogwifhat #WIFUSDT #Crypto #Cryptocurrency #Altcoins #TechnicalAnalysis #TradingView #PriceAction #DescendingTrendline #Breakout #Trendline #SupportResistance #Bullish #Bearish #SwingTrading #CryptoTrading #ChartAnalysis #MarketStructure #RiskManagement #DYOR #CryptoAnalysis #AltcoinSeason #VolumeAnalysis #TrendReversal
WIF Breaks Channel Resistance, Eyes Higher LevelsWIF has successfully broken above its long-standing falling wedge, signaling a notable shift in short-term market structure. After reclaiming the former resistance as support, buyers have maintained control and are now attempting to build momentum above the breakout zone.
Price is currently holding above the key Fibonacci retracement levels, with 0.1844 acting as the next major hurdle. A decisive move above this resistance could accelerate bullish momentum toward 0.1955 and potentially higher. However, losing the breakout zone would increase the probability of a retest toward 0.1598.
Key Levels
🟢 Support: 0.1598 → 0.1370
🔴 Resistance: 0.1844 → 0.1955
📈 Bias: Bullish while price holds above the former wedge resistance.
⚠️ A confirmed break above 0.1844 would strengthen the case for further upside.
WIF Price Rejected at Key ResistanceDogwifhat (WIF) is currently trading beneath a major resistance confluence, with price rejecting from both the 0.618 Fibonacci retracement and a significant daily resistance level. This area represents an important decision point for the market, as it has historically attracted strong selling pressure.
The recent rally appears to be a corrective bounce from oversold conditions rather than the start of a new bullish trend. While buyers managed to recover price from support, they have so far been unable to reclaim higher-timeframe resistance. As long as WIF remains below this resistance cluster, the probability favors another corrective move toward the lower support region, continuing the broader trading range.
For bulls to regain control, price needs to break and close above the 0.618 Fibonacci level and daily resistance with strong momentum. A successful reclaim would shift the market structure back in favor of buyers and increase the likelihood of a larger continuation to the upside.
Until that happens, traders should remain cautious of chasing the recent rally. The current technical structure continues to favor range-bound price action, with resistance holding firm and lower support remaining the next key area to watch if sellers maintain control.
WIFUSDT Forming Falling WedgeWIFUSDT is forming a clear falling wedge pattern, a classic bullish wave signal that often indicates an upcoming breakout. The price has been consolidating within a narrowing range, suggesting that selling pressure is weakening while buyers are beginning to regain control. With consistent volume confirming accumulation at lower levels, the setup hints at a potential bullish breakout soon. The projected move could lead to an impressive gain of around 70% to 80% once the price breaks above the wedge resistance.
This falling wedge pattern is typically seen at the end of downtrends or corrective phases, and it represents a potential shift in market sentiment from bearish to bullish. Traders closely watching WIFUSDT are noting the strengthening momentum as it nears a breakout zone. Strong trading volume adds confidence to this pattern, showing that market participants are positioning early in anticipation of a reversal.
Investors’ growing interest in WIFUSDT reflects rising confidence in the project's long-term fundamentals and current technical strength. If the breakout confirms with sustained volume, this could mark the start of a fresh bullish leg. The current market structure suggests that buyers are gradually taking control while bearish momentum continues to weaken.
Traders might find this a valuable setup for medium-term gains, especially as the falling wedge pattern nears completion and buying momentum accelerates. A confirmed breakout could attract additional buying pressure and potentially push the price toward significantly higher levels in the coming weeks.
✅ Show your support by hitting the like button!
✅ Leave a comment below! (What is your opinion about this coin?)
Your feedback and engagement keep me inspired to share more insightful market analysis with you!
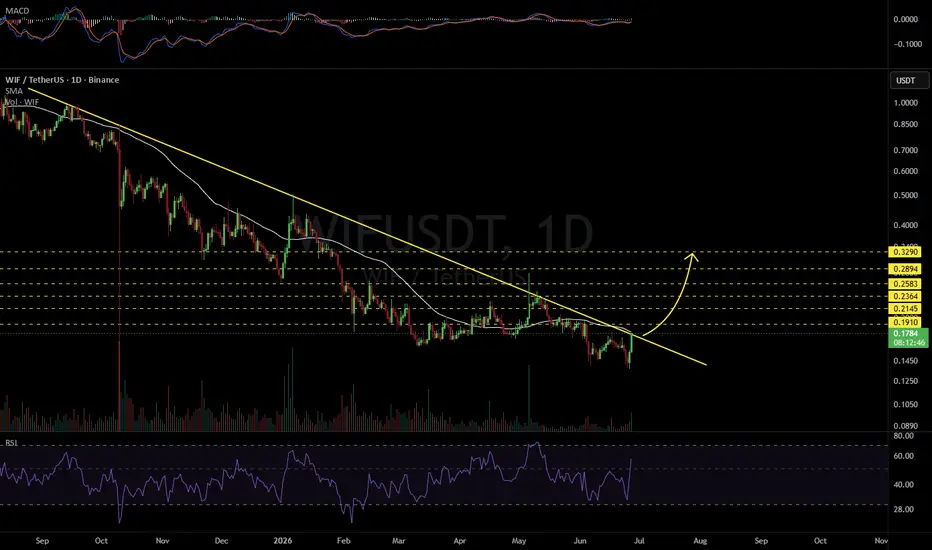
WIFUSDT 1D#WIF is on the verge of breaking out above the descending resistance and the daily SMA50. In case of a confirmed breakout, the potential upside targets are:
🎯 $0.1910
🎯 $0.2145
🎯 $0.2364
🎯 $0.2583
🎯 $0.2894
🎯 $0.3290
⚠️ Always remember to use a tight stop-loss and maintain proper risk management.
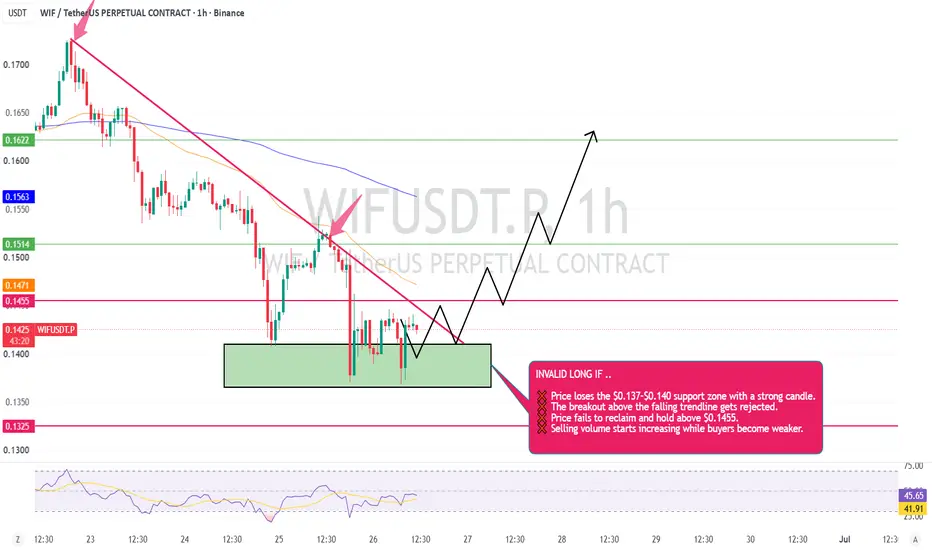
WIFUSD Bulls Are Defending This Level Or Breake ??
CRYPTOCAP:WIF is still holding the demand zone around $0.137–$0.140, and sellers haven't been able to push it lower. That's a good sign for now.
If buyers can keep the momentum and break above the falling trendline, we could see WIF slowly move toward the next resistance levels. The main thing I'm watching is whether price can reclaim $0.1455 and stay above it. That would make the chart look much healthier.
I'm not rushing into a trade yet. I'd rather wait for confirmation than chase the price. Sometimes patience gives the better entry.As always, this is just my view of the chart, not financial advice. Stay safe and manage your risk.
#WIF #Crypto #Binance #Trading
WIF At Support, Bounce Likely ?Dogwifhat (WIF) is currently trading at a highly significant technical level where multiple forms of support are converging. Price action has retraced into a key zone that combines the 0.618 Fibonacci retracement with an important daily support level, creating a strong area of technical confluence. These types of zones often attract buyers and can serve as the foundation for the next directional move.
The current setup places WIF in what many traders would consider a prime trade location. Rather than chasing price at higher levels, the market is now testing an area where risk-to-reward dynamics become more attractive for bulls. As long as price continues to hold above the current support region, the probability favors a rotational bounce toward higher resistance levels.
From a market structure perspective, the recent pullback appears corrective rather than trend-changing. Corrections into major Fibonacci levels are common during broader uptrends and often provide opportunities for the market to establish a higher low before continuation occurs. The reaction from this support zone will therefore be critical in determining whether buyers remain in control.
If support holds and buying pressure begins to increase, WIF could initiate a recovery phase that targets the next significant resistance levels overhead. For now, all attention remains on the current support region. The combination of daily support and Fibonacci confluence makes this a key area where price has a strong probability of producing a bounce and expanding higher in the sessions ahead.
WIFUSDT - Bear Flag, Breakdown or Reclaim?On the WIF/USDT 8-hour chart, price is currently trading within a 🚩 Bear Flag Pattern, a bearish continuation structure that formed after a sharp decline (📉 flagpole), followed by an upward consolidation phase inside an ascending channel 📈.
At the moment, price remains inside the rising channel but is starting to lose momentum after failing to sustain above a key resistance area ⚠️. This structure suggests that the market is approaching a critical decision point between continuing the downtrend or invalidating the bearish setup.
---
🚩🐻 Main Pattern: Bear Flag
📌 Bear Flag Characteristics Observed:
✅ Formed after an aggressive price decline.
✅ An ascending channel developed as a retracement phase 📈.
✅ Volume and momentum tend to weaken during flag formation 📊.
✅ The lower channel support acts as the key level for the next directional move 🎯.
From a technical perspective, a Bear Flag is a continuation pattern that generally carries a higher probability of extending the existing downtrend once support is broken 🔻.
---
🎯 Key Levels to Watch
🟨 Major Resistance
🔸 Supply Zone: 0.1760 – 0.1800 USDT
🔸 Upper Channel Resistance: 0.1900 – 0.1980 USDT
This zone must be reclaimed by buyers 💪 to invalidate the Bear Flag structure.
🟩 Important Support
🔹 Dynamic Channel Support: 0.1600 – 0.1620 USDT
🔹 Horizontal Support: 0.1557 USDT
🔹 Next Support: 0.1472 USDT
🔹 Critical Support: 0.1400 USDT
---
🚀🐂 Bullish Scenario
A bullish confirmation would require:
✅ Price holding above the channel support.
✅ A breakout above the 0.1760 – 0.1800 USDT supply zone.
✅ An 8H candle closing above the channel resistance 📈.
If the breakout occurs with strong volume 🔥, potential upside targets are:
🎯 Target 1: 0.1900 USDT
🎯 Target 2: 0.2000 USDT
🎯 Target 3: 0.2420 USDT (Previous Swing High)
🚀 Such a breakout would invalidate the Bear Flag structure and open the door for a larger bullish reversal.
---
📉🐻 Bearish Scenario
The primary outlook remains bearish as long as price stays below the supply zone.
Bearish confirmation occurs if:
❌ Price breaks below the ascending channel support.
❌ An 8H candle closes below 0.1600 USDT.
❌ Selling volume increases during the breakdown 📊🔻.
Potential downside targets:
🎯 Target 1: 0.1557 USDT
🎯 Target 2: 0.1472 USDT
🎯 Target 3: 0.1400 USDT
⚠️ If the 0.1400 USDT support fails to hold, the decline could extend further based on the measured move projection of the Bear Flag's flagpole 📉.
---
🔍📋 Conclusion
WIF is currently trading within a 🚩 Bear Flag structure that has not yet confirmed either a bullish or bearish breakout. As long as price remains below the 0.1760 – 0.1800 USDT resistance zone, sellers continue to dominate and the risk of a bearish breakdown remains elevated ⚠️.
👀 Traders should closely monitor the 0.1600 USDT support area. A breakdown below this level could trigger a move toward 0.1557 – 0.1472 – 0.1400 USDT.
On the other hand, a breakout above the supply zone would be the first sign that buyers are regaining control of the market 💪🚀.
#WIF #WIFUSDT #DOGWIFHAT #Crypto 🚀 #Cryptocurrency #Trading 📊 #TradingView #TechnicalAnalysis #PriceAction #ChartAnalysis #BearFlag 🚩 #BearishPattern 🐻 #Altcoins #CryptoTrading #SupportAndResistance #MarketStructure #Breakdown
Wifusdt longInstructions:
Entry point: yellow
Stop loss: red
Take profit: green
👉Leverage x 5-10-20 for crypto
👉Leverage x 20-50-100 for commodities, stocks, indices, and forex
👉Margin 1-5% max.
Always practice risk and money management.
Invest a maximum of 5% on any trade or across all your trades.
Invest only what you can afford to lose, as no one is in control of the market.
👉Our analyses are primarily based on:
breakouts: two trend lines (ascending and descending) and a line indicating a horizontal breakout.
chart patterns: shoulders and head, triangle parttern, elliott impulse, etc etc.
We don't always have the time to track them at all times or to represent them visibly, given the numerous signals, the number of channels to manage, and especially because of the often rapid pace of market movements.
indicators: We associate at least two indicators with this technique.
👉Depending on the circumstances, we use specific indicators, often setting 3 or more take profit levels.
👉Indeed, there are good days in trading and also bad days. No one can promise to win every trade, and like all traders worldwide, we also experience stop-loss orders. However, we win more than we lose and remain positive.
👉You can close the position before or after the take profit orders indicated by the green lines if you are personally satisfied; the same applies to stop loss orders.
👉We must stay positive, clear-headed, and humble.
we cannot provide all instructions or all trades here on this channel.
Good luck to us all, and may God guide us. Amen.
WIF Setting Up for a Potential BottomWIF continues to follow a clear descending structure, printing consistent lower highs from, showing that sellers remain in control. Price is currently sitting near the 0.13 immediate support zone, and a breakdown below this level could push WIF toward the 0.065 projected drop target, which aligns with the next major liquidity area.
If price reaches this region, it could trigger a strong relief bounce, with potential upside back toward the 0.32–0.40 resistance zone and possibly higher if momentum returns. Until then, the market structure remains bearish and reclaiming 0.32plus would be the first sign of a meaningful trend shift. Patience may be key here, as a deeper flush toward 0.065 could provide a stronger risk to reward opportunity.
wifusdt longInstructions:
Entry point: yellow
Stop loss: red
Take profit: green
👉Leverage x 5-10-20 for crypto
👉Leverage x 20-50-100 for commodities, stocks, indices, and forex
👉Margin 1-5% max.
Always practice risk and money management.
Invest a maximum of 5% on any trade or across all your trades.
Invest only what you can afford to lose, as no one is in control of the market.
👉Our analyses are primarily based on:
breakouts: two trend lines (ascending and descending) and a line indicating a horizontal breakout.
chart patterns: shoulders and head, triangle parttern, elliott impulse, etc etc.
We don't always have the time to track them at all times or to represent them visibly, given the numerous signals, the number of channels to manage, and especially because of the often rapid pace of market movements.
indicators: We associate at least two indicators with this technique.
👉Depending on the circumstances, we use specific indicators, often setting 3 or more take profit levels.
👉Indeed, there are good days in trading and also bad days. No one can promise to win every trade, and like all traders worldwide, we also experience stop-loss orders. However, we win more than we lose and remain positive.
👉You can close the position before or after the take profit orders indicated by the green lines if you are personally satisfied; the same applies to stop loss orders.
👉We must stay positive, clear-headed, and humble.
we cannot provide all instructions or all trades here on this channel.
Good luck to us all, and may God guide us. Amen.
WIF ACCUMULATION OVER | NOW BREAKING OUT🔥 Fortune AI Radar — CRYPTOCAP:WIF
Fresh activity detected on CRYPTOCAP:WIF today.
Data suggests increasing market interest & buyers stepping in.
Technicals currently lean bullish, with momentum trending upward.
Whales showing hints of accumulation and hype rising among trader
wifusdt shortInstructions:
Entry point: yellow
Stop loss: red
Take profit: green
👉Leverage x 5-10-20 for crypto
👉Leverage x 20-50-100 for commodities, stocks, indices, and forex
👉Margin 1-5% max.
Always practice risk and money management.
Invest a maximum of 5% on any trade or across all your trades.
Invest only what you can afford to lose, as no one is in control of the market.
👉Our analyses are primarily based on:
breakouts: two trend lines (ascending and descending) and a line indicating a horizontal breakout.
chart patterns: shoulders and head, triangle parttern, elliott impulse, etc etc.
We don't always have the time to track them at all times or to represent them visibly, given the numerous signals, the number of channels to manage, and especially because of the often rapid pace of market movements.
indicators: We associate at least two indicators with this technique.
👉Depending on the circumstances, we use specific indicators, often setting 3 or more take profit levels.
👉Indeed, there are good days in trading and also bad days. No one can promise to win every trade, and like all traders worldwide, we also experience stop-loss orders. However, we win more than we lose and remain positive.
👉You can close the position before or after the take profit orders indicated by the green lines if you are personally satisfied; the same applies to stop loss orders.
👉We must stay positive, clear-headed, and humble.
we cannot provide all instructions or all trades here on this channel.
Good luck to us all, and may God guide us. Amen.
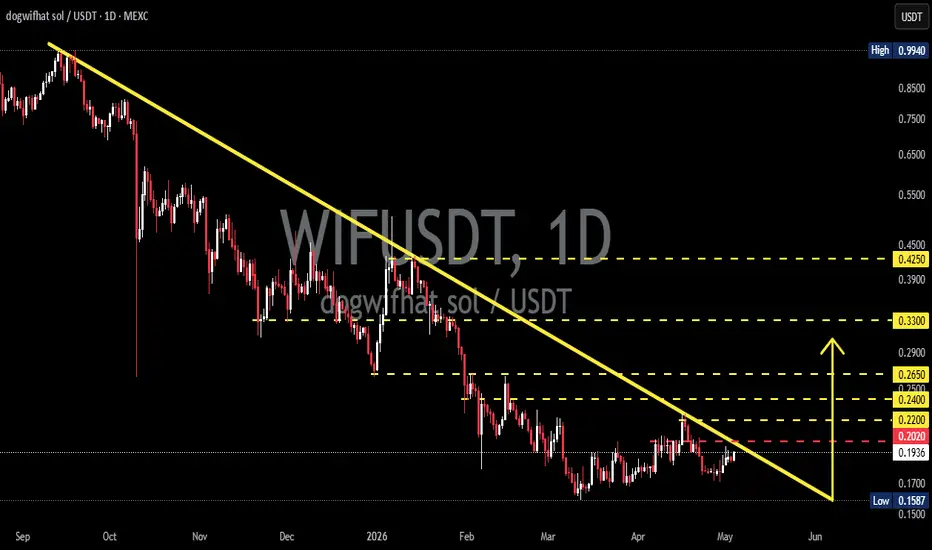
WIF/USDT 1D – Rebound or Further Drop?On the 1D timeframe, WIF/USDT remains in a strong downtrend after forming a top around ~0.99. Price continues to create lower highs and lower lows, indicating strong seller dominance.
Key observations:
A clear descending trendline (dynamic resistance) consistently pushing price down
Multiple horizontal support zones being repeatedly tested
Price starting to move sideways at the bottom → potential accumulation or just consolidation before another drop
---
📊 Pattern Formation
Descending Triangle / Falling Structure
Price is moving under a descending resistance
Support is tested multiple times → weakening
This is typically a bearish continuation pattern, unless a breakout occurs
Additionally:
Base Formation (Potential Accumulation)
Area around 0.15 – 0.20 is acting as a strong support zone
Price movement is tightening → possible “compression phase”
---
🟢 Bullish Scenario
Bullish momentum becomes valid if price:
1. Breaks and closes above the descending trendline
2. Breaks key resistance levels:
0.2020
0.2200
0.2400
📈 Upside targets:
0.2650
0.3300
0.4250
💡 A breakout with strong volume could signal: ➡️ Early trend reversal or at least a strong relief rally
---
🔴 Bearish Scenario
Bearish bias remains dominant if:
1. Price fails to break the trendline
2. Gets rejected around 0.20 – 0.22
📉 Downside potential:
Retest of 0.1587 low
If breakdown occurs:
احتمال continuation to lower levels (price discovery)
💡 The more often support is tested, the higher the probability of a breakdown
---
⚠️ Key Levels to Watch
Critical Resistance: 0.2020 – 0.2200
Major Resistance: 0.2400 – 0.2650
Main Support: 0.1587
Descending Trendline = Directional Key
---
🧩 Conclusion
WIF is currently at a critical point:
Still under mid-term bearish pressure
But showing early signs of bottom consolidation
➡️ Breakout = potential strong rally
➡️ Rejection = continuation of downtrend
The market is approaching a decisive move.
#WIFUSDT #CryptoAnalysis #TechnicalAnalysis #Altcoin #TradingView #BreakoutSetup #BearishTrend #BullishReversal #CryptoTrading #SupportResistance #PriceAction #DescendingTriangle
WIFUSDT — Range Compression Before Liquidity ExpansionOn the 4H timeframe, WIFUSDT is currently in a post-impulse consolidation phase, after a strong bullish candle that drove price into a defined range. Since then, price has been compressing within a tight zone (~0.193–0.198), indicating inducement and liquidity buildup.
This type of structure is typical in ICT frameworks — the market pauses after expansion to engineer liquidity on both sides before making its next move.
Key observations:
Strong bullish impulse → initial buy-side draw completed
Current candles show overlap and indecision → lack of continuation
Price is sitting around equilibrium (0.5 level) → neutral zone
A large Fair Value Gap (FVG) below (~0.190–0.193) remains unfilled
Projected scenarios:
Primary scenario (more probable):
Price pushes slightly higher → sweeps buy-side liquidity above 0.198–0.200
Enters premium
Shows rejection / fails to continue
Forms a bearish CHoCH on lower TF
Moves down into FVG (~0.190–0.193)
Alternative scenario:
Price first dips into the FVG below to rebalance
Then expands upward to take liquidity above highs
Key confluences:
Range compression under highs = inducement
Clear liquidity resting above range
Untouched FVG below acting as magnet
Price at equilibrium → waiting for direction
Execution idea:
Avoid trading inside this range. Instead:
Wait for liquidity sweep (either side)
Confirm with structure shift (CHoCH/BOS)
Enter on retracement into imbalance
Invalidation:
If price breaks above 0.200 with strong continuation and acceptance, the bullish trend may extend further, invalidating the short-term bearish setup.
This is not financial advice. Always manage risk and wait for confirmation.
WIF (Dogwifhat) Rejected at $0.20 — Downside Pressure BuildingWIF price action is beginning to show clear signs of weakness following a rejection from the $0.20 resistance level, a key psychological and structural zone. The inability to break and hold above this region suggests that buyers are losing momentum, with sellers stepping in to defend higher prices.
Since the rejection, price has started to rotate lower, indicating a potential shift in short-term market structure. The next key level to watch is the Point of Control (POC), which represents the highest traded volume within the current range and often acts as a strong area of support.
However, if price fails to hold this level, it would signal a loss of value and acceptance at lower prices. This would likely increase bearish momentum and open the door for further downside expansion.
From a liquidity perspective, a breakdown below the POC could trigger a faster move, as lower regions of the range show less historical support. This sets up a potential continuation move toward the $0.16 support level, where demand may begin to re-enter.
As long as WIF remains below $0.20, the bias remains tilted to the downside, with increasing probability of a deeper corrective move.
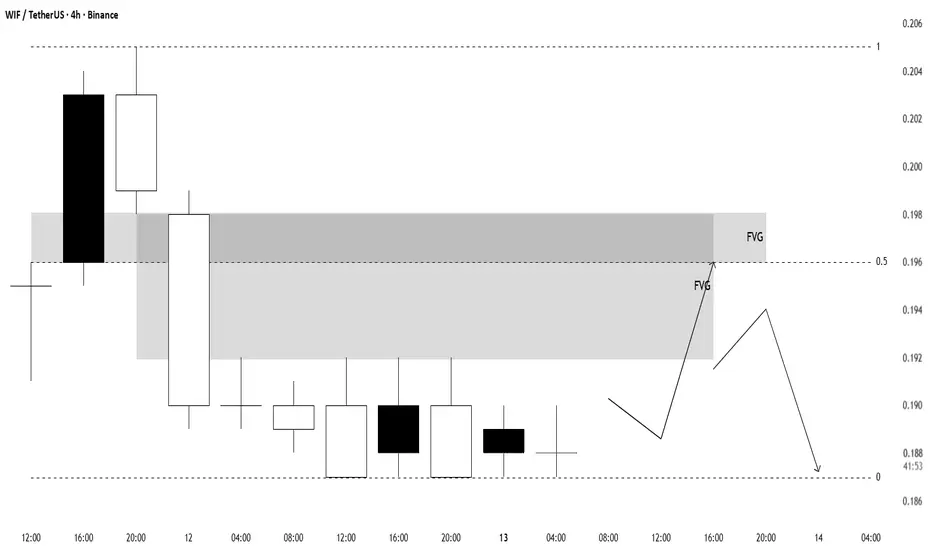
WIFUSDT — Engineered Liquidity Before Expansion MoveOn the 4H timeframe, WIFUSDT is showing a clear consolidation after a strong bearish impulse, with price forming tight range candles and equal lows. This behavior reflects low volatility and liquidity buildup, which is typical before a significant move.
Currently, price is trading in a discount zone, but ICT logic suggests that the market will likely rebalance inefficiencies before continuing lower. The key area of interest is the large Fair Value Gap (FVG) above (~0.194–0.198), acting as a strong draw on price.
Projected ICT scenario:
Price may first sweep sell-side liquidity below equal lows (~0.188)
Then initiate a retracement upward into the FVG zone
Potentially tap into buy-side liquidity above minor highs
Show clear rejection (lower timeframe CHoCH)
Continue downward targeting sell-side liquidity (~0.185 and below)
The presence of a large imbalance above combined with equal lows below suggests that the market is engineering liquidity on both sides, with a higher probability of inducement before continuation.
Key confluences:
Bearish displacement structure
Equal lows forming (sell-side liquidity pool)
Large FVG above acting as magnet
Weak bullish momentum during consolidation
Execution idea:
Wait for price to move into the FVG and confirm bearish structure before entering short positions. Avoid entering at current levels without confirmation.
Invalidation:
If price breaks above the FVG and sustains, it may indicate a stronger bullish retracement or potential shift in structure.
This is not financial advice. Always apply proper risk management.
WIFUSDT — Bearish Continuation After Premium RetracementOn the 4H timeframe, WIFUSDT is showing a clear bearish shift in structure following a strong bullish expansion. After reaching the highs, price has started to form lower highs and deeper pullbacks, signaling that buyers are losing control and the market is transitioning into a distribution phase.
Currently, price is trading below equilibrium (0.5 level), confirming a discount environment, which favors continuation to the downside. However, before continuation, the market often seeks to rebalance inefficiencies.
A key level to watch is the Fair Value Gap (FVG) above (~0.196–0.197). This zone acts as a retracement magnet, meaning price may move upward to fill this imbalance before continuing lower.
Projected ICT scenario:
Price forms a short-term pullback upward into the FVG (premium zone)
Possibly taps into liquidity above minor highs
Shows clear rejection (wick / lower timeframe BOS)
Continues downward toward sell-side liquidity below (~0.191 and lower)
The recent long bearish candle also suggests that sell-side liquidity has been partially taken, but more may still remain below, making further downside likely after retracement.
Key confluences:
Bearish market structure (lower highs forming)
Price in discount (continuation context)
FVG above acting as inducement
Liquidity resting below recent lows
Execution idea:
Wait for price to retrace into the FVG and confirm rejection before entering short. This aligns with ICT concepts of rebalance → continuation.
Invalidation:
If price breaks above the FVG and sustains, it would suggest a potential shift back toward bullish conditions.
This is not financial advice. Always apply proper risk management.
WIFUSDT — Bearish Continuation After FVG TapOn the 4H timeframe, WIFUSDT is exhibiting a developing bearish structure, characterized by a gradual formation of lower highs and weakening bullish momentum. After the initial impulsive move upward, price has transitioned into a corrective phase, suggesting distribution by smart money.
Currently, price is positioned around the equilibrium (0.5 level) of the range, but with a slight bias below it — indicating a lean toward discount pricing, which typically favors continuation to the downside.
A key technical element is the Fair Value Gap (FVG) just above current price. This imbalance represents an area where price may retrace to rebalance inefficiencies before continuing its directional move. The reaction around this zone is critical.
Projected ICT scenario:
Price completes a short-term retracement upward into the FVG (around 0.192–0.194 zone)
Potentially taps slightly into premium territory
Shows clear rejection (wick / lower timeframe BOS)
Initiates a bearish continuation move targeting sell-side liquidity below
The downside objective is the liquidity resting under recent lows (~0.182 and below), which aligns with the drawn projection.
Key confluences:
Weakening structure transitioning bearish
Price near/below equilibrium
FVG acting as retracement magnet
Clear sell-side liquidity below
Execution idea:
Wait for price to enter the FVG and confirm rejection on lower timeframes. This provides a high-probability short setup, aligning with ICT principles of inefficiency rebalancing followed by continuation.
Invalidation:
If price breaks above the FVG and holds in premium, this would suggest a shift toward bullish continuation and invalidate the bearish bias.
This is not financial advice. Always apply proper risk management.
WIFUSDT — Premium Push Into Liquidity Before FVG RebalanceOn the 4H timeframe, WIFUSDT shows a strong bullish impulse, with price aggressively expanding out of a prior consolidation range. This displacement confirms bullish strength, but also leaves behind a clear Fair Value Gap (FVG) below, indicating inefficiency that price is likely to revisit.
Currently, price is trading above the equilibrium (0.5) level, placing it firmly in premium territory. In ICT terms, this is where smart money typically begins to distribute positions rather than accumulate, making new long entries less favorable.
Recent candles show slowing momentum near the highs, suggesting that the market may be preparing for a liquidity event. Importantly, there is still buy-side liquidity resting above the recent highs, which price has not yet fully taken.
This aligns with a classic ICT scenario:
Continuation → liquidity sweep → rejection → FVG fill
The most probable path is a push higher to take out stops above the highs (toward the 1.0 level), followed by a reversal and retracement into the FVG zone. This imbalance below acts as a magnet where price seeks to rebalance before deciding the next directional move.
Key confluences:
Strong bullish displacement = expansion phase
Price in premium = reduced long value
Liquidity above highs = immediate target
FVG below = primary downside objective
Execution idea:
Wait for price to sweep liquidity above highs and show confirmation of rejection (e.g., lower timeframe CHoCH or BOS). This would provide a high-probability short setup, targeting the FVG and potentially deeper into discount.
Invalidation occurs if price continues to hold above highs and build bullish continuation structure, indicating sustained upward expansion.
This is not financial advice. Always use proper risk management.