In-depth trading ideas
COPPERXCUUSD (Copper) 4H Chart Analysis – Shavyfxhub Strategy
+ Current Bond Yield, Interest Rate & DXY
Current Price: ≈ 6.80
Market Structure (Shavyfxhub Style)
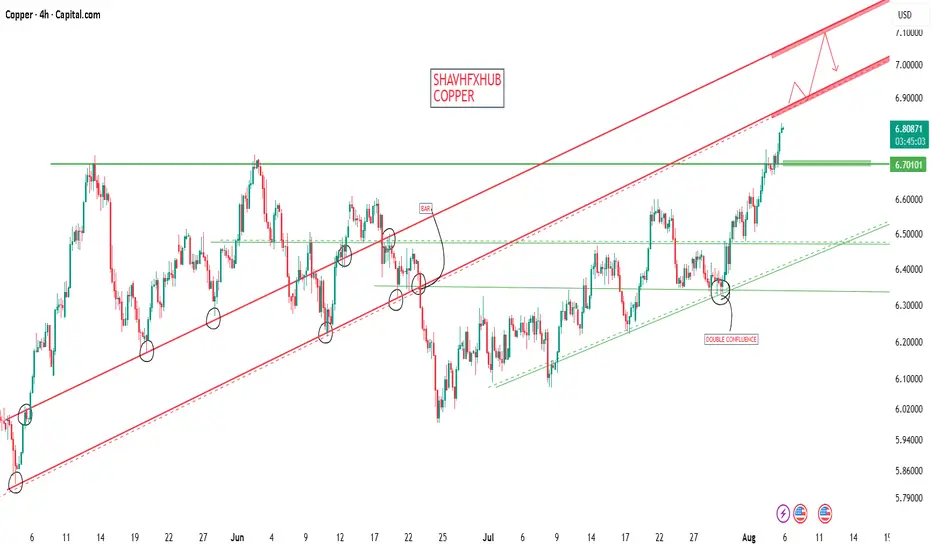
Copper is trading inside a clear ascending channel.
Multiple touch points on the lower red ascending trendline show consistent demand.
Price recently broke above the horizontal green resistance near 6.70 and is now testing the upper part of the channel.
A Double Confluence zone is marked around the mid-channel (previous support/resistance flip).
Projected path on the chart shows potential continuation higher toward the upper channel boundary near 7.00+, with possible pullbacks along the way.
Key Levels:
Supply / Resistance
Upper channel boundary (currently near 7.00 – 7.10)
Horizontal resistance around 6.70 (now acting as support after the break)
Demand / Support
Horizontal demand zones around 6.50 and 6.35–6.30
Double Confluence area in the middle of the channel
Current Bias:
Bullish as long as price holds above the rising channel support and the 6.70 zone. The structure favors continuation higher within the ascending channel.
Current Macro Data (5 Aug 2026)
Indicator,Current Level,Impact on Copper
DXY (Dollar Index),≈ 99.65 – 99.70,Soft dollar → Supportive for copper
US 10Y Treasury Yield,≈ 4.61% – 4.63%,Slightly lower → Mildly supportive
Fed Funds Rate,3.50% – 3.75%,Unchanged (restrictive but stable)
The softer dollar and modestly lower yields are currently providing a supportive backdrop for industrial metals like copper.
Summary (Shavyfxhub View)
Structure = Clean ascending channel with multiple demand confirmations
Immediate focus = Hold above 6.70 and the rising trendline
Upside targets = Upper channel boundary near 7.00 – 7.10
Macro = Soft DXY + stable-to-lower yields are helping the bullish technical structure
Price remains in a healthy uptrend. As long as the ascending channel support holds, the bias stays bullish toward higher levels.
7 Aug XCUUSD outlook: Potential for further gainsCopper prices surged to a record high, supported by tightening global supply and resilient demand.
The DR Congo imposed an immediate ban on copper concentrate exports, while production disruptions at Codelco's El Teniente mine added to supply concerns.
At the same time, declining inventories in China and strong US buying reinforced bullish sentiment.
Overall, the fundamental backdrop remains supportive for copper, with tightening supply and firm demand likely to keep prices elevated in the near term.
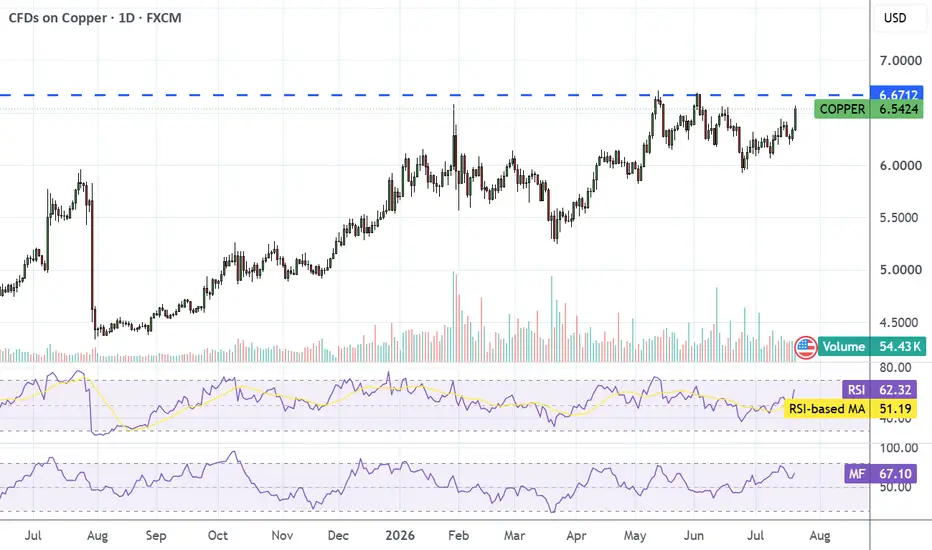
From a technical perspective, XCUUSD extended its rally, forming higher swings after rebounding above the support zone on the weekly timeframe. The recent rally has pushed prices towards the 78.6% Fibonacci retracement.
The broader technical structure remains constructive. Price continues to print higher highs and higher lows while holding comfortably above the rising long-term trendline, suggesting the primary trend remains firmly bullish.
As long as copper remains above the support zone at 6.13479, the bullish structure would stay intact. A successful retest of this zone could attract fresh buying interest and pave the way for another attempt towards 7.0000, with a sustained break above this resistance exposing the record high around 7.5000.
However, momentum is beginning to show early signs of moderation. While the MACD remains in positive territory, the histogram has started to flatten, suggesting bullish momentum may be slowing after the recent advance. This does not necessarily signal a reversal but raises the possibility of a short-term consolidation or pullback before the broader uptrend resumes.
A deeper correction below 6.13479 would shift attention towards the next key support around 5.29207, where buyers may look to defend the longer-term bullish trend.
Overall, the technical outlook remains bullish, supported by a series of higher highs and higher lows. The longer-term backdrop also continues to favour copper as structural supply constraints and growing demand from AI infrastructure, electrification and renewable energy investment underpin the metal's fundamental outlook.
By Li Xing Gan, Financial Markets Strategist Consultant to Exness
COPPER XCUUSDCopper (XCUUSD) Analysis + Use Cases + Manufacturing Process
1. Chart Analysis (Monthly – Shavyfxhub Style)
Overall Structure:
Copper is in a long-term ascending channel (green & red trendlines) since the early 2000s.
The structure shows clear higher lows — bullish long-term market structure.
Key Levels:
Demand Floor (Green): Major support around $3.27 – $3.50 and the lower ascending trendline.
Supply Roof (Red): Upper channel resistance currently near $6.00 – $7.00+.
Current price is trading near the upper part of the channel after a strong multi-year rally.
Technical Outlook:
Long-term Bullish Bias.
As long as price holds above the green demand floor, the secular uptrend remains intact.
A break above the current highs would target the upper red channel lines.
Verdict: Copper remains in a strong long-term bullish structure. Corrections are healthy within the bigger uptrend.
2. Copper Manufacturing Process
Copper is produced mainly through two methods:
Primary Production (Mining)
Ore is extracted (open-pit or underground).
Crushed and ground.
Concentrated using flotation.
Smelted to produce copper matte → converted to blister copper → refined by electrolysis to produce high-purity copper (99.99%).
Secondary Production (Recycling)
Scrap copper is melted and refined.
Recycling is a major source of supply and is highly energy-efficient.
3. Major Use Cases of Copper
Industrial Applications (Largest demand):
Electrical & Electronics: Highest electrical conductivity after silver → used in wiring, motors, transformers, circuit boards.
Construction: Plumbing, roofing, and building wiring.
Renewable Energy: Critical for solar panels, wind turbines, and electric vehicle (EV) motors and charging infrastructure.
Transportation: Cars, trains, and aircraft.
Medical Applications:
Antimicrobial Properties: Copper kills bacteria, viruses, and fungi on contact.
Used in hospital surfaces, bed rails, door handles, and medical equipment to reduce infections.
Wound dressings and some medical devices also incorporate copper.
Key Point: Copper is often called “Dr. Copper” because its price reflects global economic health — especially industrial and construction activity.
4. Future Direction / Bias
Long-term Bias: Bullish
Driven by:
Green energy transition (EVs, solar, wind)
Global infrastructure spending
Limited new mine supply
Strong structural demand from AI data centers and electrification
Short-term corrections are normal, but the multi-year structure remains upward
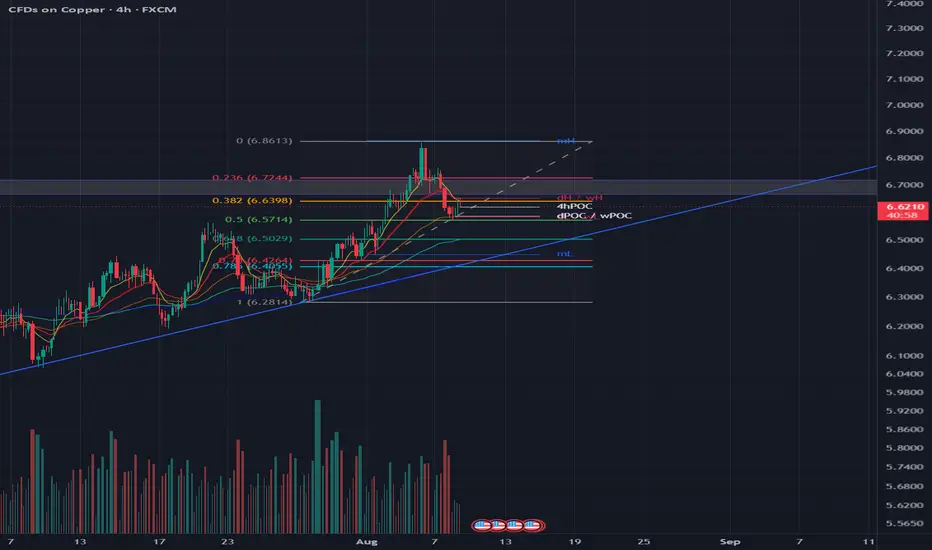
Coppe bullish structureCopper is in a bullish upward pattern with the sells becoming weaker and weaker.
Excellent confluence at 0.5Fib with eyes on an attempted reclaim of 0.382 Fib by the bulls for continuation, or a test of 0.618 Fib.
The purple box which represents the supply zone was breached once and thus became weaker. Another breach upward is not ruled out if bulls keep pushing.
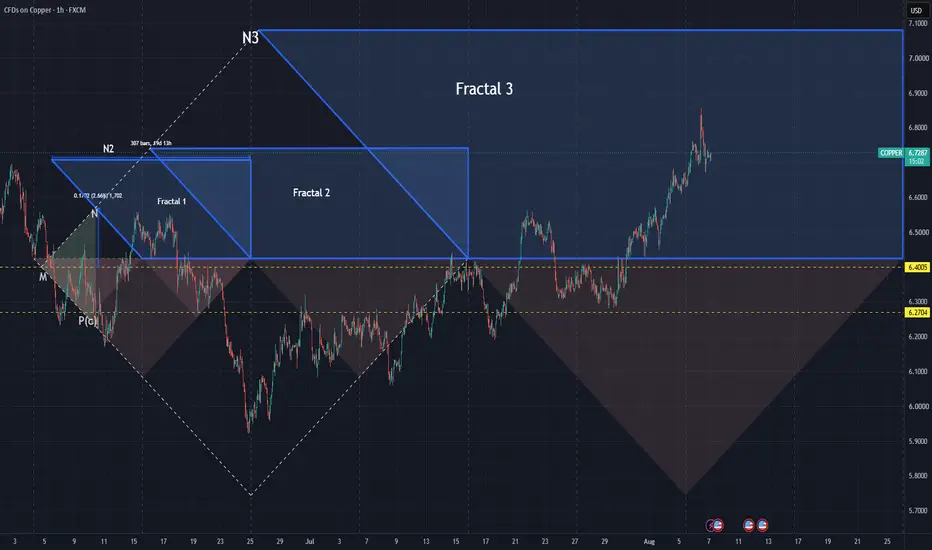
Market DNA Copper Cycle 3 Fractal 2 RealizedMarket DNA Copper Cycle 3 Fractal 2 Realized
Phase: 1
Date & Time: 2026-05-19 22:56 EST
Primary Entry M: 6.1478 $
Secondary Entry P(c): 5.917$
Mean Entry: (6.1478+5.917)/2=6.0324$
Trapezoid Time Duration: 24 Days
3th Triangle domain (%): 2 * 5.22% = 10.44%
Risk coefficient (R): 3
Risk domain (%) (D): (3th Triangle domain) *(Risk coefficient) = 10.44%*3 = 31.32 %
Hypothetical Capital: 100,000$
Contract Size: 10000 Unit
Expected Max Drawdown (%): 5%
Expected Max Drawdown $ (EMDD): 100,000 * 5% = 5,000
Expected Low Price: (1 – 31.32%) * 6.0324$ = 4.143$
Size: 5,000 / (6.0324 – 4.143) ~= 2646.34Unit
Position Size: Size/Contract Size = 2646.34 /10000 = 0.26
Each Trade Size = 0.26 /2 = 0.13
Targets:
T1 (Mirror / Lower Trapezoid): 6.2173$
T2 (Apex N): 6.4996 $
T3 (Trapezoid Top): 6.718$
Expected Profit by first entry and Exit at T3 for Scenario No 1:
(T3 - Entry M) * Contract Size * Each Trade Size = (6.718 -6.1478) *10000*0.13= 741.26$
Expected Total Profit for Scenario No 1: 741.26$
Expected Return % for Scenario No 1: 100*(741.26/100,000) = 0.74%
Expected Annual Return% for Scenario No 1: (0.74 %*365/24) =11.25%
Expected Profit by 2th entry and Exit at T2 for Scenario No 2:
(T3 - Entry M) * Contract Size * Each Trade Size = (6.718 -6.1478) *10000*0.13= 741.26$
(T2 - Entry P(c)) * Contract Size * Each Trade Size = (6.4996 -5.917) *10000*0.13= 757.38$
Expected Total Profit for Scenario No 2: 741.26+757.38=1,498.64$
Expected Return% for Scenario No 2: 100*(1,498.64/100,000) =1.49%
Expected Annual Return% for Scenario No 2: 1.49%*365/24=22.66%
Notes: P(c) may or may not be reached; both M and P(c) are Phase 1 only.
"Both trade sizes are calculated using the hypothetical capital, the investor’s maximum allowed drawdown, the 3rd Triangle Domain percentage, the Risk Coefficient, and the Contract Size."
TotalSize=(EMDD=5000)/(2*D*R*MeanPrice*ContractSize)
Phase: 3
Date & Time: 2026-05-24 18:30 EST
Before the price touches the trapezoid on delayed mirror, climbed to the N price level, reaching 6.4996$.
Up to this point, the initial position was opened at 6.1478 on M, the Phase3 is completed by reaching the Price at 6.4996$, and half of the position could be release and 457.34$ save to SafetyBuffer. So the SRB is updated to 3. 9334$.Will the next phase be Phase 2? We are navigating the market to see what happens next.
Phase: 2
Date & Time: 2026-05-25 11:00 EST
After Phase 3, The price touched the Trapezoid Left Boundary (Delayed Mirror) at 6.483$ and Phase 2 is completed.
Will the next phase be Phase 4? We are navigating the market to see what happens next.
Phase: 4
Date & Time: 2026-08-05 12:45 EST
The Price reached to the Trapezoid Upper Boundary T3 at 6.718$.
The expected total profit for Scenario No. 1 in Phase 1 was 741.26$ and now 1,256$ has been realized completely by releasing 914$ from SaftiBuffer and 342$ profit from Cycle completion on phase4.
Realized Return (%): 100*(1,256/100,000) = 1.25%
Expected Return (%): 0.74%
The lowest price along this path was 5.9217$, which led to the storage of the maximum field for the continuation of the path. Furthermore, the maximum capital drawdown is calculated as follows:
(6.9217$ - 6.0324$) *10000*0.26 = -2,312$
Max Drawdown (%): 100*(-2,312/100,000) = -2.31%
Trapezoid Time Duration: 24 Days
Realized Time Duration: 77 Days
Present and compare Expected Return (%), Realized Return (%), Expected Drawdown (%), Realized Drawdown (%), Trapezoid Time Duration and Realized Time Duration together
Fractal: 2
Current Date & Time: 2026-08-06 09:50 EST
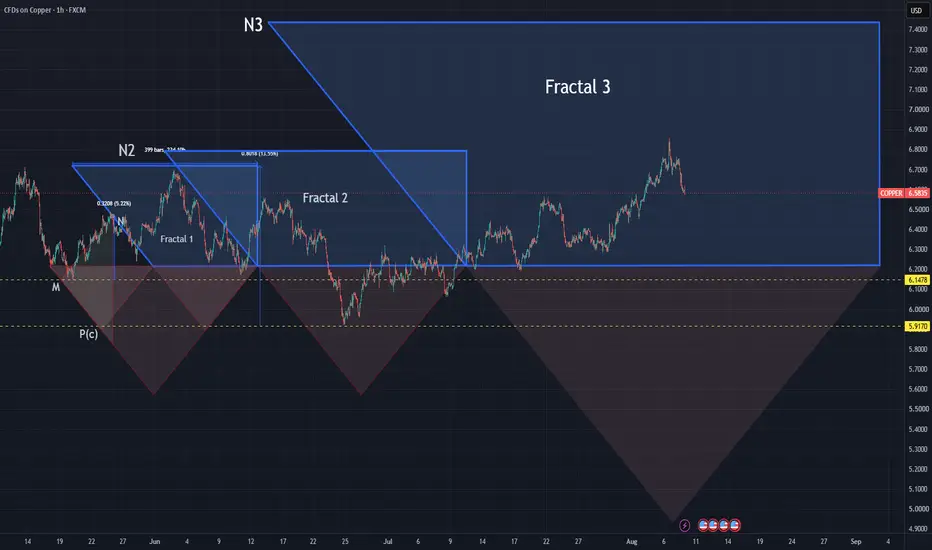
After Completion phase 4 of Fractal 1, price touched the Fractal 2 Trapezoid Upper Boundary within Fractal 3 Time Window.
Market DNA Copper Cycle 4 Fractal2 RealizedTitle:
Market DNA – Fractal 2 Structural Observation (Realized)
Sub-title:
Multi-Asset Structural Progression (Fractal 1 → 2)
Metadata:
• Date: 2026-08-05 14:25 EST
• Assets: Copper (Copper)
• Cycle IDs: 4
1- Context
This document presents a structural observation across multiple Market DNA cycles.
The analysis is based on previously published and time-stamped cycle records,
tracking their progression from Fractal 1 through Fractal 3.
2- Observation Summary
• Multiple assets analyzed
• Multiple cycles tracked
• Consistent structural progression observed
• Fractal 1 structures were previously defined and published.
• Fractal 2 completion observed across cycles.
• Fractal 3 currently in progress.
• Completion tends to occur within or near the trapezoidal time window.
3- Fractal Cycle Evolution (F1 → F2 → F3)
Observed Evolution:
Fractal 1 → Initial structural encoding of the cycle (M–P(c) definition and initial boundary formation).
Fractal 2 → Structural development and interaction within defined boundaries.
Fractal 3 → Activation window for structural release and completion of the primary cycle.
4- Hypothesis
Fractal 3 may represent a dominant structural activation window
where accumulated time-pressure and structural interactions
lead to directional release and cycle completion.
5- Status
This is an ongoing observation and not yet a validated law.
Further documentation and additional samples are required.
6- Cross-Asset Observation
Across all analyzed assets, Fractal 3 structures show
consistent alignment in both price interaction and time progression.
Completion tends to occur within a bounded time window,
with limited deviation.
7- Key Insight
Fractal 3 appears to act as a structural activation window,
where accumulated field pressure and temporal distortion (time bending)
interact and resolve through accelerated price movement.
8- Conclusion
Current observations indicate a consistent structural behavior
across multiple Market DNA cycles, where Fractal 3 functions
as a critical activation and completion layer.
Multiple instances have now been documented.
Further validation is required to determine whether this behavior
represents a general structural principle.
9- Disclaimer
This document is part of the Market DNA structural market research framework.
It does not constitute financial advice.
Market DNA Copper Cycle 3 Phase 4 of 4Market DNA Copper Cycle 3 Phase 4 of 4
Phase: 1
Date & Time: 2026-05-19 22:56 EST
Primary Entry M: 6.1478 $
Secondary Entry P(c): 5.917$
Mean Entry: (6.1478+5.917)/2=6.0324$
Trapezoid Time Duration: 24 Days
3th Triangle domain (%): 2 * 5.22% = 10.44%
Risk coefficient (R): 3
Risk domain (%) (D): (3th Triangle domain) *(Risk coefficient) = 10.44%*3 = 31.32 %
Hypothetical Capital: 100,000$
Contract Size: 10000 Unit
Expected Max Drawdown (%): 5%
Expected Max Drawdown $ (EMDD): 100,000 * 5% = 5,000
Expected Low Price: (1 – 31.32%) * 6.0324$ = 4.143$
Size: 5,000 / (6.0324 – 4.143) ~= 2646.34Unit
Position Size: Size/Contract Size = 2646.34 /10000 = 0.26
Each Trade Size = 0.26 /2 = 0.13
Targets:
T1 (Mirror / Lower Trapezoid): 6.2173$
T2 (Apex N): 6.4996 $
T3 (Trapezoid Top): 6.718$
Expected Profit by first entry and Exit at T3 for Scenario No 1:
(T3 - Entry M) * Contract Size * Each Trade Size = (6.718 -6.1478) *10000*0.13= 741.26$
Expected Total Profit for Scenario No 1: 741.26$
Expected Return % for Scenario No 1: 100*(741.26/100,000) = 0.74%
Expected Annual Return% for Scenario No 1: (0.74 %*365/24) =11.25%
Expected Profit by 2th entry and Exit at T2 for Scenario No 2:
(T3 - Entry M) * Contract Size * Each Trade Size = (6.718 -6.1478) *10000*0.13= 741.26$
(T2 - Entry P(c)) * Contract Size * Each Trade Size = (6.4996 -5.917) *10000*0.13= 757.38$
Expected Total Profit for Scenario No 2: 741.26+757.38=1,498.64$
Expected Return% for Scenario No 2: 100*(1,498.64/100,000) =1.49%
Expected Annual Return% for Scenario No 2: 1.49%*365/24=22.66%
Notes: P(c) may or may not be reached; both M and P(c) are Phase 1 only.
"Both trade sizes are calculated using the hypothetical capital, the investor’s maximum allowed drawdown, the 3rd Triangle Domain percentage, the Risk Coefficient, and the Contract Size."
TotalSize=(EMDD=5000)/(2*D*R*MeanPrice*ContractSize)
Phase: 3
Date & Time: 2026-05-24 18:30 EST
Before the price touches the trapezoid on delayed mirror, climbed to the N price level, reaching 6.4996$.
Up to this point, the initial position was opened at 6.1478 on M, the Phase3 is completed by reaching the Price at 6.4996$, and half of the position could be release and 457.34$ save to SafetyBuffer. So the SRB is updated to 3. 9334$.Will the next phase be Phase 2? We are navigating the market to see what happens next.
Phase: 2
Date & Time: 2026-05-25 11:00 EST
After Phase 3, The price touched the Trapezoid Left Boundary (Delayed Mirror) at 6.483$ and Phase 2 is completed.
Will the next phase be Phase 4? We are navigating the market to see what happens next.
Phase: 4
Current Date & Time: 2026-08-05 12:45 EST
The Price reached to the Trapezoid Upper Boundary T3 at 6.718$.
The expected total profit for Scenario No. 1 in Phase 1 was 741.26$ and now 1,256$ has been realized completely by releasing 914$ from SaftiBuffer and 342$ profit from Cycle completion on phase4.
Realized Return (%): 100*(1,256/100,000) = 1.25%
Expected Return (%): 0.74%
The lowest price along this path was 5.9217$, which led to the storage of the maximum field for the continuation of the path. Furthermore, the maximum capital drawdown is calculated as follows:
(6.9217$ - 6.0324$) *10000*0.26 = -2,312$
Max Drawdown (%): 100*(-2,312/100,000) = -2.31%
Trapezoid Time Duration: 24 Days
Realized Time Duration: 77 Days
Market DNA Copper Cycle 4 Phase 4 of 4Market DNA Copper Cycle 4 Phase 4 of 4
Phase: 1
Date & Time: 2026-06-05 12:50 EST
Primary Entry M: 6.4005 $
Secondary Entry P(c): 6.2704$
Mean Entry: (6.2704+6.4005)/2=6.3354$
Trapezoid Time Duration: 20 Days
3th Triangle domain (%): 2 * 2.66% = 5.32%
Risk coefficient (R): 2
Risk domain (%) (D): (3th Triangle domain) *(Risk coefficient) = 5.32%*2 = 10.64 %
Hypothetical Capital: 100,000$
Contract Size: 10000 Unit
Expected Max Drawdown (%): 5%
Expected Max Drawdown $ (EMDD): 100,000 * 5% = 5,000
Expected Low Price: (1 – 10.64%) * 6.3354$ = 5.6613$
Size: 5,000 / (6.3354 – 5.6613) ~= 7417.29Unit
Position Size: Size/Contract Size = 7417.29 /10000 = 7.41
Each Trade Size = 7.41 /2 = 0.37
Targets:
T1 (Mirror / Lower Trapezoid): 6.424$
T2 (Apex N): 6.57 $
T3 (Trapezoid Top): 6.708$
Expected Profit by first entry and Exit at T3 for Scenario No 1:
(T3 - Entry M) * Contract Size * Each Trade Size = (6.708 -6.4005) *10000*0.37= 1,138$
Expected Total Profit for Scenario No 1: 1,138$
Expected Return % for Scenario No 1: 100*(1,138/100,000) = 1.13%
Expected Annual Return% for Scenario No 1: (1.13 %*365/20) =20.62%
Expected Profit by 2th entry and Exit at T2 for Scenario No 2:
(T3 - Entry M) * Contract Size * Each Trade Size = (6.708 -6.4005) *10000*0.37= 1,138$
(T2 - Entry P(c)) * Contract Size * Each Trade Size = (6.57 -6.2704) *10000*0.37= 1,108$
Expected Total Profit for Scenario No 2: 1,138+1,108=2,246$
Expected Return% for Scenario No 2: 100*(2,246/100,000) =2.25%
Expected Annual Return% for Scenario No 2: 2.25%*365/20=41.05%
Notes: P(c) may or may not be reached; both M and P(c) are Phase 1 only.
"Both trade sizes are calculated using the hypothetical capital, the investor’s maximum allowed drawdown, the 3rd Triangle Domain percentage, the Risk Coefficient, and the Contract Size."
TotalSize=(EMDD=5000)/(2*D*R*MeanPrice*ContractSize)
Will the next phase be Phase 2 or 3? We are navigating the market to see what happens next.
Phase: 2
Date & Time: 2026-06-12 15:00 EST
The Price Touched the Trapezoid Lower Boundary at 6.4565$.
Up to this point, the initial position was opened at 6.4005$ and 6.2704$ at M and P(c) Price Level. Will the next phase be Phase 3? We are navigating the market to see what happens next.
Phase 3:
Current Date & Time: 2026-08-04 00:55 EST
Price touched the N Price Level at 6.57 $ out of time window in fractal 1. But before this event, the Price could touch tow times to trapezoid lower boundary from below of P(c) and Safety buffer charged twice. At this stage half of opened position released and appends to Safety Buffer and it adjusted to 1,458$ and the SRB is adjusted to 5.4626$.
Up to this point, half of the position that was already opened at 6.4005 on M, remains open, the Phase3 is completed by reaching the Price at 6.57$. Will the next phase be Phase 4? We are navigating the market to see what happens next.
Phase: 4
Current Date & Time: 2026-08-05 12:40 EST
The Price reached to the Trapezoid Upper Boundary T3 at 6.708$.
The expected total profit for Scenario No. 2 in Phase 1 was 2,246$ and now 2,003$ has been realized completely by releasing 1,458$ from SaftiBuffer and 545$ profit from Cycle completion on phase4.
Realized Return (%): 100*(2,003/100,000) = 2.00%
Expected Return (%): 2.25%
The lowest price along this path was 5.9217$, which led to the storage of the maximum field for the continuation of the path. Furthermore, the maximum capital drawdown is calculated as follows:
(6.9217$ - 6.3354$) *10000*0.37 = -2,169$
Max Drawdown (%): 100*(-2,169/100,000) = -2.17%
Trapezoid Time Duration: 20 Days
Realized Time Duration: 61 Days
Market DNA Copper Cycle 4 Phase 3 of 4Will the next phase be Phase 4? We are navigating the market to see what happens next.
Phase: 1
Date & Time: 2026-06-05 12:50 EST
Primary Entry M: 6.4005 $
Secondary Entry P(c): 6.2704$
Mean Entry: (6.2704+6.4005)/2=6.3354$
Trapezoid Time Duration: 20 Days
3th Triangle domain (%): 2 * 2.66% = 5.32%
Risk coefficient (R): 2
Risk domain (%) (D): (3th Triangle domain) *(Risk coefficient) = 5.32%*2 = 10.64 %
Hypothetical Capital: 100,000$
Contract Size: 10000 Unit
Expected Max Drawdown (%): 5%
Expected Max Drawdown $ (EMDD): 100,000 * 5% = 5,000
Expected Low Price: (1 – 10.64%) * 6.3354$ = 5.6613$
Size: 5,000 / (6.3354 – 5.6613) ~= 7417.29Unit
Position Size: Size/Contract Size = 7417.29 /10000 = 7.41
Each Trade Size = 7.41 /2 = 0.37
Targets:
T1 (Mirror / Lower Trapezoid): 6.424$
T2 (Apex N): 6.57 $
T3 (Trapezoid Top): 6.708$
Expected Profit by first entry and Exit at T3 for Scenario No 1:
(T3 - Entry M) * Contract Size * Each Trade Size = (6.708 -6.4005) *10000*0.37= 1,138$
Expected Total Profit for Scenario No 1: 1,138$
Expected Return % for Scenario No 1: 100*(1,138/100,000) = 1.13%
Expected Annual Return% for Scenario No 1: (1.13 %*365/20) =20.62%
Expected Profit by 2th entry and Exit at T2 for Scenario No 2:
(T3 - Entry M) * Contract Size * Each Trade Size = (6.708 -6.4005) *10000*0.37= 1,138$
(T2 - Entry P(c)) * Contract Size * Each Trade Size = (6.57 -6.2704) *10000*0.37= 1,108$
Expected Total Profit for Scenario No 2: 1,138+1,108=2,246$
Expected Return% for Scenario No 2: 100*(2,246/100,000) =2.25%
Expected Annual Return% for Scenario No 2: 2.25%*365/20=41.05%
Notes: P(c) may or may not be reached; both M and P(c) are Phase 1 only.
"Both trade sizes are calculated using the hypothetical capital, the investor’s maximum allowed drawdown, the 3rd Triangle Domain percentage, the Risk Coefficient, and the Contract Size."
TotalSize=(EMDD=5000)/(2*D*R*MeanPrice*ContractSize)
Will the next phase be Phase 2 or 3? We are navigating the market to see what happens next.
Phase: 2
Date & Time: 2026-06-12 15:00 EST
The Price Touched the Trapezoid Lower Boundary at 6.4565$.
Up to this point, the initial position was opened at 6.4005$ and 6.2704$ at M and P(c) Price Level. Will the next phase be Phase 3? We are navigating the market to see what happens next.
Phase 3:
Current Date & Time: 2026-08-04 00:55 EST
Price touched the N Price Level at 6.57 $ out of time window in fractal 1. But before this event, the Price could touch tow times to trapezoid lower boundary from below of P(c) and Safety buffer charged twice. At this stage half of opened position released and appends to Safety Buffer and it adjusted to 1,458$ and the SRB is adjusted to 5.4626$.
Up to this point, half of the position that was already opened at 6.4005 on M, remains open, the Phase3 is completed by reaching the Price at 6.57$. Will the next phase be Phase 4? We are navigating the market to see what happens next.
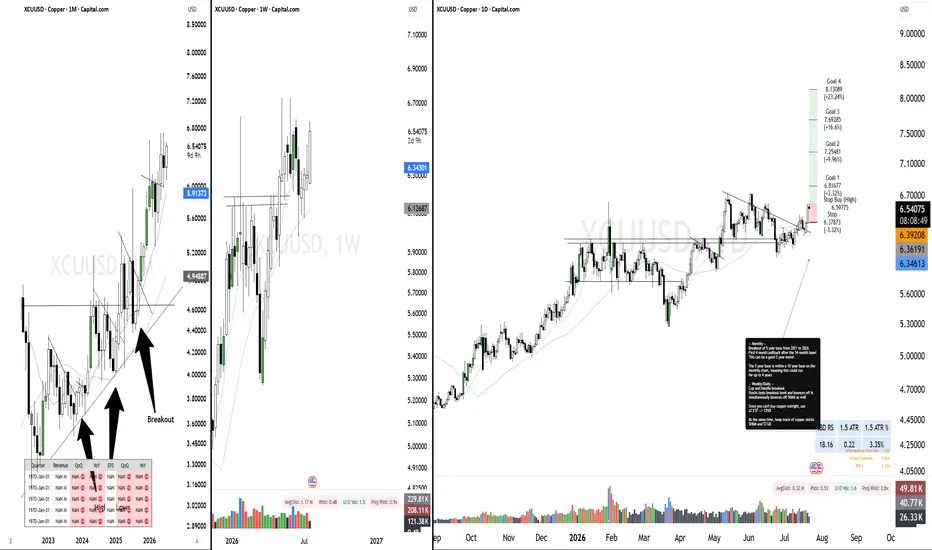
Copper 5-Year Base Breakout & First PullbackThe Setup:
AMEX:CPXR is a 2x leveraged ETF providing the cleanest way to get geared exposure to the massive copper breakout. Copper has officially broken out of a massive 5-year base (2021–2026) , which itself sits inside an even larger 10-year base structure. On the daily and weekly timeframes, we have a clear Cup and Handle breakout . Price is currently executing its very first 4-month pullback after the 54-month base, testing the breakout level and bouncing off the 50-Day MA .
Tip: Trade copper through AMEX:CPXR (2x) and keep the miners like NYSE:HBM and AMEX:TGB on your radar.
Reasoning:
5-Year Base Breakout (Major macro structure resolving upward)
First 4-month pullback (Highest-probability entry point after a macro shift)
Cup and Handle breakout (Shorter timeframe execution signal)
Bounce off breakout level & 50-Day MA (Old ceiling converting into new floor)
Leverage Option: AMEX:CPXR (2x ETF)
Copper Bull Triangle ThesisI think copper is forming an ascending triangle, and I circled all the times it touched the top of the triangle. Currently, on the 4hr, there's hidden bullish divergence at the same time as bearish divergence, but the overall trend is bullish. If it breaks out here, it will follow Path 1, where it breaks out to the pink trendline where we had two previous highs, gets rejected, retests the breakout zone, and then keeps going. If not, it just rejects at the top of the triangle and comes back down to retest the up-sloping trendline, eventually working its way to a breakout.
This is my thesis. If you have any corrections or questions, please comment.
Just mapping what I see and would like to see.
Thanks!
**Copper Chart: Key Price Levels Based on the 1-2-3 Analysis**In this chart, I have identified two key price zones where I expect the market to revisit.
The first zone is based on the structure of the well-defined bearish channel.
The second zone represents the **"Price Debt"** (an unresolved price level) according to my proprietary **1-2-3 Analysis** methodology.
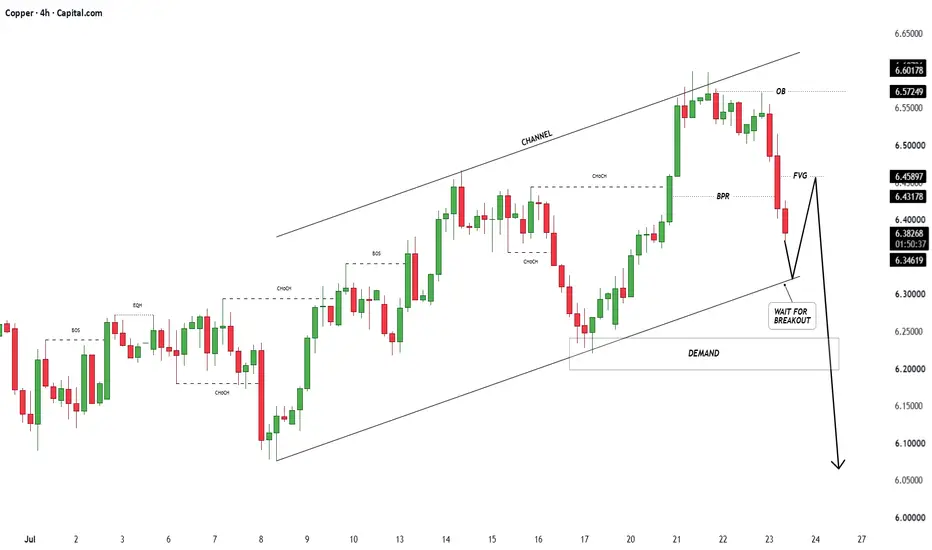
Copper Reversal Warns of More Pain AheadCopper has been taken to the woodshed as a breakout in the US dollar, alongside rising nominal and real Treasury yields, weighed on US dollar-denominated assets. Profit-taking may also have accelerated after the latest Section 301 tariff announcement excluded copper products already covered by Section 232, removing a catalyst some traders had anticipated.
A textbook evening star reversal pattern beneath resistance at $6.60 a pound warns of growing downside risks. Attention now shifts to the confluence of the 50-day simple moving average, the minor uptrend from the July 8 low and horizontal support around $6.33 a pound. A convincing break beneath that zone would confirm the reversal pattern.
Should price break below the support zone and hold there, shorts could be initiated with a tight stop above $6.33 a pound for protection. Initial downside targets are $6.23, where price bounced twice earlier this month, followed by the 100-day simple moving average at $6.145 and the more significant support zone around $6.04.
Momentum indicators are neutral. RSI (14) sits at 51, while MACD remains above zero but is converging on its signal line. As a result, price action should take precedence.
Good luck!
DS
Copper: 5-Year Base Breakout & First PullbackThe Setup:
AMEX:CPXR is a 2x leveraged ETF providing the cleanest way to get geared exposure to copper's breakout. Copper has officially broken out of a massive 5-year base (2021–2026) , which itself sits inside a larger 10-year base, suggesting the potential for a massive multi-year run. On the daily and weekly timeframes, we have a clear Cup and Handle breakout . Price is currently executing its very first 4-month pullback after the 54-month base, testing the breakout level and bouncing off it while simultaneously finding support at the 50-Day MA .
Tip: Trade copper through AMEX:CPXR (2x). And keep the copper miners NYSE:HBM and AMEX:TGB on your radar.
Reasoning:
5-Year Base Breakout (Major macro structure resolving upward)
First 4-month pullback (Highest-probability entry point after a macro shift)
Cup and Handle breakout (Shorter timeframe execution signal)
Bounce off breakout level & 50-Day MA (Old ceiling converting flawlessly into new floor)
Leverage Option: AMEX:CPXR (2x ETF)
COPPER ISN'T JUST A METAL. ITS A LIQUIDITY SIGNALCopper has just reclaimed a resistance trendline that capped every major rally for nearly two decades.
The first chart shows the long-term structure.
Every rejection from this trendline led to a meaningful slowdown in global growth expectations. Today, that same structure has flipped into support for the first time.
The second chart zooms into the breakout.
Price didn't simply break above resistance. It came back, tested it from above, held the level, and continued higher. That's classic trend confirmation.
Why does this matter for crypto?
Because copper is one of the purest barometers of industrial demand and global economic activity. Strong copper prices usually reflect improving liquidity conditions, stronger manufacturing expectations, and expanding risk appetite.
Bitcoin has historically performed best when liquidity expands, not contracts.
No single chart predicts the future. But macro markets leave clues long before the narrative changes.
Right now, copper is telling a very different story than the fear dominating crypto timelines.
If this breakout continues to hold, it strengthens the broader case that the current weakness across digital assets is taking place within an improving macro backdrop rather than the beginning of a prolonged contraction.
Sometimes the market that says the least tells you the most.
COPPER/GOLD
Potential bullish bounce?Copper is falling toward the support level, which aligns with the 38.2% Fibonacci retracement and could bounce from this level to our take profit.
Entry: 6.2121
Why we like it:
There is a pullback support level that aligns with the 38.2% Fibonacci retracement.
Stop loss: 6.0919
Why we like it:
There is a pullback support level.
Take profit: 6.3820
Why we like it:
There is an overlap resistance level.
Enjoying your TradingView experience? Review us!
Please be advised that the information presented on TradingView is provided to Vantage (‘Vantage Global Limited’, ‘we’) by a third-party provider (‘Everest Fortune Group’). Please be reminded that you are solely responsible for the trading decisions on your account. There is a very high degree of risk involved in trading. Any information and/or content is intended entirely for research, educational and informational purposes only and does not constitute investment or consultation advice or investment strategy. The information is not tailored to the investment needs of any specific person and therefore does not involve a consideration of any of the investment objectives, financial situation or needs of any viewer that may receive it. Kindly also note that past performance is not a reliable indicator of future results. Actual results may differ materially from those anticipated in forward-looking or past performance statements. We assume no liability as to the accuracy or completeness of any of the information and/or content provided herein and the Company cannot be held responsible for any omission, mistake nor for any loss or damage including without limitation to any loss of profit which may arise from reliance on any information supplied by Everest Fortune Group.
Copper: 18 months in the making ; The chart says buy?The video is an analysis of Copper, along with the trade setup I created on 1 July 2026, the day after the US Commerce Department released its recommendation regarding Section 232 refined copper tariffs to the White House ; the event that has been years in the making. Given the Goldman Sachs' upgrade of the year-end price target to $13,735 per tonne, coupled with the formation of a supply deficit on the global scene due to mine disruptions in Indonesia, Chile and DRC, the structural bullish case has never been more pronounced. This is a comprehensive analysis of Copper in which I take you through the chart, EMA structure, the implications of the RSI and MACD on the dip, and the exact way in which I intend to trade it from here. If you are interested in trading commodities or learning technical analysis, then you will find this video interesting.