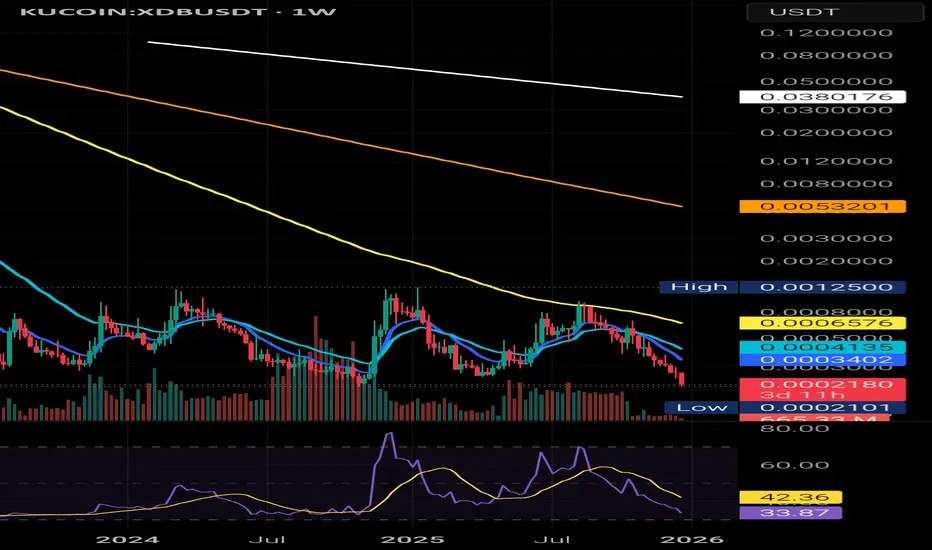
XDB Bullish !Hi. On weekly chart as you see it repeating previouse behavior. RSI crossed and now testing its MA. if you look to selected points in past you will see that after test it start bullish move upside. I suspect we are in exact reversal point to upside now. Initial target up to 0.002$, and after retest
XDB Chain / Tether
No trades
No trades
Compare with XDB/USDT
XDB (1W) Is This Latest Drop Real Breakout or a Liquidity Trap?On the weekly timeframe, XDBUSDT is printing a textbook setup combining the Wyckoff Method and the PO3 (Power of Three) concept. We are officially at a crucial, heart-racing pivot point! 🔥
Accumulation Phase: Price has been locked inside a well-defined trading range for over two years (blue box), r
$1k to $1million with this tiny market cap? - October 2025 As everyone falls off their chair at the prospect of $14k Ethereum.. a messily 220% return (who in crypto gets out of bed for that?), you’ve got to wonder, what percentage of us would lift the bed sheets for Ethereum at $1 as if it were December 2015?
As it turns out, very few.
When I first purch
See all ideas
Summarizing what the indicators are suggesting.
Oscillators
Neutral
Oscillators
Neutral
Summary
Neutral
Summary
Neutral
Summary
Neutral
Moving Averages
Neutral
Moving Averages
Neutral
Displays a symbol's price movements over previous years to identify recurring trends.
Frequently asked questions
The current price of XDB Chain / Tether (XDB) is 0.0000733 USDT — it has risen 6.28% in the past 24 hours. Try placing this info into the context by checking out what coins are also gaining and losing at the moment and seeing XDB price chart.
XDB Chain / Tether price has fallen by −6.64% over the last week, its month performance shows a −0.40% decrease, and as for the last year, XDB Chain / Tether has decreased by −85.37%. See more dynamics on XDB price chart.
Keep track of coins' changes with our Crypto Coins Heatmap.
XDB Chain / Tether (XDB) reached its highest price on Nov 21, 2021 — it amounted to 0.8502970 USDT. Find more insights on the XDB price chart.
See the list of crypto gainers and choose what best fits your strategy.
XDB Chain / Tether (XDB) reached the lowest price of 0.0000575 USDT on Jul 3, 2026. View more XDB Chain / Tether dynamics on the price chart.
See the list of crypto losers to find unexpected opportunities.
The safest choice when buying XDB is to go to a well-known crypto exchange. Some of the popular names are Binance, Coinbase, Kraken. But you'll have to find a reliable broker and create an account first. You can trade XDB right from TradingView charts — just choose a broker and connect to your account.
Crypto markets are famous for their volatility, so one should study all the available stats before adding crypto assets to their portfolio. Very often it's technical analysis that comes in handy. We prepared technical ratings for XDB Chain / Tether (XDB): today its technical analysis shows the strong sell signal, and according to the 1 week rating XDB shows the sell signal. And you'd better dig deeper and study 1 month rating too — it's sell. Find inspiration in XDB Chain / Tether trading ideas and keep track of what's moving crypto markets with our crypto news feed.
XDB Chain / Tether (XDB) is just as reliable as any other crypto asset — this corner of the world market is highly volatile. Today, for instance, XDB Chain / Tether is estimated as 4.89% volatile. The only thing it means is that you must prepare and examine all available information before making a decision.
You can discuss XDB Chain / Tether (XDB) with other users in our public chats, Minds or in the comments to Ideas.