Long
Long
Bitcoin (Macro) Elliott Wave Theory Analysis.Good afternoon peoples;
Thought I'd share my macro outlook on Bitcoin with you all.
This particular count has been one of the biggest challenges I've ever faced in these markets, but after a few years of experience - I feel I've finally tackled it.
-----
To keep things real simple, the chart says it all.
I think we're going to see 22k by around July,
after which btc will run to 126k.
126k will mark a significant cycle top, and a very large correction will take place after (which could last a few years).
I'm not going to talk too much about that right now since that's way in the future, but I will absolutely bring it up when the time comes.
-----
The market is by no means linear, so my view is subject to change as more data presents itself in the months ahead.
If any significant changes take place, you know I'll be the first to give you an update about it.
I've no bias in this market, I don't read\watch the news; all of my projections are strictly based on the methods that were taught to me by a very talented technical trader.
I have no idea what will cause these large moves either, nor does it matter to me right now.
The chart paints a very beautiful picture, and it is based off this picture which I base all of my trades on,
nothing else.
-----
Grand Cycle Wave 3 = $126k
Grand Cycle Wave 4 = $10k
Grand Cycle Wave 5 = $1.6M
💰 es1! retests 5kes1! appears poised for a larger move down, based on the smaller timeframe count .
this leads me to believe that es1! has entered a larger fourth wave. historically, these waves take an average of 2 months to play out and typically result in a 12% decrease from the high before completing.
wave 4's often retrace back into the territory of the prior degree's wave 4, and i expect this one to follow suit.
pay attention to the green trendline i've drawn on the chart,,, it serves as a solid guide for where i anticipate es1! to find a bottom. dipping below the trendline is acceptable, provided we don't see any weekly candle closes beneath it. even if a weekly candle does close below, a strong recovery the following week, such as a gap-up scenario , could invalidate the breakdown.
there’s not much else to add here, as the chart is fairly straightforward. keep an eye on the trendline and monitor weekly closes for confirmation.
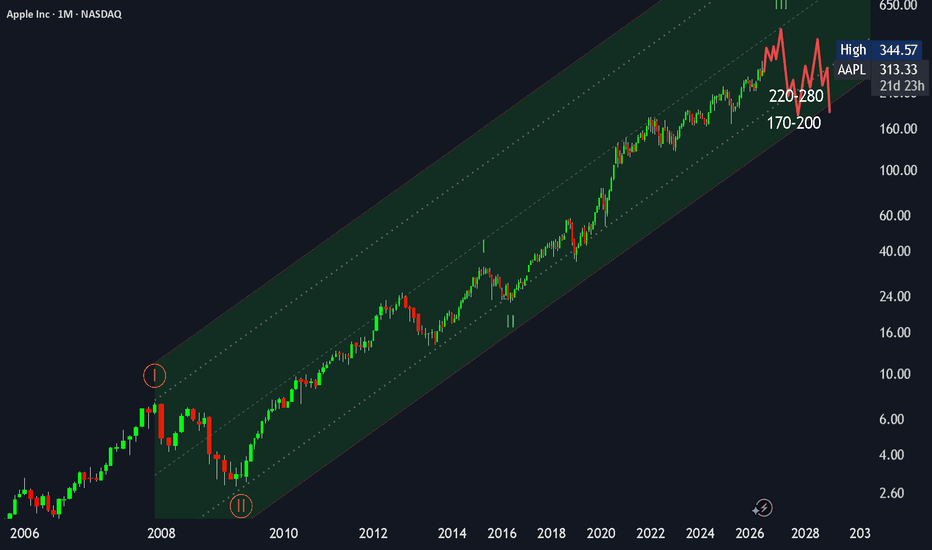
💸 Apple Stock Analysis: Is AAPL Entering a Multi-Year Range?Apple Stock Analysis: Is AAPL Entering a Multi-Year Range?
Apple remains one of the strongest long-term charts in the market.
The stock has been rising inside a major ascending channel for many years, and the bigger trend is still intact.
But from a technical point of view, the structure is becoming more mature.
That does not automatically mean a bearish reversal, but it does increase the probability that Apple may be moving closer to a long sideways phase rather than another period of clean, uninterrupted upside.
Long-term trend remains strong
On the monthly chart, Apple is still trading inside a very large rising channel.
This channel has guided the stock for many years, and price is still respecting that structure.
That is important because the long-term trend has not broken.
So the main question is not whether Apple is still a strong chart. It clearly is.
The more interesting question is whether the character of the trend is starting to change.
What is unusual here
The unusual part of this chart is the Elliott Wave structure.
Apple does not only show a strong advance.
It shows a trend where the upside kept developing through nested impulsive behavior. In simple terms, one advancing wave contains another impulsive advance, and inside that structure the same pattern appears again.
That kind of behavior helps explain why Apple spent so many years moving higher with only limited larger corrections.
The stock did not just trend up. It kept extending through multiple layers of impulsive structure.
This is why Apple has looked so strong for such a long time.
Why this matters now
The same structure that explains the strength of the long-term rally also suggests that the move is becoming more mature.
When a trend extends for many years without a major reset, the next important phase is often not a straight collapse.
More often, the market moves into a prolonged correction through time, not only through price.
That is why the next major phase in Apple may be a broad sideways range rather than a simple one-way decline.
A long sideways phase may be next
If the current higher-degree structure is approaching completion, Apple could start a multi-year corrective phase.
That does not mean the stock has to crash.
It means price may begin to alternate between strong declines and recoveries while remaining inside a wide range.
From a structural point of view, that range could develop as:
a triangle,
a flat-type correction,
or another prolonged sideways structure.
The important point is that the next major phase may be defined more by time and rotation than by a clean directional trend.
Key support zones to watch
Right now, the first major zone I would watch is 220-280.
If Apple starts to weaken from the upper part of the channel, this area could become the first meaningful support range.
If price moves below that area, the next broader zone to watch is 170-200.
Even a move into those lower zones would still fit the idea of a larger sideways phase inside the broader long-term structure.
In other words, a sizable correction would not automatically destroy the long-term chart. It could simply be part of a long consolidation.
Big picture
So the long-term view remains constructive, but the easy part of the trend may be behind us.
Apple still has a strong structural position, and the major channel is still intact.
At the same time, the stock is trading near the upper part of that long-term structure, and the wave count suggests that the next large phase may look more like a range than another long period of smooth upside.
That is why I would stay focused not only on upside potential, but also on the possibility that Apple is entering a new era of volatility and sideways movement.
Final thought
For now, Apple still looks structurally strong.
But if the current mature advance starts to roll over, the next big opportunity may come not from chasing strength, but from understanding the boundaries of a long-term range.
Dow Jones | Is the Fifth Wave Expanding?Wave (IV) in pink, the highest degree of this structure, ended in March 2009. From that point, the market entered a structure that may be the beginning of Wave (V) of the highest degree.
In equities, an extended fifth wave is also possible. So the key question is this:
We were looking for an Impulse pattern, where V? in turquoise was expected to mark the end of the structure. But what does the equality with the initial wave tell us?
Are we dealing with an extended fifth wave, or is the current structure part of (V) in blue?
At this stage, it is also possible that I, II, III and IV have already completed and the market is now developing V in turquoise — or that we are still within III, with the structure expanding to a higher degree.
Within the orange structure, if a correction develops, our initial expectation is for a sideways pattern, particularly considering alternation with Wave II in orange. However, the black structure also remains important.
Conservative Scenario
If Wave I is extended, Wave III may be shorter than Wave I. In that case, the relationship between I, III and V becomes especially important, and Wave V cannot develop in a way that conflicts with the guidelines of an Impulse structure.
One more subtle point: at the beginning of such a structure, a Diagonal pattern may also need to be considered; its internal boundaries cannot be ignored.
Even if a deeper correction develops and First Price Invalidation — 45,419.12 is broken, the larger scenario does not necessarily fail. The corrective pattern and wave degree would need to be reassessed.
Ultimately, we are not trying to predict price.
We are looking for the structure that best fits the rules and guidelines of the Wave Principle.
The pattern comes first. The rules decide the count.
Mr. Nobody — Patterns whisper. I listen. 🎧📊
Dow Jones Industrial Average Index
Jun 8
Dow Jones Industrial Average — A 130‑Year Elliott Wave Perspecti
May 7, 2023
To higher prices in the bull market? Higher or Flat?
 Long
Long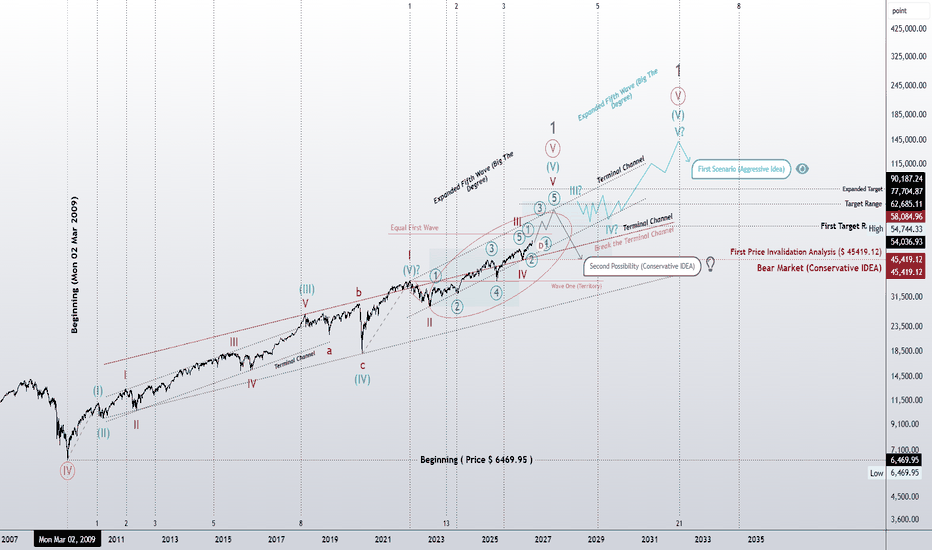
Corrective Waves – Zigzag, Flat, Triangle & CombinationThe attached image summarize the four major corrective wave families in Elliott Wave Theory: Zigzag, Flat, Triangle, and Combination.
Zigzag: Includes Single, Double, and Triple Zigzags. A Single Zigzag has a 5-3-5 structure, while Double and Triple Zigzags connect multiple Zigzags through X waves. Zigzags commonly appear in Wave-2, Wave-4, Wave-B, and other corrective positions.
Flat: Includes Regular, Expanded, and Running Flats, all based on a 3-3-5 structure. Flats can occur in Wave-2, Wave-4, Wave-B, Wave-X, and several combination positions.
Triangle: Includes Contracting, Barrier, Expanding, and Running Triangles, each normally having a 3-3-3-3-3 structure. Triangles commonly occur in Wave-4, Wave-B, Wave-X, and within combinations.
Combination: Includes Double Three and Triple Three, which combine corrective structures using W-X-Y or W-X-Y-X-Z formations.
Overall, corrective waves move against the larger trend and can vary considerably in structure. Alternation is an important guideline: different waves within these patterns may alternate between different corrective forms, helping create variation rather than repetitive structures.  Education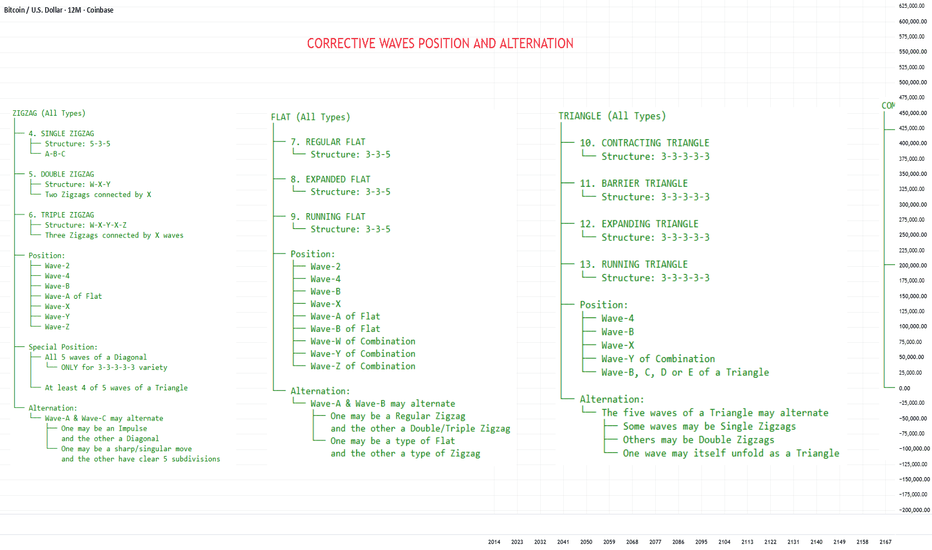
Motive Waves – Impulse and Diagonal PatternsThe attached chart summarizes the three major Motive Wave patterns in Elliott Wave Theory: Impulse, Contracting Diagonal, and Expanding Diagonal.
Impulse: Consists of five waves—1-2-3-4-5—and generally moves in the direction of the larger trend. It can occur as Wave-1, Wave-3, Wave-5, Wave-A of a Zigzag, and Wave-C of a Zigzag or Flat. Wave-1 and Wave-5 may also show alternation in their structure.
Contracting Diagonal: A five-wave motive pattern, normally subdividing 3-3-3-3-3, and can appear as either a Leading or Ending Diagonal. It can occur in Wave-1, Wave-5, Wave-A of a Zigzag, or Wave-C of a Zigzag/Flat. Its internal waves may also alternate between different corrective structures.
Expanding Diagonal: Similar to a Contracting Diagonal in its Leading/Ending role and 3-3-3-3-3 internal structure, but its trendlines expand rather than contract. It can occupy the same positions as a Contracting Diagonal.
In short: Motive Waves consist of Impulse and Diagonal patterns, and these patterns help identify whether the market is progressing in the direction of the larger trend and where a particular wave structure can occur.
Education 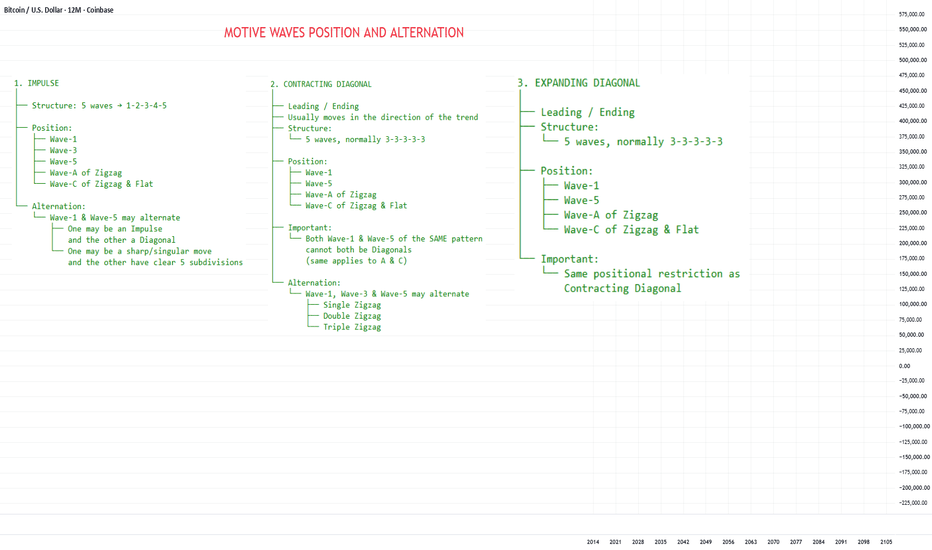
Education 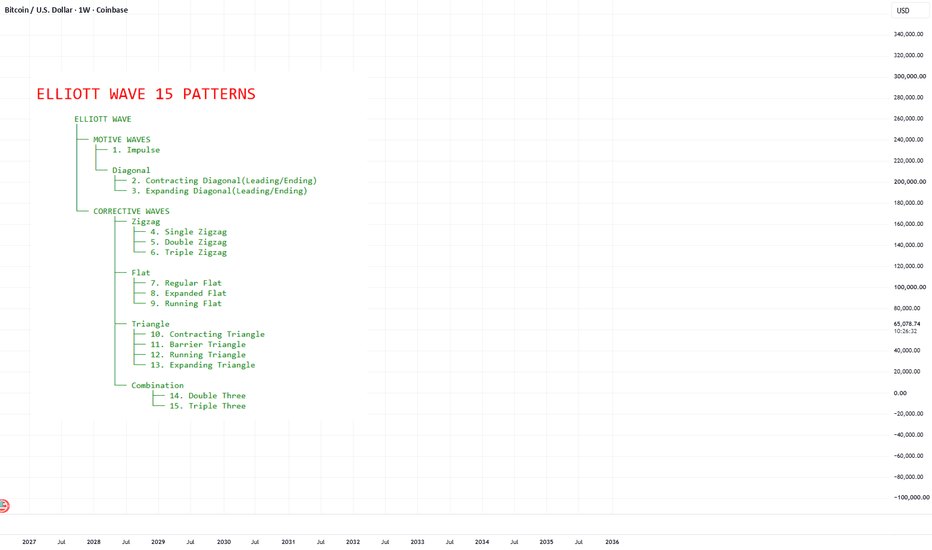
Long 
 Long
Long
 Long
Long
Short 
Gold H1: Bull Trap or Reload Long?
Gold remains supported by expectations that the Federal Reserve could begin easing policy later this year, while investors continue monitoring upcoming US inflation data and Fed speakers for confirmation of the rate outlook. A softer US Dollar and declining Treasury yields continue to provide a supportive backdrop for bullion, although short-term profit-taking is emerging after this week's aggressive rally.
Many retail traders may interpret this consolidation as the beginning of a bearish reversal. However, Smart Money often uses shallow pullbacks after displacement moves to rebalance inefficient price delivery before continuing toward higher liquidity pools.
Technical Outlook (H1)
Following a powerful impulsive expansion, Gold has established a clear bullish market structure with higher highs and higher lows.
The recent breakout created strong institutional displacement, leaving an imbalance beneath current price. Instead of chasing highs, institutional participants typically wait for price to retrace into premium-discount equilibrium before initiating additional buying.
Current market structure suggests:
Bullish structure remains intact.
Price is consolidating beneath external liquidity.
Institutional pullback toward the Discount Array remains possible.
HTF Buy-side Liquidity around 4,300–4,310 remains the first upside objective.
A sustained break above that region could expose 4,380–4,390.
Key Institutional Zones
Immediate Resistance
4,300–4,310 (External Liquidity)
Institutional Rebalance
4,220–4,225
OTE Buy Zone
0.618 Fibonacci
4,185–4,200
Bullish Objective
4,380+
Trading Scenarios
Bullish Scenario (Preferred)
Allow price to retrace into the Institutional Rebalance / OTE region. If buyers defend the imbalance and bullish confirmation appears, continuation toward 4,300 followed by 4,380 becomes increasingly probable.
Alternative Scenario
If price closes decisively below the OTE zone, the market may extend into a deeper discount before buyers regain control. Until then, the broader H1 trend remains bullish.
Final Thought
Most retail traders focus on buying breakouts. Institutions often accumulate during controlled pullbacks into inefficiencies.
The better question isn't whether Gold is bullish—it's where Smart Money intends to reload.
What do you expect first: another rally to 4,380 or a deeper liquidity sweep before continuation? Long 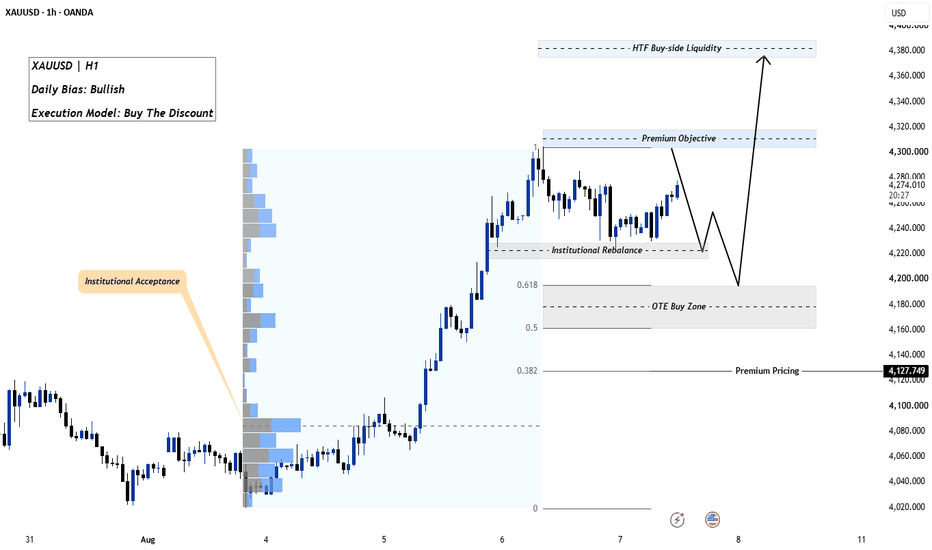
Long 
 Long
Long
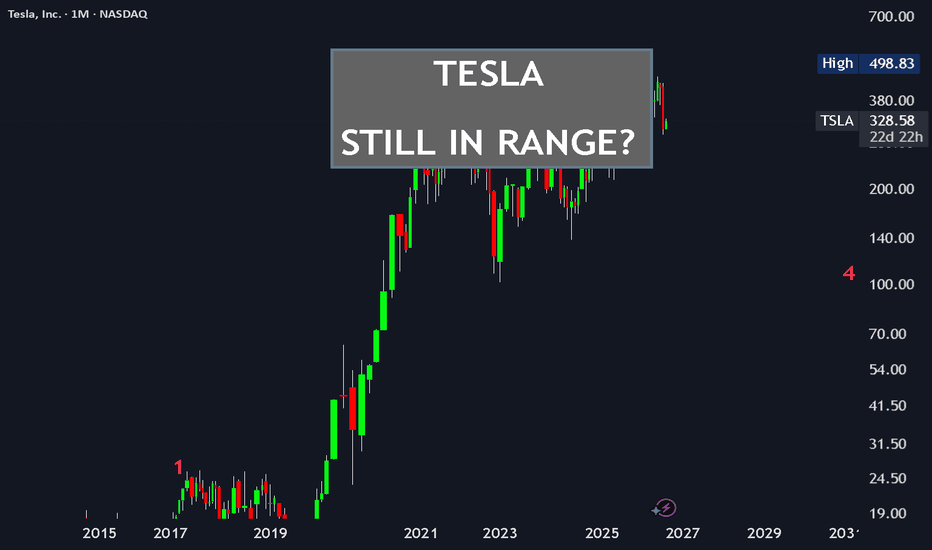
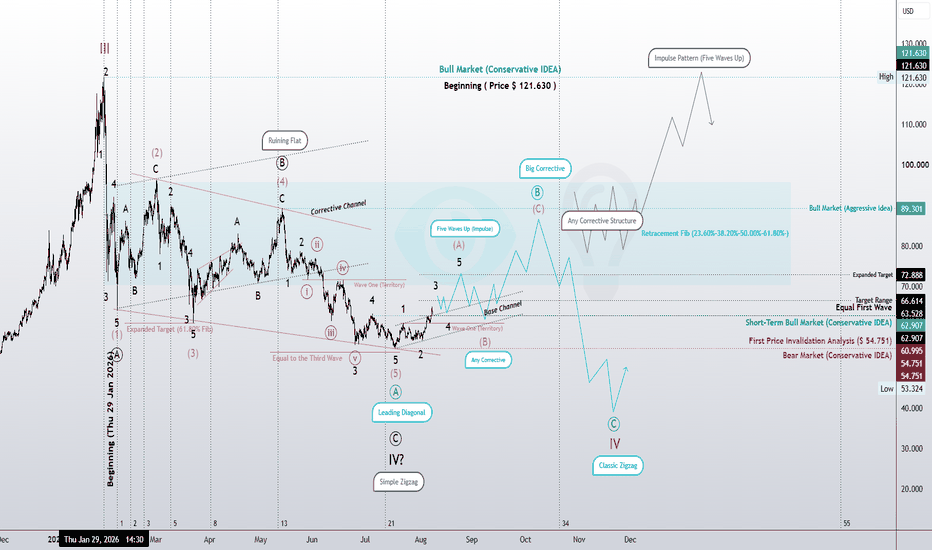
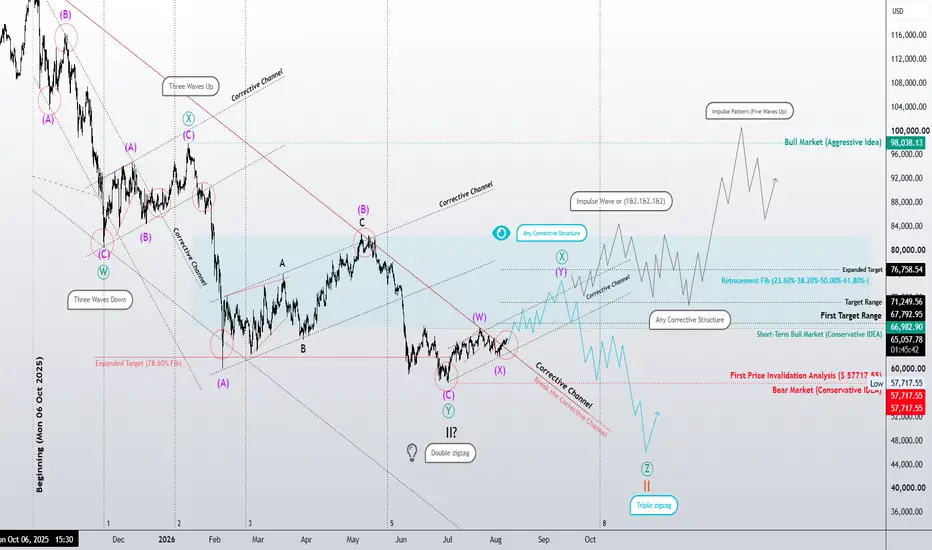
₿ Bitcoin | The Structure Must ConfirmConservative Scenario — Wave (II) Complete or Correction Still Developing?
In the Conservative Scenario, the current structure may indicate that a Double Zigzag has been completed and Wave (II) may have ended. However, this count still requires confirmation through price action and wave structure.
To confirm the completion of Wave (II), we would expect the market to develop impulsive price action—preferably a valid Impulse pattern, or structures such as a Leading Diagonal or nested 1–2 and 1–2 sequences that could signal the beginning of a higher-degree bullish move. The way the subsequent correction develops will also be important, as it should remain structurally consistent with the preceding impulsive move.
On the other hand, the Aggressive Scenario still interprets the current move as a corrective structure for the next Wave X. If this move fails to demonstrate impulsive characteristics and instead remains corrective, the probability of a larger ongoing correction increases.
So far, the larger corrective structure contains seven swings and remains consistent with a Double Zigzag. Therefore, we cannot confidently declare the correction complete yet. If the corrective character continues, the structure could become more complex and potentially develop into a Triple Zigzag with 11 swings.
For now, any corrective structure remains possible, and we should allow price action to reveal the character of the next move.
If the market develops a strong Impulse, Leading Diagonal, or nested 1–2 structures, followed by appropriate corrective retracements, the Conservative Scenario would gain significantly more validity. This would increase the probability that Wave (II) has completed and that a new bullish cycle is beginning.
However, if the current move remains corrective, the Aggressive Scenario remains valid, and the market could complete another Wave X before developing another corrective leg to complete the larger structure.
At this stage, we are not predicting the end of the correction; we are waiting for the structure and price action to confirm it.
— Mr. Nobody
Independent Elliott Wave Principle Researcher
“Patterns whisper. I listen.” 📊🎧
Bitcoin
Jul 25
Bitcoin: Wave (V) Begins or a Larger Zigzag Continues? | Elliott
BTC 4H Bearish Setup: Target 61.3k and 59kSince rebounding from 57k, Bitcoin has continued to push higher, yet it still presents a potentially bearish outlook. If price breaks down through the 4H trendline, this could be interpreted as the setup for a Dragon Pattern. The key area to watch is the current high-value zone between 65k and 67k, which is highly likely to act as short-term resistance once again.
Here are four possible scenarios:
1. Price loses momentum directly within this high zone.
2. Price makes a higher high, but the first breakout turns out to be false.
3. Price fails to make a higher high and revisits the lower zone.
4. Price breaks higher and accelerates upward.
Scenario 4 is excluded for now. Scenarios 1–3 all imply short-biased opportunities. From a technical perspective, the confluence of the 0.786 Fibonacci retracement, VAL, and FVG aligns with the first target of the Dragon Pattern. Although the Elliott Wave count is omitted here, the appearance of a second action wave within a corrective structure would not be inconsistent.
However, even if price rejects downward, whether it breaks below the lower zone is a separate question. Therefore, the trade plan suggested here focuses on capturing the retracement. The 61.3k level and the upper 51k region serve as potential reference points.
Trading is always based on hypothetical scenarios. If the assumptions behind your setup are invalidated, your plan must be revised immediately in accordance with proper risk management. Short 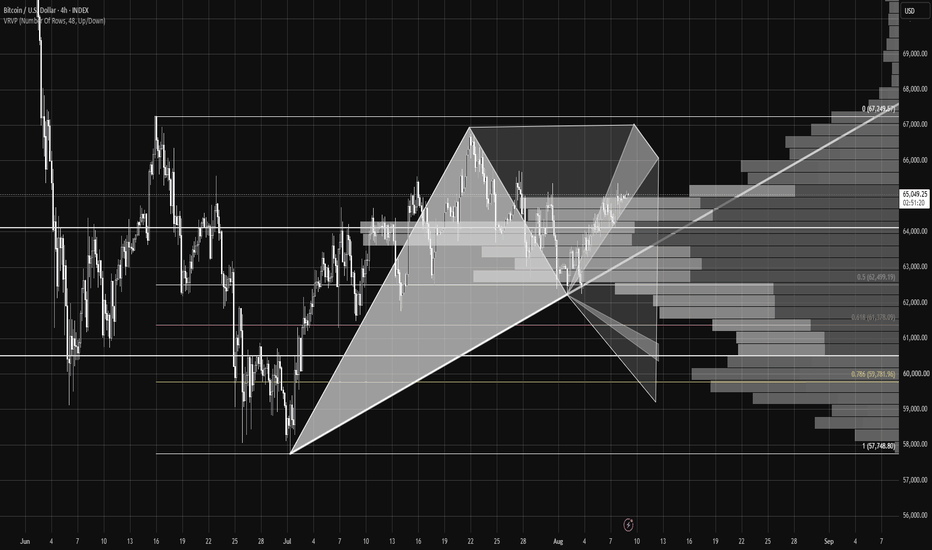
##Leading Diagonal Completed | What Is Silver Telling Us Next?# Silver | U.S. Dollar — XAGUSD
Following the previous analysis, the price structure has now provided us with stronger evidence.
The **Leading Diagonal** that we previously considered as one of the primary aggressive scenarios has now completed with a valid **5-3-5-3-5 structure**, remaining consistent with the rules and guidelines of the Elliott Wave Principle.
Therefore, the possibility of facing a **larger correction** from this area has become increasingly important.
The current price action may represent the first step in the development of this correction. However, one fundamental question remains:
**Is this movement the beginning of a three-wave corrective structure, or the first piece of a new motive pattern?**
If the current movement eventually develops into an **Impulse**, we would expect a corrective movement after its completion. Then, with full respect for the **initial invalidation price**, if another wave develops to the downside, the structure could evolve into a complete **Zigzag**.
At the same time, we will not disregard the possibility of a more complex corrective pattern developing on a lower degree. At this stage, the structure still needs to reveal itself.
However, the bullish scenario remains on the table.
One important possibility is that the recent **Wave B was a Running Flat**, which may have acted as the connector and completed the **Zigzag structure of the larger-degree Wave IV**.
In that case, a **break above the Wave B high of this Zigzag within the Wave IV degree** could provide significantly stronger evidence in favor of the bullish scenario.
Nevertheless, for this interpretation to gain further credibility, the market would need to advance far enough to demonstrate a **valid motive structure**, rather than simply producing another three-wave movement.
So, for now, our main question is simple:
**Will the next pieces of the puzzle arrange themselves into a three-wave structure, or is the market beginning to carve out a new motive pattern?**
For now, we do not know the answer.
And this is precisely where the Elliott Wave Principle becomes meaningful to us.
Rana and I are following this structure not by trying to predict the next move, but by studying the relationships between **price, time, structure, and the rules and guidelines of Elliott Wave**.
Every new movement is another piece of the puzzle.
We simply have to learn how to listen carefully to what the market is telling us.
**The Elliott Wave Principle is the language of the market; and structures reveal the social nature of human behavior through price.**
The pieces of this puzzle are being carved into the chart one by one;
and as the structure becomes clearer, the voice of the market becomes easier to hear.
This is not a prediction.
This is the study of structure.
**Price is the outcome. Structure is the cause.**
**Patterns whisper. We listen.**
— **Mr. Nobody 🎧📊**
Silver / U.S. Dollar
Jul 24
Leading Diagonal or a Larger Double Zigzag? Elliott Wave Scenari
 Long
Long