Bitcoin (Macro) Elliott Wave Theory Analysis.Good afternoon peoples;
Thought I'd share my macro outlook on Bitcoin with you all.
This particular count has been one of the biggest challenges I've ever faced in these markets, but after a few years of experience - I feel I've finally tackled it.
-----
To keep things real simple, the chart says it all.
I think we're going to see 22k by around July,
after which btc will run to 126k.
126k will mark a significant cycle top, and a very large correction will take place after (which could last a
Elliott Wave
es1! retests 5kes1! appears poised for a larger move down, based on the smaller timeframe count .
this leads me to believe that es1! has entered a larger fourth wave. historically, these waves take an average of 2 months to play out and typically result in a 12% decrease from the high before completing.
wave 4's often retrace back into the territory of the prior degree's wave 4, and i expect this one to follow suit.
pay attention to the green trendline i've drawn on the chart,,, it serves as a solid
Coinbase - One more low to $120's seems most likelyMany of the tickers that I cover have been in a corrective phase for quite some time now. Coinbase for example, has been in one for over a year now. Although the larger pattern is not even halfway done, this part of the move lower is rapidly approaching a conclusion IMO. I say rapidly a little loosely. I don't want you to interpret that as in a couple days. I just mean that the move lower that has lasted over a year now should be over within the next month or two at the most IMO. Could it last l
Corrective price action higher for US500Price action between 7624.6 and 7229.3 was a choppy mess, with three diagonals per this interpretation.
I think the key area, though, is what's encircled in the red ellipse. Bulls need that to be an impulse C to complete an expanded flat, and I just don't see how to make it a diagonal. There is a diagonal in it, but it's a diagonal A of an ABC zigzag.
If the price action in red is not a C wave, then the entire structure encircled in the green ellipse is corrective, not impulsive, and that impl
Apple Stock Analysis: Is AAPL Entering a Multi-Year Range?Apple Stock Analysis: Is AAPL Entering a Multi-Year Range?
Apple remains one of the strongest long-term charts in the market.
The stock has been rising inside a major ascending channel for many years, and the bigger trend is still intact.
But from a technical point of view, the structure is becoming more mature.
That does not automatically mean a bearish reversal, but it does increase the probability that Apple may be moving closer to a long sideways phase rather than another period of clea
Dow Jones | Is the Fifth Wave Expanding?Wave (IV) in pink, the highest degree of this structure, ended in March 2009. From that point, the market entered a structure that may be the beginning of Wave (V) of the highest degree.
In equities, an extended fifth wave is also possible. So the key question is this:
We were looking for an Impulse pattern, where V? in turquoise was expected to mark the end of the structure. But what does the equality with the initial wave tell us?
Are we dealing with an extended fifth wave, or is the curren
Corrective Waves – Zigzag, Flat, Triangle & CombinationThe attached image summarize the four major corrective wave families in Elliott Wave Theory: Zigzag, Flat, Triangle, and Combination.
Zigzag: Includes Single, Double, and Triple Zigzags. A Single Zigzag has a 5-3-5 structure, while Double and Triple Zigzags connect multiple Zigzags through X waves. Zigzags commonly appear in Wave-2, Wave-4, Wave-B, and other corrective positions.
Flat: Includes Regular, Expanded, and Running Flats, all based on a 3-3-5 structure. Flats can occur in Wave-2, Wav
Motive Waves – Impulse and Diagonal PatternsThe attached chart summarizes the three major Motive Wave patterns in Elliott Wave Theory: Impulse, Contracting Diagonal, and Expanding Diagonal.
Impulse: Consists of five waves—1-2-3-4-5—and generally moves in the direction of the larger trend. It can occur as Wave-1, Wave-3, Wave-5, Wave-A of a Zigzag, and Wave-C of a Zigzag or Flat. Wave-1 and Wave-5 may also show alternation in their structure.
Contracting Diagonal: A five-wave motive pattern, normally subdividing 3-3-3-3-3, and can appear
Elliott Wave TheoryElliott Wave Theory is a form of technical analysis that studies market price movements through recurring wave patterns driven by investor psychology. It is broadly divided into two major categories: Motive Waves and Corrective Waves.
Motive Waves move in the direction of the larger trend and consist mainly of Impulse and Diagonal patterns.
Corrective Waves move against the larger trend and consist of Zigzags, Flats, Triangles, and Combinations.
Using the classification discussed above, Elliot
Upside for BitcoinHi traders,
Last week Bitcoin broke and and closed above the bearish Daily FVG.
So we could see some more upside now to the bearish Weekly BPR.
Let's see what the market does and react.
Trade idea: Wait for a small correction down and a bullish change in orderflow on a lower timeframe to trade longs.
This shared post is only my point of view on what could be the next move in this pair based on my technical analysis.
But I react and trade on what I see in the chart, not what I've predicted o
Upside for goldHi traders,
Last week gold finished the WXY-correction with a Triangle.
After that it went up very impulsive.
This could be the first impulsive move of a longer term bullish trend.
Let's see what price does and react.
Trade idea: Wait for a small correction down and a change in orderflow to bullish on a lower timeframe, to trade longs.
This shared post is only my point of view on what could be the next move in this pair based on my technical analysis.
But I react and trade on what I see in
Bullish for S&P500Hi traders,
Last week S&P500 went up very impulsive which invalidated the Triangle pattern.
It looks like wave 4 was a running Flat and price is now in (red) wave 5. So we could see more upside.
Let's see what the market does and react.
Trade idea: Wait for a correction down and a bullish change in orderflow on a lower timeframe to trade longs.
This shared post is only my point of view on what could be the next move in this pair based on my technical analysis.
But I react and trade on what
Decision time for EUHi traders,
Last week EU went up very slowly and filled the bearish Daily FVG.
So next week is decision time for EU. This will be the last chance to go down for this pair.
If it breaks and stays above the bearish Daily FVG, the bigger trend could be changed to bullish.
Let's see what the market does and react.
Trade idea: Wait for an impulsive move down, a correction up and a change in orderflow to bearish on a lower timeframe for shorts.
This shared post is only my point of view on what co
Gold H1: Bull Trap or Reload Long?
Gold remains supported by expectations that the Federal Reserve could begin easing policy later this year, while investors continue monitoring upcoming US inflation data and Fed speakers for confirmation of the rate outlook. A softer US Dollar and declining Treasury yields continue to provide a supportive backdrop for bullion, although short-term profit-taking is emerging after this week's aggressive rally.
Many retail traders may interpret this consolidation as the beginning of a bearish reve
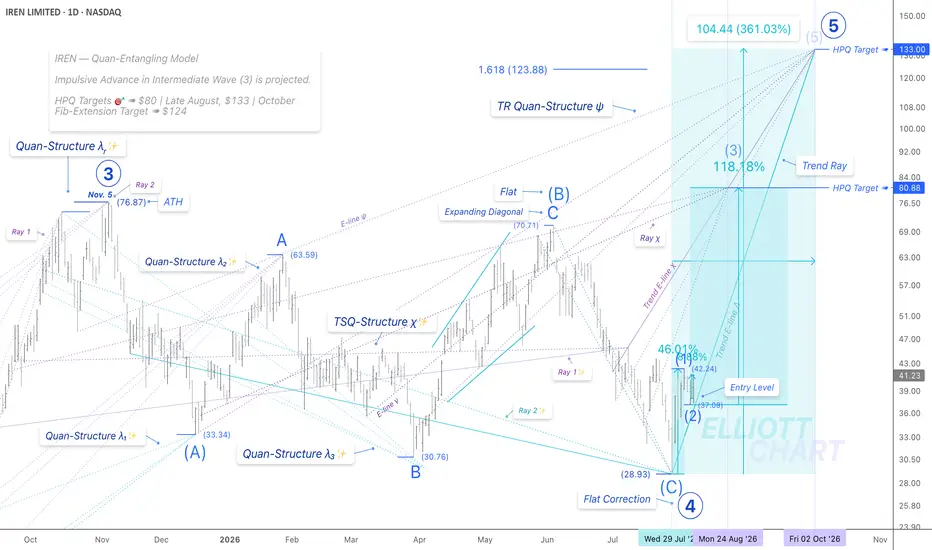
IREN | DailyNASDAQ:IREN — Quan-Entangling Model
Quan-Analysis | Impulsive Advance in Int Wave (3) Initiated 📈
IREN surged 8.88 %💫 intraday, initiating the projected advance in Intermediate Wave (3).
The corrective Intermediate Wave (2) may have ended at $37.08, identified as the projected entry level—very close to the illustrated Trend-Support E-line Δ, which was anchored through the defined HPQ Target ➤ $133 .
Within the Quan-Entangling Model, this reflects one way in which projected HPQ Targets bec
Tesla Technical Analysis: TSLA Contracting Triangle and Key LeveTesla technical analysis of the monthly and weekly TSLA chart using Elliott Wave and Volume Profile.
My current working scenario is a fourth-wave Contracting Triangle, with lower highs and higher lows gradually compressing the range. I look at the possible path toward $200, a rebound toward the $400-$420 area, another pullback around $250, and the conditions that could eventually lead to a break above $500.
The larger TSLA range I am watching is roughly between $100 and $500. A sustained move
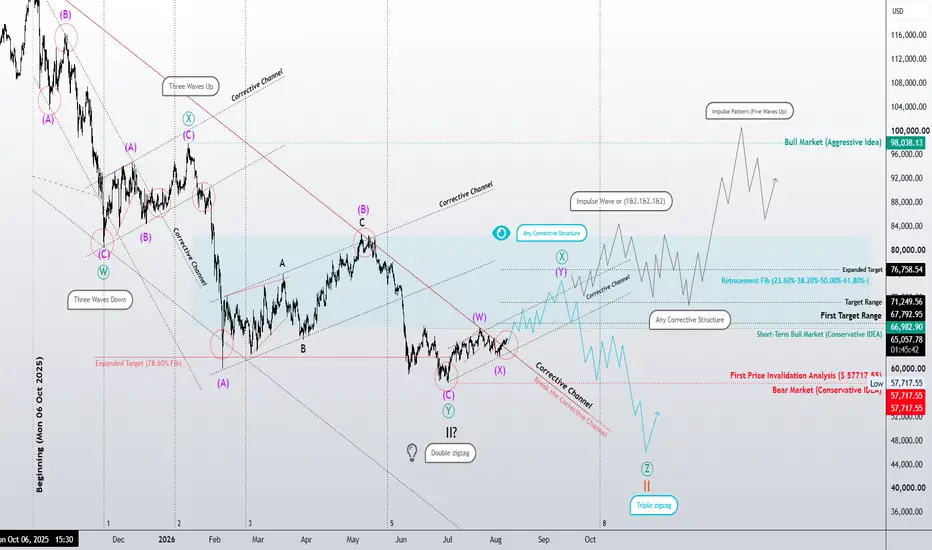
₿ Bitcoin | The Structure Must ConfirmConservative Scenario — Wave (II) Complete or Correction Still Developing?
In the Conservative Scenario, the current structure may indicate that a Double Zigzag has been completed and Wave (II) may have ended. However, this count still requires confirmation through price action and wave structure.
To confirm the completion of Wave (II), we would expect the market to develop impulsive price action—preferably a valid Impulse pattern, or structures such as a Leading Diagonal or nested 1–2 and 1–2
BTC 4H Bearish Setup: Target 61.3k and 59kSince rebounding from 57k, Bitcoin has continued to push higher, yet it still presents a potentially bearish outlook. If price breaks down through the 4H trendline, this could be interpreted as the setup for a Dragon Pattern. The key area to watch is the current high-value zone between 65k and 67k, which is highly likely to act as short-term resistance once again.
Here are four possible scenarios:
1. Price loses momentum directly within this high zone.
2. Price makes a higher high, but the fi
##Leading Diagonal Completed | What Is Silver Telling Us Next?# Silver | U.S. Dollar — XAGUSD
Following the previous analysis, the price structure has now provided us with stronger evidence.
The **Leading Diagonal** that we previously considered as one of the primary aggressive scenarios has now completed with a valid **5-3-5-3-5 structure**, remaining consistent with the rules and guidelines of the Elliott Wave Principle.
Therefore, the possibility of facing a **larger correction** from this area has become increasingly important.
The current price ac
XAUUSD: Bullish Wave 5 Targets HigherGold is showing a clear bullish recovery after breaking away from the lower accumulation base. From Kelly’s view, the current structure suggests that XAUUSD is no longer only moving sideways; buyers are trying to build a larger Elliott Wave continuation towards the upper Fibonacci target.
The key idea is simple: gold remains bullish, but after a strong push, the better setup is to wait for a controlled pullback before following the next upside wave.
⟡ Market structure
The chart shows gold pre