• Products
  • Community
  • Markets
  • Brokers
  • More
Get started
  • Markets
  • /Sweden
  • /Stocks
  • /Ideas
Electrolux bullish haramiSeeing a bullish harami in the monthly chart is technically an interesting signal, especially in light of the major transformation the Electrolux Group is undergoing according to its 2025 annual report. 1. What does the pattern signal? A bullish harami consists of a large red candle followed by a smaller green candle that is fully contained within the body of the previous one. • Psychology: This suggests that selling pressure has weakened and that a potential trend reversal may be approaching
OMXSTO:ELUX_BLong
by alex165754
Niche microwave company to an AI-critical Indium Phosphide (InP)A major LiDAR customer will begin production ramps in Q4 2026. This is the most tangible catalyst. If this ramp happens on time and at the projected scale ($28M–$53M cumulative), the market will likely rerate the stock in anticipation during mid-to-late 2026. Despite high growth (25%–33% YoY), Sivers is still burning cash. A rerating often occurs 1–2 quarters before a company proves it is "self-funding." With current cash levels around SEK 43M, the market is cautious about dilution; March 2026
OMXSTO:SIVE
by PoPnoStyle
Updated
2
BULL SBB - 5.5 SEK TargetSBB is right now pending at 3.5 SEK and this seems like the bottom, next target is 5.5 SEK. A 57% profit possibility here.
OMXSTO:SBB_BLong
by dayg63
BULL Essity - 310 SEK TargetEssity is right now pending at 248 SEK and this seems like the bottom here for a while. Next target for Essity is 310 sek, a 25% profit possibility here.
OMXSTO:ESSITY_BLong
by dayg63
BULL Hexagon - 120 SEK TargetHexagon is right now pending at 96 SEK and this seems like the bottom. The next target is 120 SEK, a 25% profit possibility here. There is a possibility Hexagon might go down to 85 SEK but it wont last for a long time. So here on 96 or 85 SEK would be a perfect timing to buy Hexagon shares and sell at 120 SEK with a great profit.
OMXSTO:HEXA_BLong
by dayg63
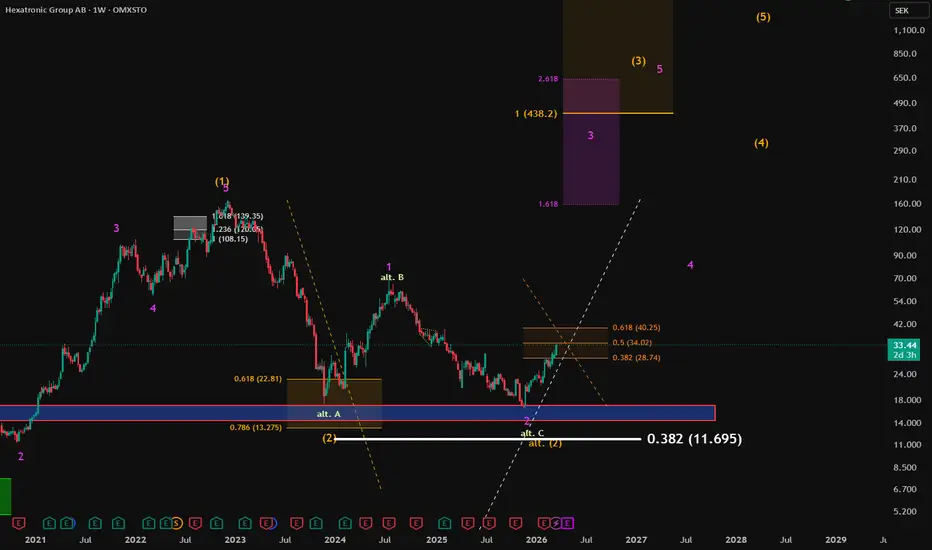
Update HexatronicOne of Swedens most shorted stocks is performing really well and still follows my idea of a potentially bullish continuation. We have reached a price range where it will be decided whether or not we continue upwards. There´s a high likelihood of the price retracing from the 50% or 61.8% retracement (orange color). We will have to observe if it is a bearish or bullish move down when it happens. As of now the current move up looks very bullish!
OMXSTO:HTROLong
by Staggi10
Bear Tele2 - 100 SEK TargetTele2 is right now pending at 193 SEK and looks like this is the top. Next price target is 100 SEK. So selling here and buying again at 100 SEK would be a good idea.
OMXSTO:TEL2_BShort
by dayg63
Bear Ericsson - 50 SEK targetEricsson is pending right now at 110 SEK, here or possibly 120 SEK is the top for Ericsson. Here or 120 level is perfect timing to sell all your Ericsson shares and wait for the price to drop to 50 SEK and buy more at that price target. So it is optimal to sell all your shares here.
OMXSTO:ERIC_BShort
by dayg63
1
Bull EQT 330 SEK Price TargetThe price of EQT is pending right now at 271 SEK and this seems like the bottom here for a while. Next target is around 330 SEK, a 22% profit possibility here.
OMXSTO:EQTLong
by dayg63
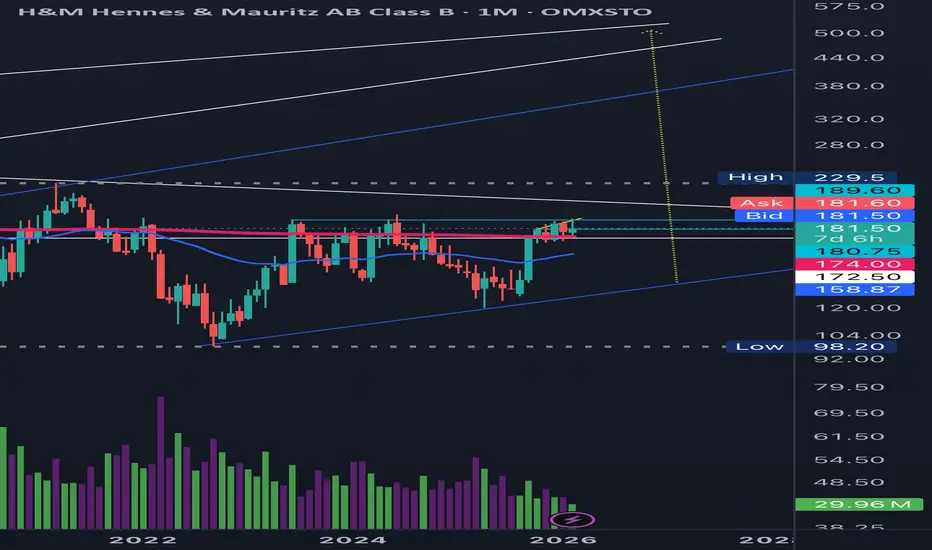
HMB up Either we get a movement up to 200 and then going down to 140 or we going from this level up to 280 and then download a little bit but as I said, it is gonna go very far up
OMXSTO:HM_BLong
by SMARTBMONEY
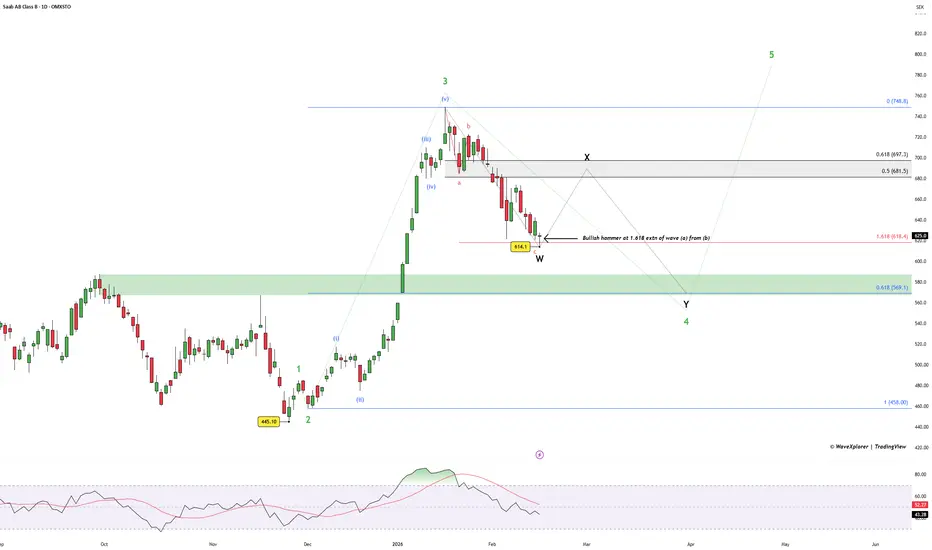
Saab AB: Defence Giant Pauses — Opportunity in Disguise?Technical Analysis From the lows at 445.10, Saab AB advanced in a strong impulsive structure forming a 1-2, 1-2 setup and extending into a powerful higher degree Wave 3, topping near 748.8. Post that high, price has corrected in what appears to be an ABC zigzag, with Wave C reaching the 1.618 Fibonacci extension of Wave A from B near 641. A bullish hammer has formed at this zone, hinting at a potential short-term reversal. If 641 holds, we may see an X connector rally toward the 0.5–0.618
OMXSTO:SAAB_BLong
by WaveXplorer
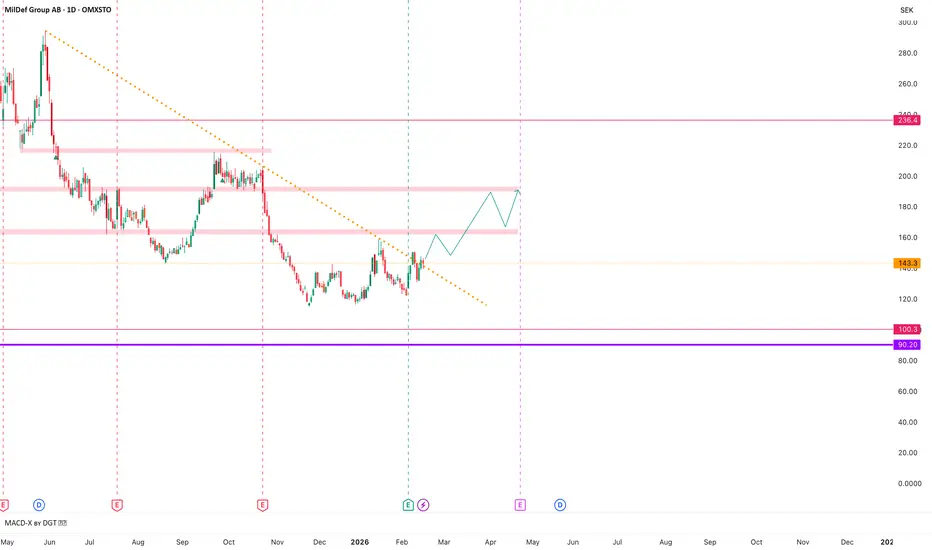
MILDEF - ConsolitdationMILDEF has reached the trend line but is unable to break through it definitively. This indicates very strong short pressure on the stock. In normal price movements, a sharp break from this trend line is expected, but MILDEF does not have the strength to do so. It will continue its sideways movement. The best possible movement is shown on the chart.
OMXSTO:MILDEFLong
by EmreSrn
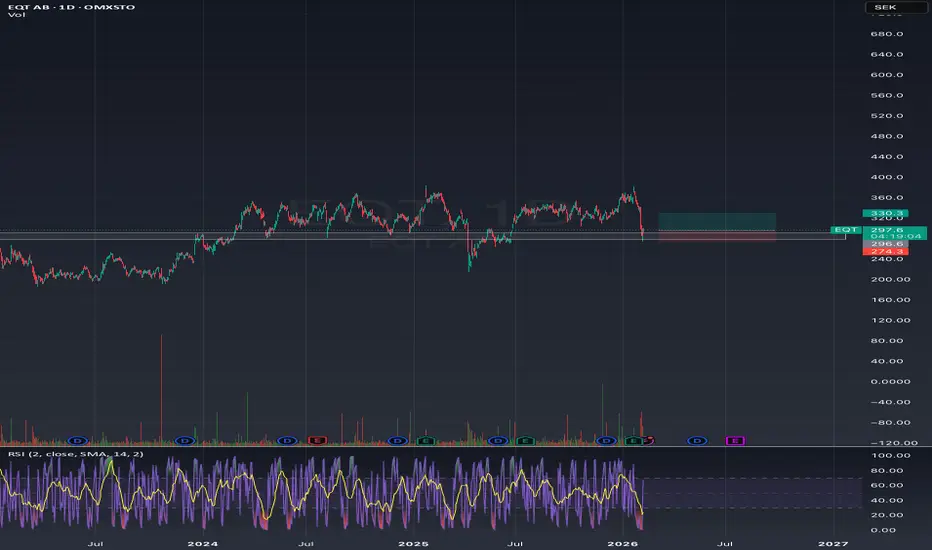
EQT verkar hitta stödA small but fun trade. EQT sold off quite substantially a while ago but seems to have found support at previously familiar levels. RSI seems to be reversing upwards. Let's see how it plays out.
OMXSTO:EQTLong
by Erikramberg
Dometic Group AB (DOM)"DOM.ST: A classic turnaround play at the bottom of the demand cycle; while current growth and ROE miss 'Predator' benchmarks, the 50%+ DCF upside and heavy insider conviction suggest a major re-rating as the recovery begins."
OMXSTO:DOMLong
by SimeonNikolaev-invest
Looks like Cibus wants to grab some liquidity...If we look at the chart, there's some indication that cibus wants to grab some liquidity and then move upwards towards the weekly FVG.
OMXSTO:CIBUSLong
by Bjorsa
District Metals - Bullish outlook for the Uranium StockDistrict Metals (DMX): A Sweden-Focused Metals Story With a Regulatory Catalyst District Metals is a Canada-listed exploration and development company with a strong focus on Sweden. The company is positioned around two key themes: polymetallic base and precious metals in historically productive mining districts, and long-dated optionality tied to energy and critical metals. One of the company’s core assets is the Tomtebo project in the Bergslagen mining district. Bergslagen is one of Europe’s
OMXSTO:DMXSE_SDBLong
by Mr_Anonymous_Investor
Updated
4
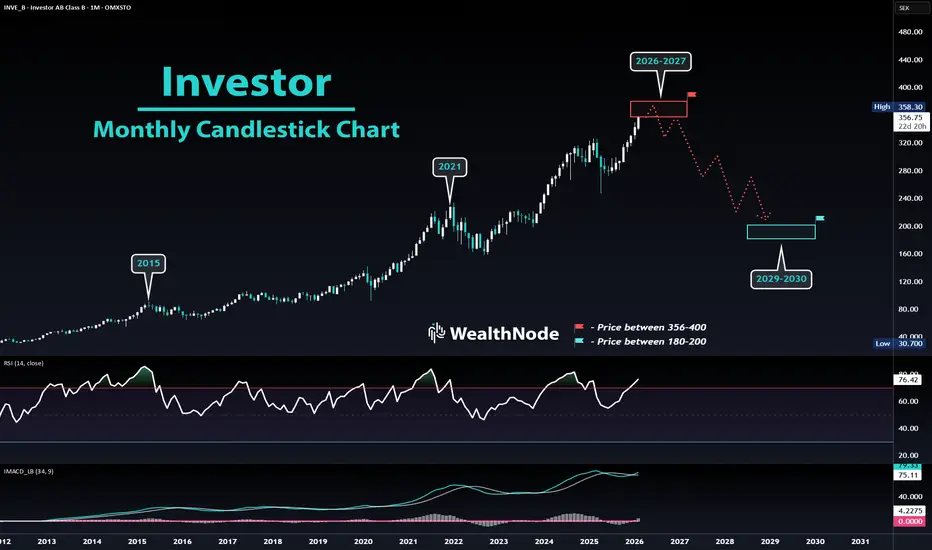
Investor - Price target - Incoming CrashThis is my price target for the stock Investor, Exact price movement is impossible to predict but I expect to see a price drop of around 40%+ from current levels. We have now reached the target i set out 4 years ago at 356 based on fib extensions. We will most likely bounce around here and search us up higher before a breakdown, Reasoning for Investor to have such a aggressive decline is due to the 18.6 year real estate and economic cycle that is most likely ending this year, which will take s
OMXSTO:INVE_BShort
by BlueprintMacro
1
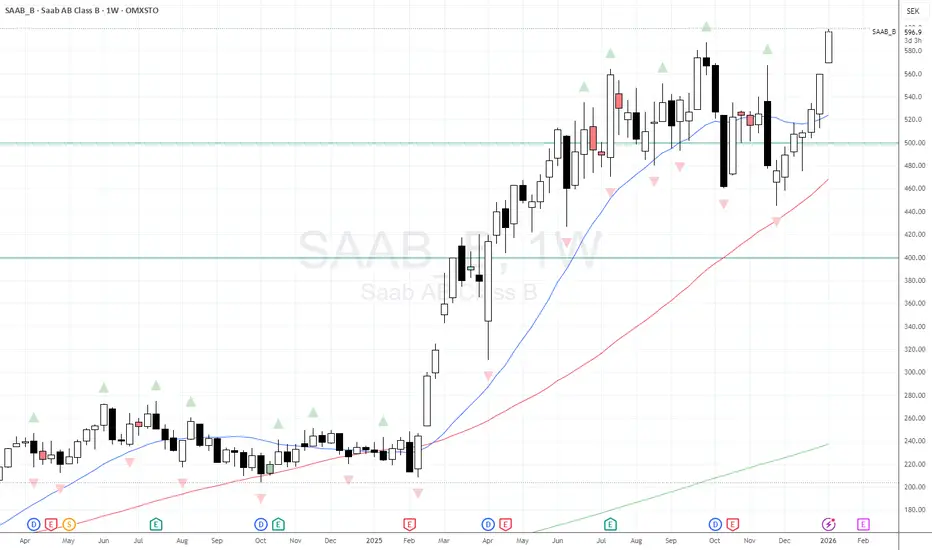
SAAB continues to rally off European Defence fears.A snippet from ForexTraderPaul's YT Channel Monday Market Update #211: Greenland is cold whilst Defence Stocks are hot. Back in Nov/Dec of last year price across many European defence companies had fallen back towards the weekly 50MA (red MA on my chart) on the back of rumours of a Ukrainian Peace deal. My view was that if there was a deal then the support from the 50MA would likely crack and prices would fall quickly. Well, clearly there was no deal, and in fact we've gone the other way in 20
OMXSTO:SAAB_BLong
by FXTraderPaul
SAAB breaks to new highs off the back of geo-political events.We saw a range of Defence companies on both sides of the Atlantic have anew year bump following the events in Venezuela. Interestingly it was SAAB making the biggest moves on this side of the Atlantic yesterday. Why would that be? Is it because people see Trumps moves as in indication that a) he's more interested elsewhere than Europe and b) that means the Europeans will have to spend more on their own defence? It could be both (though I am remain unconvinced that Europe will pay/do what it ne
OMXSTO:SAAB_BLong
by FXTraderPaul
Nobia AB - Sweden - December 2025On the above 2 month chart: 1. Price action is on legacy support 2. Price action prints with high positive divergence. 3. Price action prints and RSI resistance breakouts 4. Market structure resistance is 500% above. How's that for simple? Good luck! Ww Disclaimer ======================================================= This is not financial advice. Nor should it be mistaken for prophecy.
If you invest based on the opinions of strangers on the internet, then what you’re trading isn’
OMXSTO:NOBILong
by without_worries
ABB📊 ABB Ltd (OMXSTO) – Technical Analysis 🔹 Overall Trend • The long-term trend is bullish. • Price is moving inside an ascending channel. • Higher highs and higher lows are still intact. ⸻ 🔹 Moving Averages (EMA) • EMA 9: Short-term momentum, price is currently testing it. • EMA 50: Acting as dynamic support. • EMA 200: Well below price → confirms strong long-term uptrend. As long as price stays above EMA 50 & EMA 200, the bullish structure remains valid. ⸻ 🔹 Fibonacci Levels (Key Zon
OMXSTO:ABBLong
by SchaltPro
1
Bullish 2From the chart, it can be seen that the price has been moving within the blue channel. Each time the price has touched the upper or lower line of the channel, it has reacted with a move either upward or downward. As shown, this has happened five times before, so there is a high probability that the price will react again this time and move upward to some extent.
OMXSTO:EVOLong
by tradingwizard999
#Truecaller 100% profit !!!!Truecaller AB reports 9% revenue growth 📈 to 506 million SEK and a net profit of 118 million SEK 💰. The “For Business” segment rises 53% 🚀, and premium subscribers 48% 🌟. Analysts forecast 17% annual growth 📊 and a target price of 60 SEK — investors could achieve nearly 100% profit 💵. #Truecaller #StockMarket #Investing #Growth #TechStocks
OMXSTO:TRUE_BLong
by SomeOne-LikeYou
1
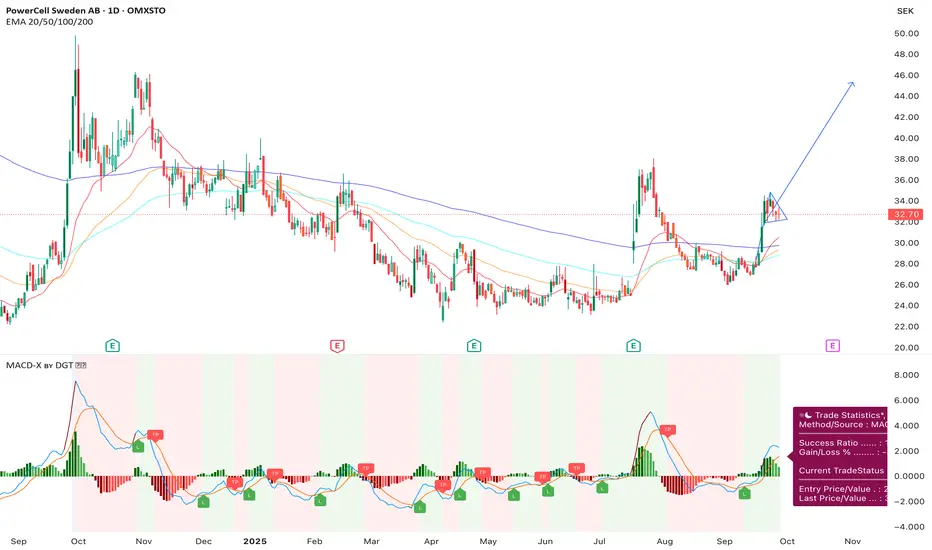
PCELL - Flama formationPCELL has a very strong formation. BUY: 32 TP1: 36 TP2: 45 SL: 28
OMXSTO:PCELLLong
by EmreSrn
Updated
2
1234567891011121314151617181920212223242526272829303132333435363738394041
…999

Made by humans

Select market data provided by ICE Data Services. Select reference data provided by FactSet. Copyright © 2026 FactSet Research Systems Inc.Copyright © 2026, American Bankers Association. CUSIP Database provided by FactSet Research Systems Inc. All rights reserved. SEC filings and other documents provided by Quartr.© 2026 TradingView, Inc.

SOC 2 CompliantGDPR Compliant
More than a product
  • Supercharts
Screeners
  • Stocks
  • ETFs
  • Bonds
  • Crypto coins
  • CEX pairs
  • DEX pairs
  • Pine
Heatmaps
  • Stocks
  • ETFs
  • Crypto coins
Calendars
  • Economic
  • Earnings
  • Dividends
  • IPOs
More products
  • News Flow
  • Portfolios
  • Fundamental Graphs
  • Yield Curves
  • Options
  • Macro Maps
  • Pine Script®
  • MCP Server
Apps
  • Mobile
  • Desktop
Community
  • Social network
  • Wall of Love
  • Refer a friend
  • Creator program
  • House Rules
  • Moderators
Ideas
  • Trading
  • Education
  • Editors' picks
Pine Script
  • Indicators & strategies
  • Wizards
  • Freelancers
  • Marketplace
Tools & subscriptions
  • Features
  • Pricing
  • Market data
  • Gift plans
Trading
  • Overview
  • Brokers
  • Brokers comparison
  • The Leap
Special offers
  • CME Group futures
  • Eurex futures
  • US stocks bundle
About company
  • Who we are
  • Space mission
  • Blog
  • Help Center
  • Careers
  • Media kit
Merch
  • Tarot cards for traders
  • The C63 TradeTime
Policies & security
  • Terms of Use
  • Disclaimer
  • Privacy Policy
  • Cookies Policy
  • Accessibility Statement
  • Trust Center
  • Security tips
  • Bug Bounty program
  • Status page
Business solutions
  • Widgets
  • Charting libraries
  • Lightweight Charts™
  • Advanced Charts
  • Trading Platform
Growth opportunities
  • Advertising
  • Brokerage integration
  • Partner program
  • Education program
Community
  • Social network
  • Wall of Love
  • Refer a friend
  • Creator program
  • House Rules
  • Moderators
Ideas
  • Trading
  • Education
  • Editors' picks
Pine Script
  • Indicators & strategies
  • Wizards
  • Freelancers
  • Marketplace
Business solutions
  • Widgets
  • Charting libraries
  • Lightweight Charts™
  • Advanced Charts
  • Trading Platform
Growth opportunities
  • Advertising
  • Brokerage integration
  • Partner program
  • Education program
Look FirstLook First