ABB looking for buy entryABB is of interest because fundamental analysis says it could reach SEK 244,-
However, at the moment it doesn't seem to have enough power to break through the overhead resistance just yet.
On the 4h chart we have clear divergence between the price action and the RSI, AND we have declining volume. All indicators of a unsustainable trend. In the process it seems to be forming a bearish rising wedge as well.
So price should retest support below (190-193) and fill the gap at 196 in the process.
The
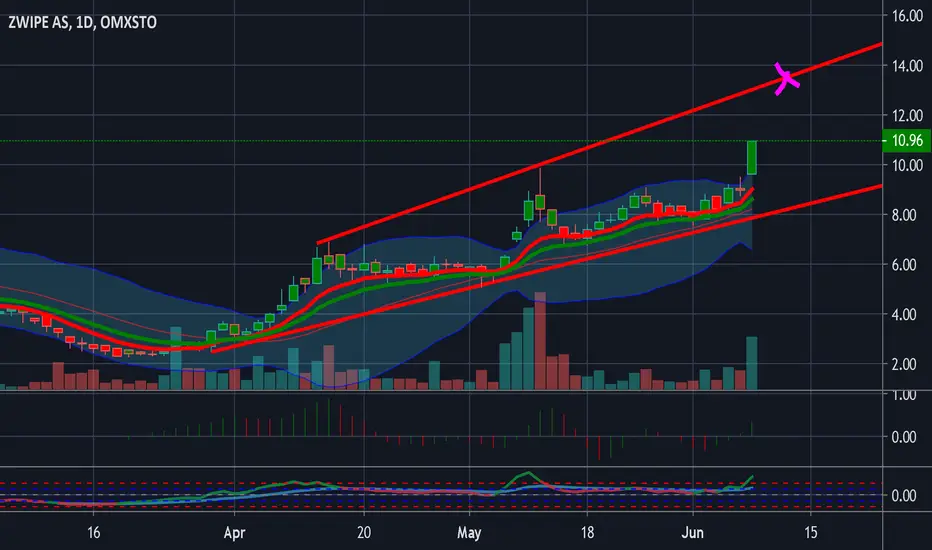
Zwipe bound for impulseThe history of Zwipe in the recent months is basically a cycle of impulse, consolidation and then impulse again. We're now nearing the trend line while also respecting the new support level from the last impulse. If you look at RSI, we're nearing or pretty much exactly at the same levels as when the previous impulses occurred.
I expect the coming week to be very interesting for Zwipe. We might see an impulse to 14 SEK, which hopefully means our next support is at least over 10 SEK. Time will te
Z
ATORX buy?Looking at the overall picture there is plenty to be excited about;
- Fundamentals give a target of SEK 24.
- There is a huge gap overhead from roughly 15 to 24.60.
- We found clear support on the 9.4-9.8 area.
However we've just arrived at a pretty significant area of resistance. Both a horizontal support/resistance area and the 50MA.
So ideally I want both these turned into support before looking for a (additional) buy entry.
When to buy VICO.I'm going to look at VICO with a bullish bias because of the fundamentals that give a target of SEK 41,-.
So let's start with the weekly chart on the right:
For a bullish scenario the support of 14.30-14.90 needs to hold.
We just got rejected by the cloud, but if we can find meaningful support the weekly cloud is getting very thin up ahead, so will be easier to break through.
Also from a weekly perspective, the horizontal resistance of around 16.00 needs to be turned into support. That will als
What's ONCO's story at the moment?'When in doubt, zoom out'. As ONCO is confusing me somewhat with mixed signals, I decided to take a look at the weekly chart only for now.
So we are inside a descending triangle. Which got broken to the downside during the 'covid crash', but the price recovered nicely back into it.
Long story short, we should wait until the price breaks up or down from this triangle before any real clarity on direction is there.
LONG argument:
- After a fake breakout of a pattern, often the actual breakout wil
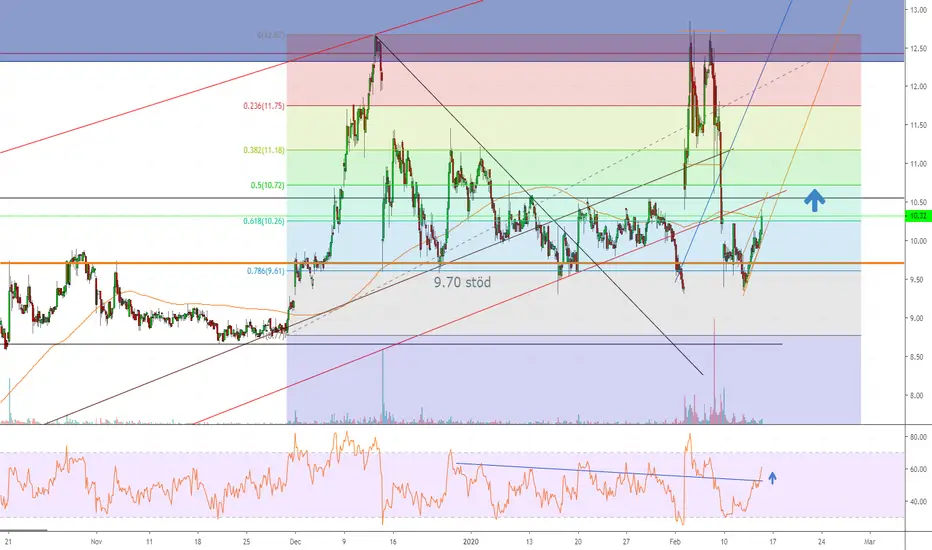
$ZWIPECouldnt take out yeasterdays high 12.18, now test 10.8 support level.
If brake will test 9 ( scenario 1, i think most likely)
If not will test 12.18
Z
LLong
ABB buying opportunityAs analysts are giving ABB a target of around 240, I am looking for a buying opportunity.
At the moment ABB might be rejected at the current resistance area around 202-206. This resistance also represents the 0.618 fib retrace of the 'corona dump'. The trendline (blue) is still holding, but if it breaks a retrace is to be expected.
THEN I'll be looking at a buying opportunity around 190-192.5 as there is a confluence of support there; the upward trendline (blue), horizontal support (purple/gray
BIOA worryI'm a bit worried about the recent uptrend of Bioartic holding or not.
If we look at the last 'mini' structure, it has broken support and restested that support and got rejected. That puts the blue trendline in danger of breaking.
However there is ample support just below at around 70 and again around 65. Perhaps additional buying opportunities will present itself there. Note the gap at 66.75
So for now hold and look for additional buying opportunities. Target of 86 still in play.
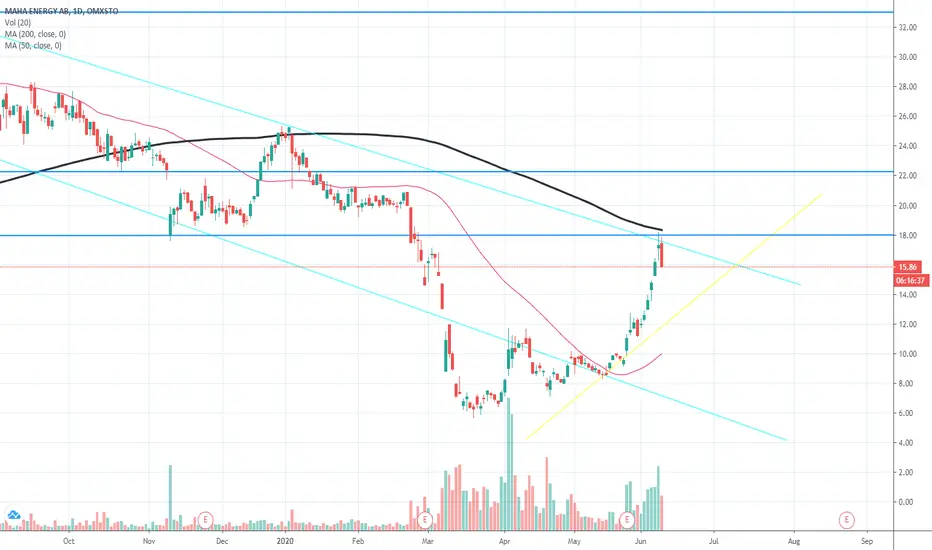
MAHA AB - TAEnd of a falling triangle with possible breakthrough to following resistance at 22 and so on. 50 MA and 200 MA followed for potential golden cross
MShort
Z