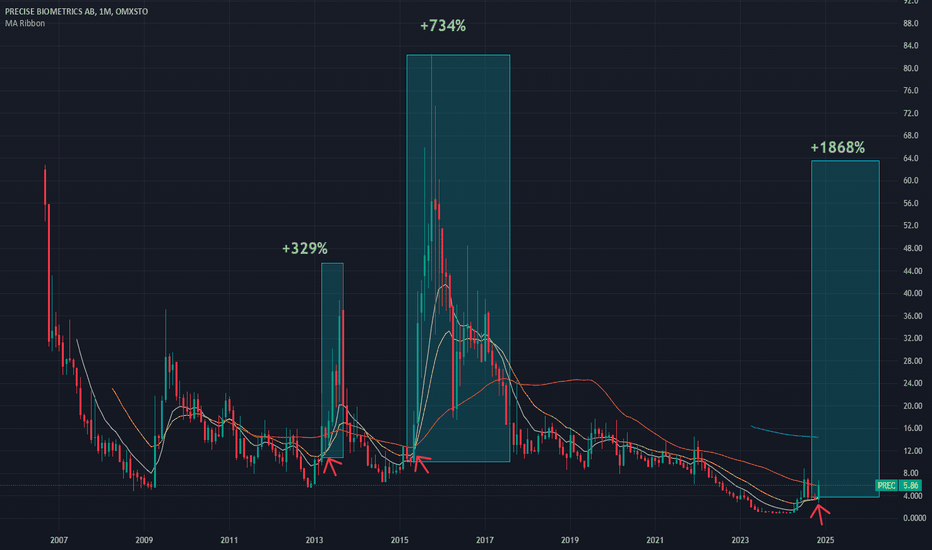
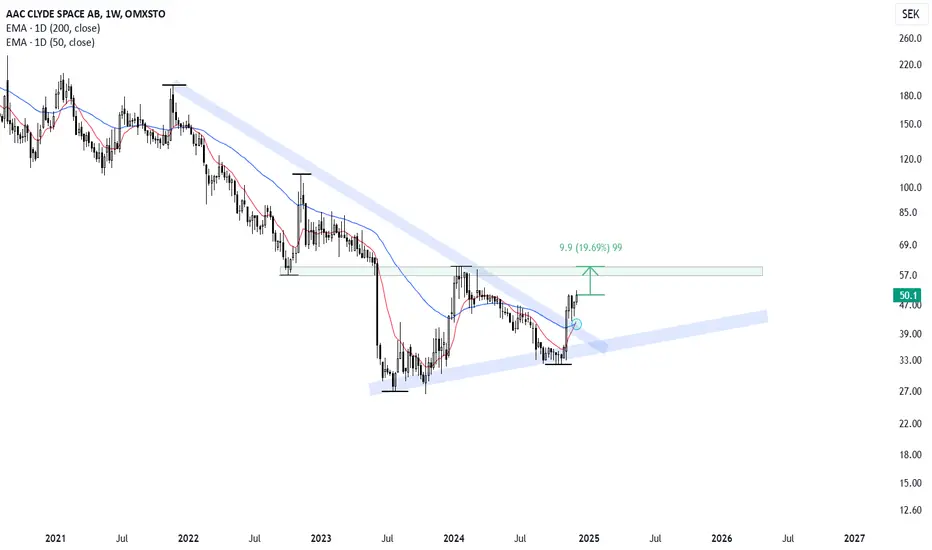
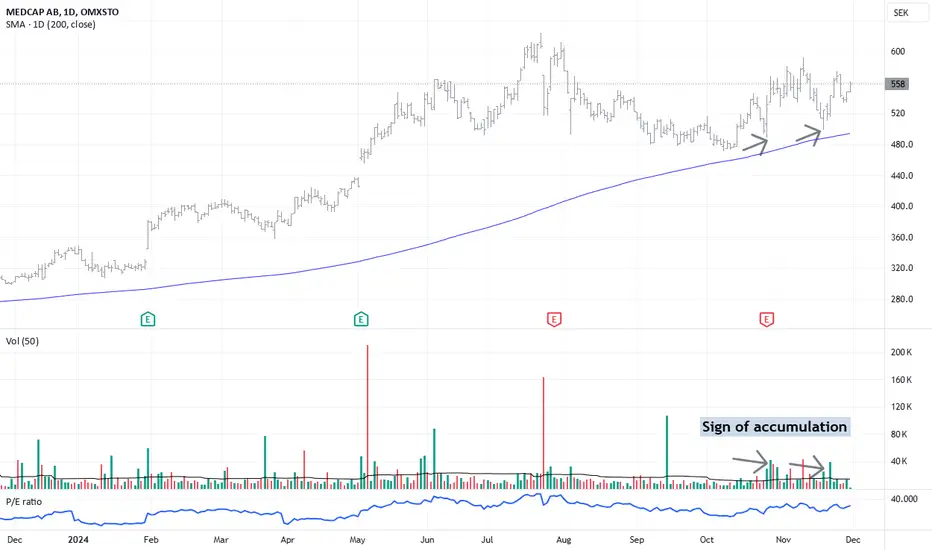
Long
Long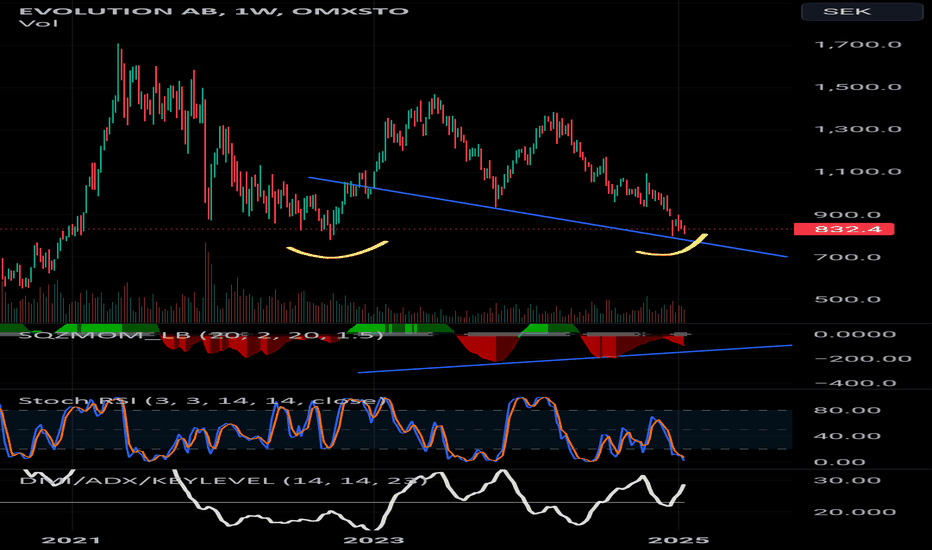
 Long
Long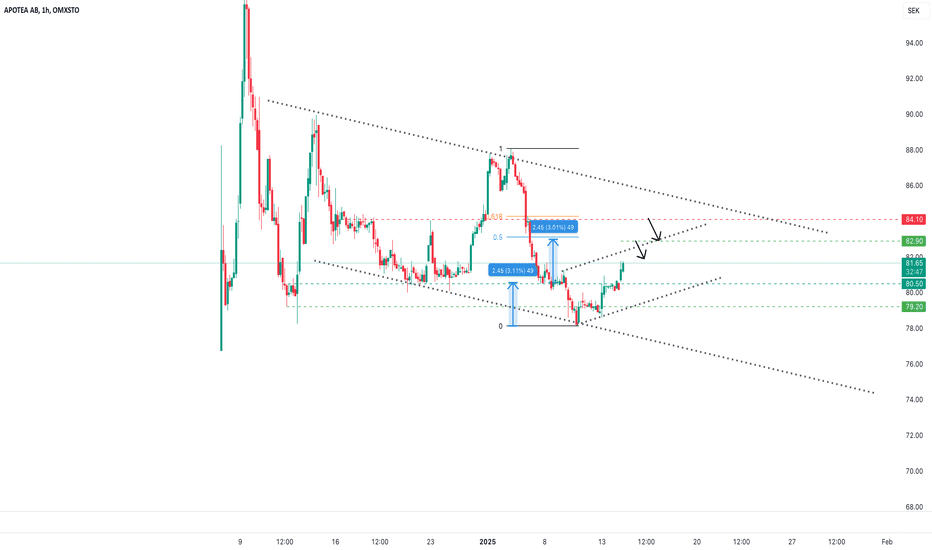
YUBICO - Time to say byeThis analysis cannot not recommend OMXSTO:YUBICO as an investment stock with this price level.
Overview of the Company
The company operates in the cybersecurity category (actually, what it does is not traditional cybersecurity services, we may call it as information security or data security).
They produce a single device used for authentication (web, mail, door etc.). However, the increasing number of passkey-based authentication (biometric, camera or pin-based methods) in today's computers is the biggest competitor of this system. Because such services come free with the device you buy.
Current Price : 216
Moving Averages
Daily 200 : 232
Prices broke 200-day support on 3rd of January.
Price under 200-day daily is a very strong indication that the stock operates in down trend
Weekly 50 : 219
Prices broke 50-week support on 7rd of January
Waves
If the pries goes under 204, it confirms the downtrend.
One another support is on 176 that looks a senseful price to have this stock for long term.
Candles
Monthly : Most recent two candles is making lower low with a high volume that is an indication of a downtrend.
Indicators
MACD Weekly : Growing histograms under base level indicates sell pressure.
MACD Daily : Formation of a divergence started that indicates price reversals.
MACD 4H : A divergence has been formed, but histograms are very short that may indicate a noise.
MACD 1H : If prices does not go under 216, it is a signal to buy (short term trade as well as a week signal)
Super trend :
1H - 4H - 1D : Downtrend
PSAR :
1H : Uptrend (weak)
4H - 1D : Downtrend
Harmonics
A harmonic pattern has been formed with a good wave structure.
The harmonic has been supported by support and resistence lines.
But the price operates under harmonic pattern level that is an indication to stop out.
When the price hits 211, the formation fails.
Fundamentals
Valuation :
P/E : 54 (Very high)
Price to cash flow ratio : 95 (Extremely high)
Summary : Very high price
Profitability
Gross margin : 80% (Significant)
Net margin : 13% (Good)
Summary : Profitable
Solvency :
Debt to equity : 0.04 (Significant)
Summary : Finances itself without debt
Earnings :
Fluctuates, reduced -18% at Q3
Insider activity
Only selling for 1 year with no buy
Fond activity
Selling  Short
Short
 Long
Long
Long 
 Long
Long
Long 
 Long
Long
 Long
Long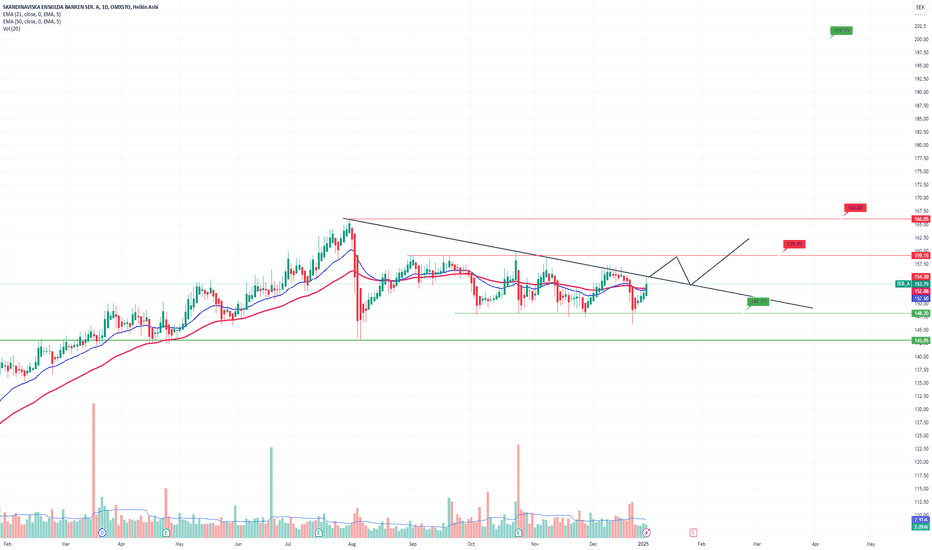
Long 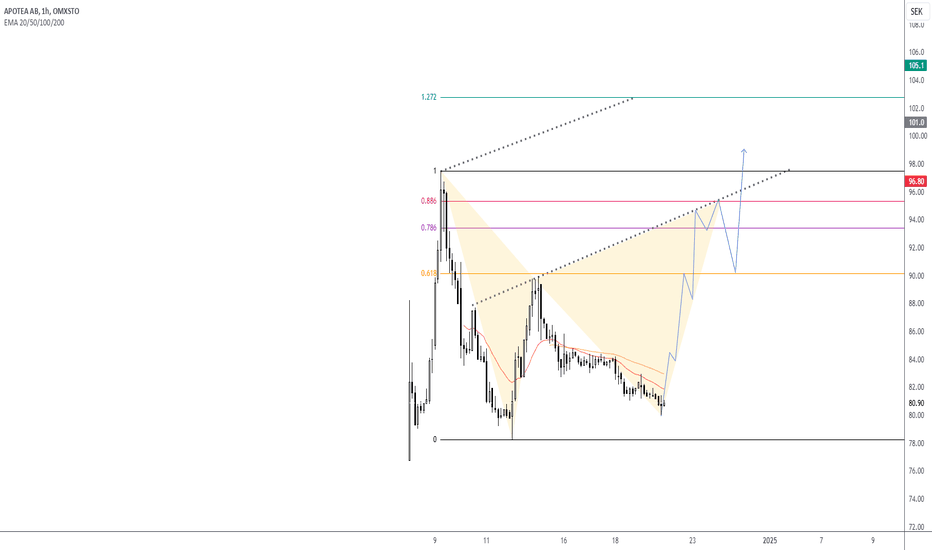
Long 
 Short
Short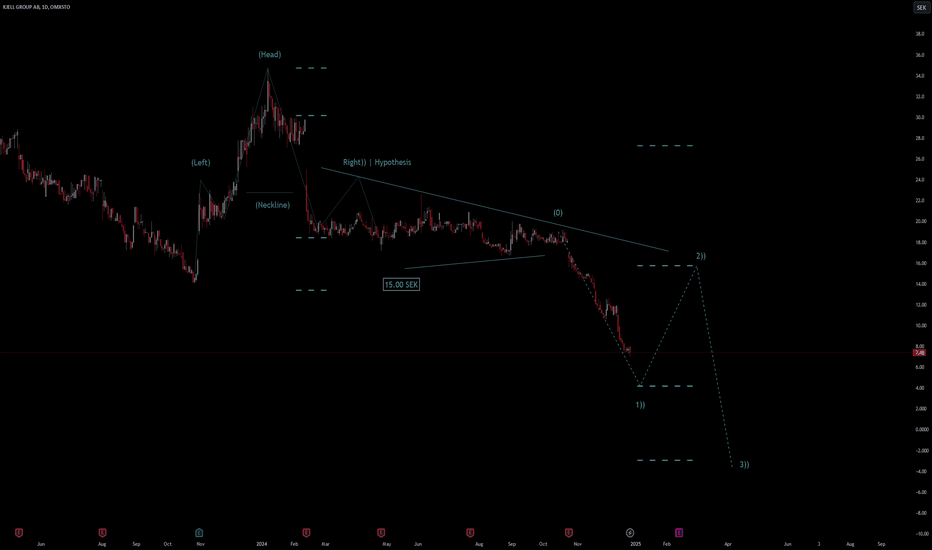
 Long
Long
Long 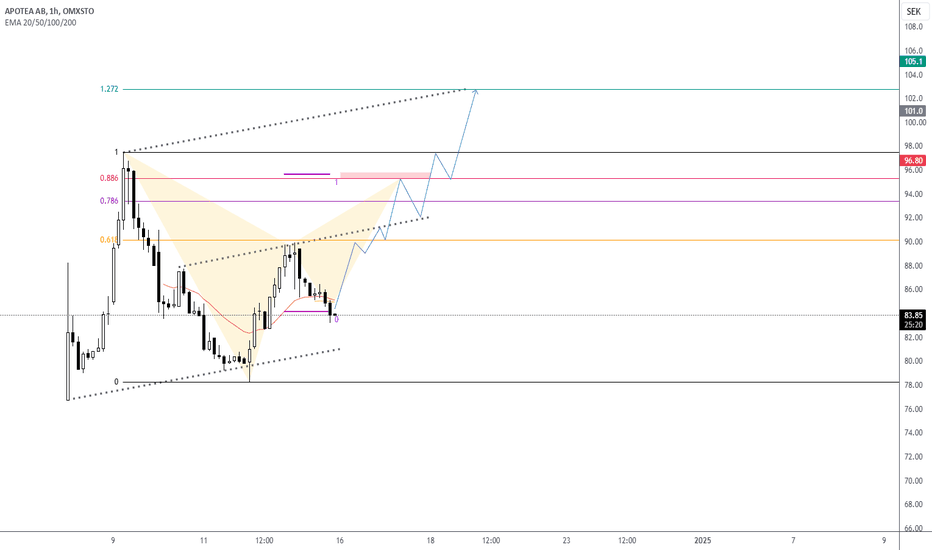
 Long
Long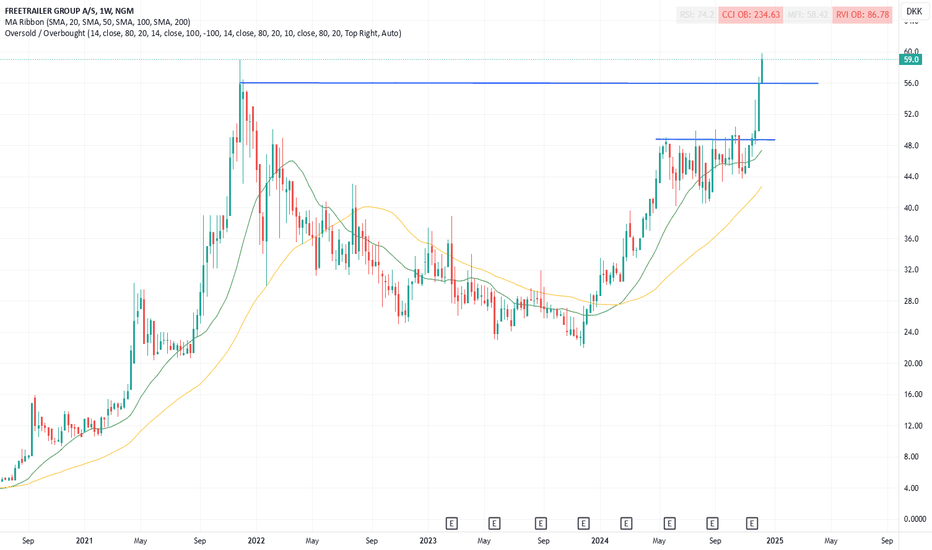
 Long
Long
Long 
Long 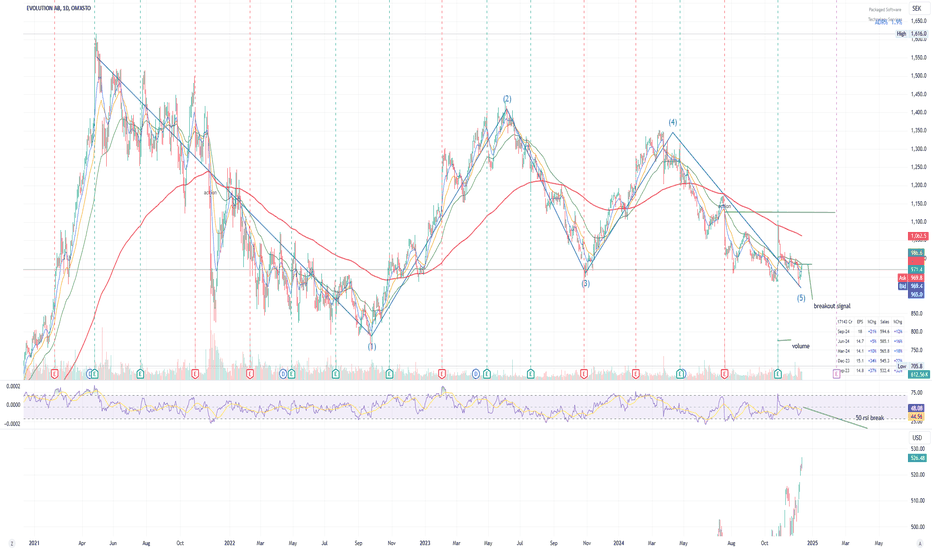
 Long
Long