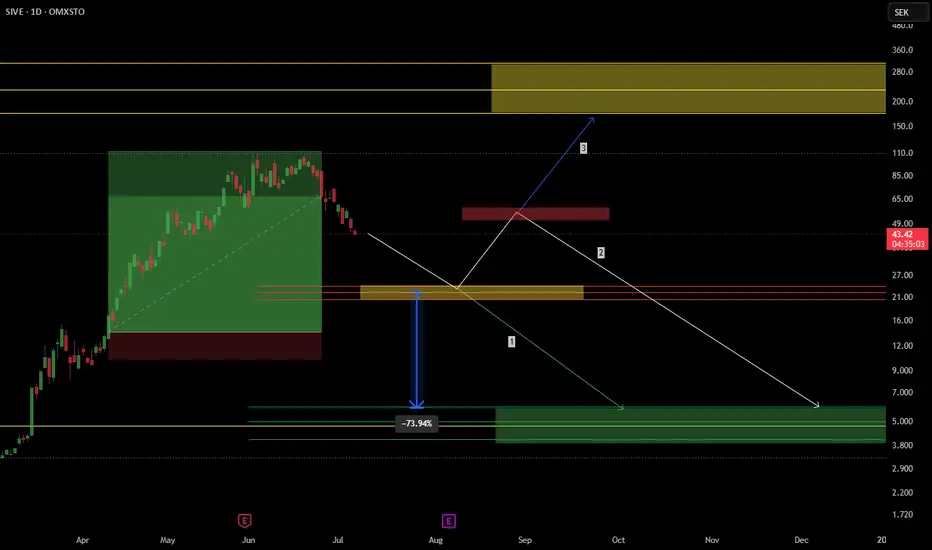
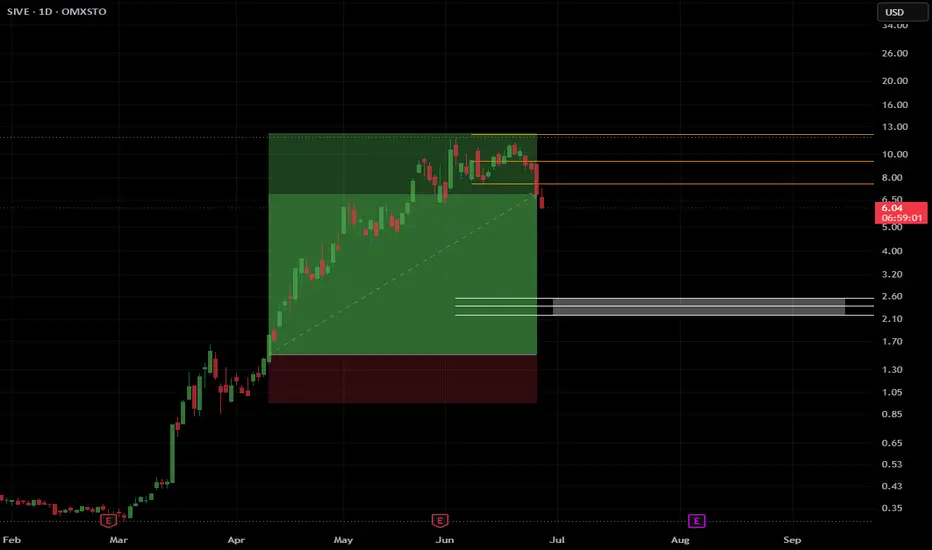
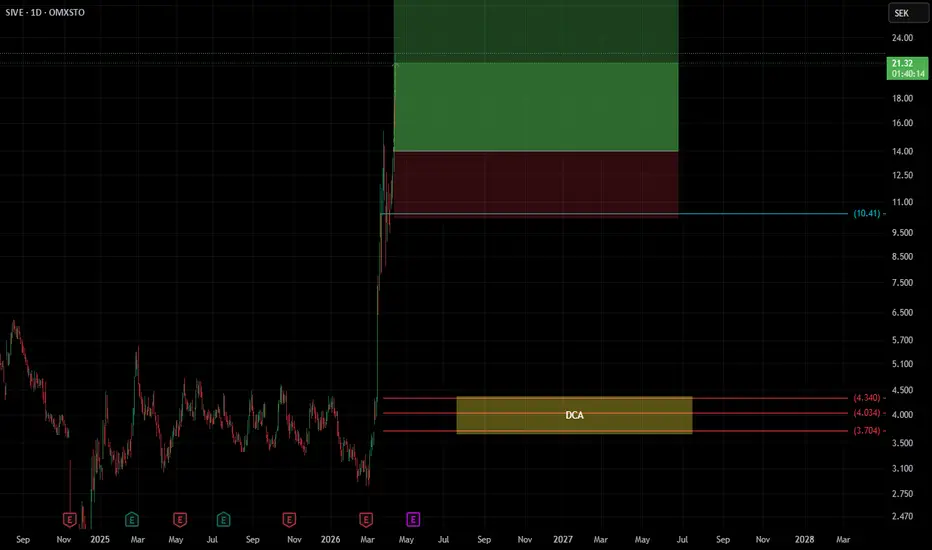
$SIVE , IdeaSIVE has gone from a prolonged accumulation phase to an explosive markup in just a few months. Moves of this magnitude rarely continue in a straight line, making the current area a key decision point for the coming months.
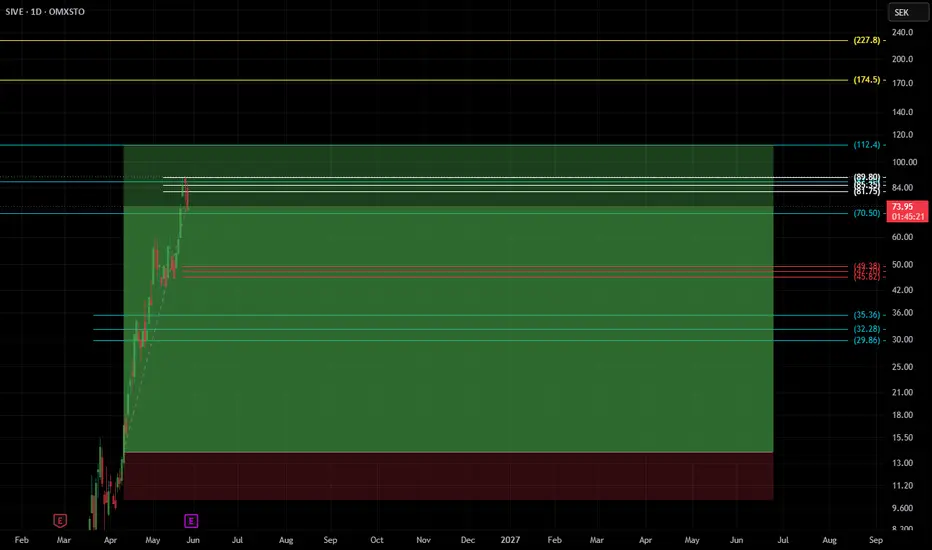
From a Smart Money perspective, price is now testing an important area after reaching fresh highs. The question isn't whether the company is good or bad—it's whether the market needs a reset before the next major move.
Scenario 1 – Full Reset
The most aggressive scenario is a complete retracement back into the previous accumulation range around 4.5-5.5 SEK.
While that would represent a drawdown approaching 90% from the highs, history has shown that many momentum stocks experience extreme corrections after parabolic advances. If that occurs while the long-term thesis remains intact, it could become the highest-conviction accumulation opportunity.
Scenario 2 – Intermediate Correction
A more constructive outcome would be a correction into the 20-25 SEK demand zone.
This would allow excess speculation to be flushed out while maintaining a healthier long-term structure. A base forming here would be far more constructive than an immediate continuation without consolidation.
Scenario 3 – Immediate Continuation
If buyers quickly absorb the current selling pressure and reclaim the recent highs, SIVE could continue its markup phase toward the higher supply region between 180 and 280 SEK.
For that scenario to gain credibility, I'd want to see strong demand return and the current pullback transition into a new impulsive leg.
Which path do you think SIVE follows from here?
Like, Follow, Boost, Join, Thank You!
Financial Disclaimer: This post is not financial advice. I am not your financial advisor, your stock influencer, or your emergency hotline when volatility discovers your stop loss. Always do your own research and never trade solely because colorful arrows suggest a brighter future.  Long
Long
 Long
Long
 Long
Long
 Long
Long
Entering a far more interesting phase than chart first suggest!Cereno Scientific is entering a far more interesting phase now than the chart alone first suggests. After a full year of selling pressure from the 11.90 SEK peak down to the 4.30 SEK low, the stock is no longer just trying to stabilise — it is entering a catalyst-heavy window at the same time as the technical structure is tightening into its main decision zone.
That is what makes the setup interesting here. Several things are starting to line up at roughly the same time: momentum is improving, volume is picking up, the daily chart is trying to reclaim higher structure, and the company is moving into one of its most important catalyst periods in a long time. CS1 Phase IIb initiation, 15-month EAP data, CS014 PK bridging data and the broader financing/partnering backdrop are all landing while the chart is compressing between a long-term descending trendline and a rising trendline from the 4.30 low.
This is still an early-stage medtech/biotech chart, which means the daily timeframe leads while the weekly structure is trying to catch up behind it. But that is also why the current setup matters: if the stock confirms above 6.20 SEK, it does not just break a local range — it starts moving out of a compression pattern that has been building for months right as the fundamental news flow is turning materially more relevant.
The setup is defined by two converging trendlines:
a long-term descending trendline from 11.90 SEK and a rising trendline from the 4.30 SEK low. Price is being squeezed between them, volatility is dropping, and momentum is improving. This is the type of structure where the next move tends to be decisive. The key level where the chart flips from consolidation to expansion is 6.20 SEK.
Momentum & RSI:
Daily RSI (9) is around 61.8, confirming a momentum shift. Weekly RSI is still neutral at 45–50 but improving. Daily RSI above 61 is confirmed; weekly RSI above 60 is the structural confirmation still pending.
Moving averages:
Daily SMA50 reclaim is in progress. EMA 5/9 crossover EMA20 is pending. All candles must close above 6.20 SEK for confirmation. On the weekly chart, price must reclaim EMA20, EMA9 must separate upward, and weekly RSI must close above 55–60.
Key levels:
Support: 4.70 (June low), 5.20 (execution stop), 5.776 (recent structure).
Confirmation: 6.20 SEK.
Targets: 8.0, 10.34, 12.0 SEK.
Above 10.34 SEK, the financing facility unlocks fully, which is both a technical and fundamental trigger.
Fundamentals:
Edison’s June 2026 update highlights several value-inflection events:
– CS1 Phase IIb initiation (June 2026)
– 15-month EAP efficacy data (June 2026)
– CS014 PK bridging data (mid-2026)
– APS selected as lead indication for CS585
– Partnering discussions accelerating
– Valuation raised to 21.7 SEK/share
The company has a 650 MSEK financing facility, but full access requires the share price to reach 10.34 SEK, which aligns with the technical structure.
Trade logic:
Position: 25,000 shares at 5.93 SEK.
Add 25,000 more only if:
– All candles close above 6.20
– Weekly EMA20 reclaim
– Weekly RSI > 60
– Daily RSI > 61
– Daily SMA50 reclaim
– EMA 5/9 crossover EMA20
Stops: 5.20 SEK (execution), 4.70 SEK (structural).
Targets: 8.0 → 10.34 → 12.0 SEK.
Core thesis:
CRNO.B is forming a clean compression pattern where a long-term descending trendline meets a rising short-term trendline. Momentum is improving, volume is picking up, and the stock is entering a catalyst-dense period. This is not a “cheap stock” setup — it’s a trendline convergence + momentum shift case with a clear confirmation level at 6.20 SEK. The opportunity is not in guessing but in waiting for the structure to prove itself.  Long
Long
Senzime – Six Years of Compression, One Decision Point AheadSenzime is not a confirmed breakout stock yet, but the setup is getting harder to ignore and with an amazing risk reward based on of course profit but the technical, historical and fundamental conditions are very good. After years of drifting, the company has finally started to show real traction: a growing installed base, recurring sensor revenue, improving margins and a stated path toward profitability in 2026. It is still a small-cap medtech name and quarterly numbers can move around, but for once the fundamentals are no longer fighting the chart.
What makes the case interesting now is not one single thing. It is the combination of several things lining up at roughly the same time: six years of compression, a tightening monthly structure, a weekly trigger getting close, and a period where the company has actually delivered several meaningful releases instead of just talking about potential.
The backdrop has improved. In a fairly short period, Senzime launched the new TetraSens sensor, announced a pediatric hospital contract in the US, and introduced the TetraAnalytics cloud platform. For a company of this size, that matters. It is more execution density than the company has usually shown in earlier phases.
Monthly structure – the big picture
On the monthly chart, Senzime is approaching a rare higher-timeframe alignment where all moving averages I use (EMA 5, 9, 20 SMA50)are aligning just above the price on monthly under compression. This is not a normal short-term crossover. It is the kind of setup that only starts to appear after years of pressure, failed rallies and compression.
The long-term downtrend from the 2020 high and the shorter multi-year trendline have now narrowed into the same decision zone. In other words, the chart is running out of room. The stock does not need to explode tomorrow, but it is getting close to a point where it probably cannot stay neutral much longer.
Weekly structure
The weekly chart holds the actual decisons. The first real trigger is still the weekly EMA 5/9 crossover.
Without it, this is still just a watchlist setup.
With it – and preferably with volume following – the structure opens up a lot faster.
This is also where timing becomes interesting. Senzime has shown a fairly clear rhythm in recent years: Q1 tends to be quieter, May and June often turn into digestion, and July is where the stronger move has tended to come.
In previous years, that seasonal window has produced moves ranging roughly from 40% to 140%, depending on where the stock entered the period and how strong the broader setup was. That does not mean it has to happen again, but it does show that when Senzime starts moving in this part of the calendar, the upside can become meaningful very quickly.
Key levels
• Invalidation: 4.10
• Accumulation / trigger zone: 4.60–5.00
• key : 5.00
• Breakout level 1: 5.40 – break of the 6-year trendline
• Breakout level 2: 5.80 – break of the 4-year trendline
Upside zones if the structure opens up:
• 6.5 –7.5 – monthly SMA50 zone
• 9.0
• 15.0
Above 5.50-6.00 – the chart starts to look very different. That is where the stock begins to move out of a six-year cage, and where the asymmetry becomes more interesting because there is relatively little historical congestion before the monthly SMA50 zone.
Catalysts
• Euroanaesthesia
• Potential weekly EMA 5/9 crossover into late June / early July
• Q2 report on July 16
• TetraSens US launch in Q3
• Profitability target by year-end
The core of the case
This is not a “buy because it is cheap” setup. It is a structural compression case with a very specific trigger.
• Monthly tightening / alignment = the big-picture shift
• Weekly EMA 5/9 crossover = the ignition
• 5.50 - 6.00 = the levels where the structure really starts to open up
Below that, this is still mostly a compression story. Above that, it can become something else: a stock moving out of a six-year base with room to reprice far beyond a normal micro-cap bounce.
 Long
Long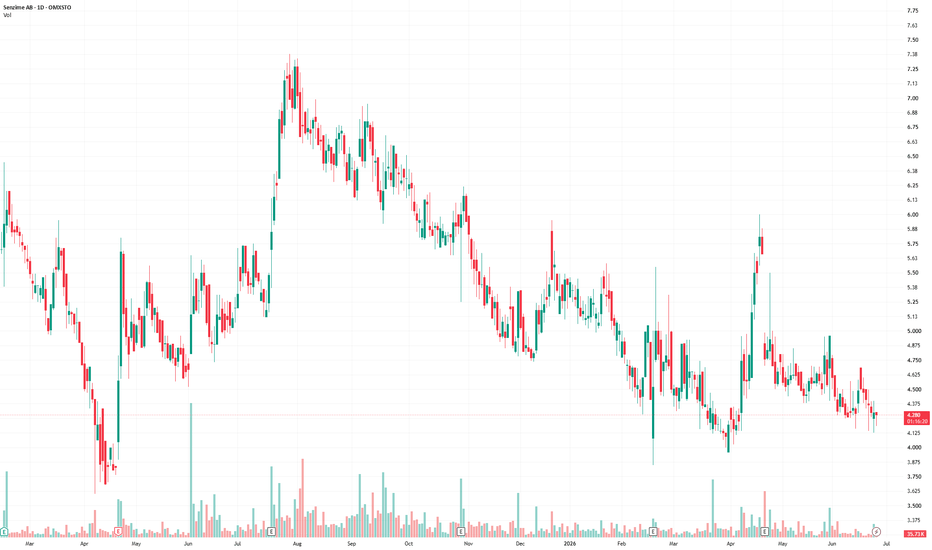
Long 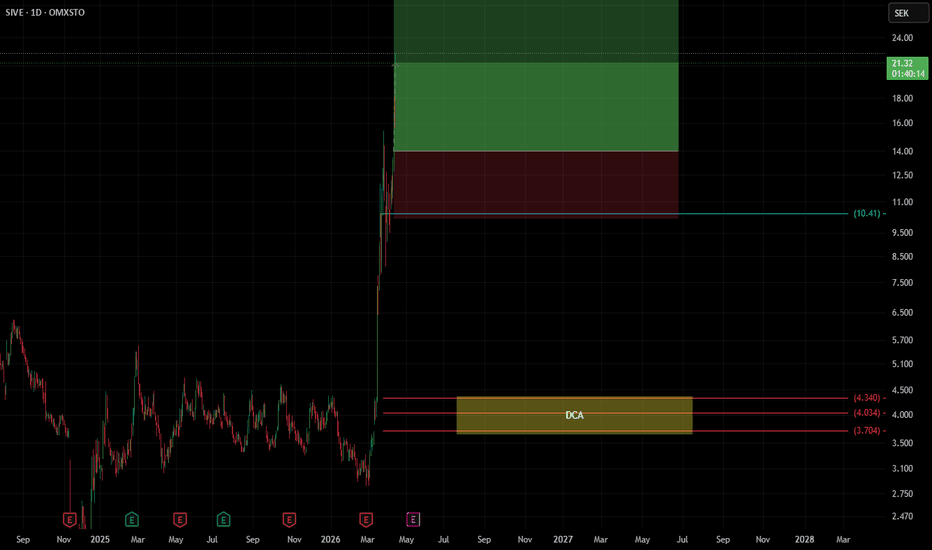
HNSA - Potential and Conditions for a Full Structural Repricing250624 - Potential and Conditions for a Full Structural Repricing
Hansa Biopharma should no longer be viewed as a standard biotech case driven by news volatility. It is a potential structural repricing case after a multi-year downtrend. Several independent layers are aligning: technical structure, volume regime, event timing, regulatory asymmetry, and a market again willing to react to Hansa-specific catalysts.
The backdrop has strengthened as Hansa approaches a second FDA decision, changing the character of the case. This is no longer a first-attempt story where all value rests on speculation about an unknown regulatory future. The market can re-evaluate Hansa as a previously depressed name with a genuine chance of U.S. establishment.
Yesterday's press release confirming the ConfIdeS Phase 3 abstract for the "What's Hot, What's New" plenary at ATC 2026 is a clear quality endorsement from the transplant field. The timing matters: released after close, the evening before Capital Markets Day, creating a clean sentiment window where the market receives a positive anchor just before management takes the stage. Hansa has historically reacted strongly when scientific events and company catalysts cluster in time.
The stock also shows a documented tendency to awaken around late June. Last year's larger move began around June 25. History need not repeat, but it demonstrates the stock's ability to enter extended moves when event flow, expectations and technical structure align. This year it starts from a higher level with a more mature technical structure.
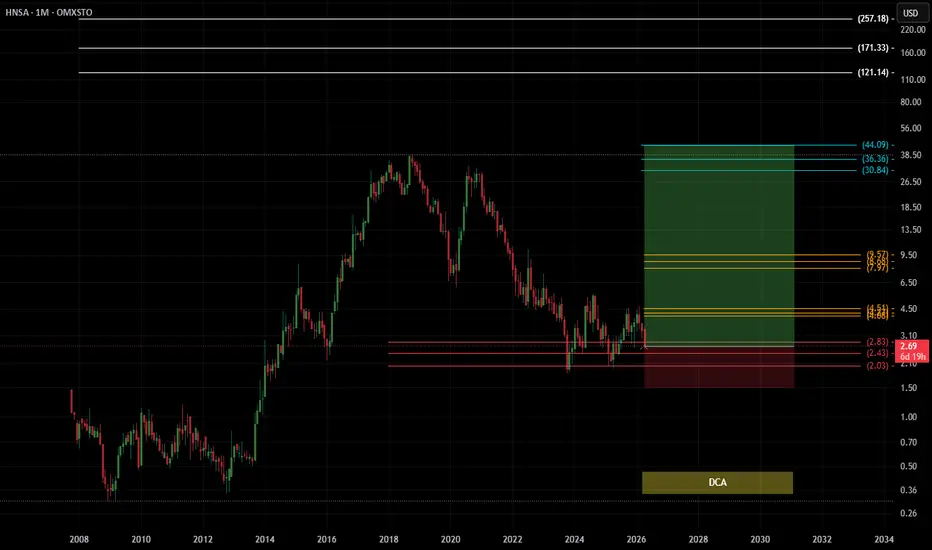
The technical core: Hansa is approaching its entire multi-year compression. Monthly candles show clear compression while approaching the monthly SMA50 around SEK 41. Above sits SEK 42, coinciding with the 52-week high and multi-year resistance. Over 25-30 months, SEK 42 has repeatedly acted as resistance, only exceptionally as support. It is the major structural judgment level. Rejection there keeps this a transition attempt. Reclaim and acceptance above signals the old regime is ending.
The weekly structure reinforces this. Hansa has moved through weekly Ichimoku under better conditions than the failed 2024 attempt, when price entered a broad red cloud around SEK 33 and fell back. This time the passage occurs through a narrower, greener cloud, with higher lows, lower highs, monthly and weekly compression, a broken six-year downtrend, and elevated volume. SEK 33 is already passed. The real questions are SEK 37 as first test, and SEK 41-42 as the multi-year decision zone.
Volume is central. Hansa shows notably higher volume than during the downtrend, indicating increased participation. Breaking multi-year resistance requires more than price strength; participation must change too.
Why now: First time in years several things line up at once. Broken downtrend, compressing monthly and weekly structure, elevated volume, real catalysts instead of hope. Combined with ATC timing, the press release, and CMD, it looks less like a random bounce and more like a structural setup.
Structural progression: 33 was the gate above weekly Ichimoku. 37 is the first proof level. 41-42 is the real decision zone with monthly SMA50, 52-week high and repeated resistance. If that flips, 50 becomes the next natural magnet.
Risk / invalidation: Failure at 41-42 and fall back under reclaimed structure means still only a transition attempt. Choppy price action without follow-through after these catalysts weakens the case. A breakout push without real volume participation is easier to fade.
The most interesting scenario: the market jumps through SEK 42 on the combined catalysts, and a first pullback holds 42 as support. That would be the clearest sign of full structural repricing, with SEK 50 as the next magnet.  Long
Long
 Long
Long
 Long
Long
 Long
Long
 Long
Long
 Long
Long
Electrolux bullish haramiSeeing a bullish harami in the monthly chart is technically an interesting signal, especially in light of the major transformation the Electrolux Group is undergoing according to its 2025 annual report.
1. What does the pattern signal?
A bullish harami consists of a large red candle followed by a smaller green candle that is fully contained within the body of the previous one.
• Psychology: This suggests that selling pressure has weakened and that a potential trend reversal may be approaching. When it appears on a monthly chart, the signal carries more weight than on shorter timeframes, as it reflects a more long-term shift in sentiment.
• Context: Since Electrolux has had a tough period with weak share performance (the stock dropped significantly during 2025 and early 2026), this is often interpreted as “the bottom may be near.”
2. Connection to fundamental factors (from the annual report)
Technical signals work best when they align with fundamentals. The annual report highlights several factors that could support such a reversal:
• CEO transition & strategy: Yannick Fierling’s new vision (“North Star”) and a more streamlined organization taking effect in 2026 are beginning to show in the numbers.
• Cost savings: Achieving SEK 12.8 billion in savings over three years creates operating leverage when the market turns.
• Analyst view: In early 2026, several research houses (e.g., SEB, DNB, and Carnegie) adjusted their target prices. While some lowered them, many targets still remain well above the current share price (in the range of SEK 80–110 in some cases), indicating upside potential if the strategy succeeds.
3. Challenges to watch
Despite the bullish formation, there are still obstacles:
• Resistance levels: Technical analysis (including from Investtech) suggests resistance around SEK 63–70. For the harami pattern to be confirmed, a close above the high of the previous red candle is often required.
• Market conditions: The report noted that the European market is at its lowest level in ten years. A technical reversal will likely require that macro conditions (interest rates and consumer purchasing power) do not deteriorate further.
Summary
The bullish harami suggests that the market is beginning to digest negative news and is starting to see potential in the ongoing restructuring. It’s a classic “wait and see” signal, where buyers cautiously begin to take positions again after a period of uncertainty.
Remember: Technical patterns are probabilistic, not guarantees. It’s important to see whether the next monthly candle confirms the move by closing higher.
Here is your text translated into English:
⸻
Based on the 2025 annual report, Electrolux Group is undergoing a major transformation phase under the leadership of its new CEO, Yannick Fierling. Here’s a summary of what’s happening and the company’s future outlook:
What is happening with the company?
Electrolux Group implemented a new strategy and vision in 2025, referred to as its “North Star.” The focus is on becoming a leader in consumer satisfaction and delivering solutions that continuously improve throughout the product lifecycle.
• Organizational changes: Starting in 2026, a new product organization will bring together strategy, research and development (R&D), design, and sourcing under one leadership to reduce complexity and costs.
• Brand streamlining: The company has begun phasing out the Zanussi brand in Europe to focus instead on the mid- and premium segments with the Electrolux and AEG brands.
• Cost efficiency: The company has delivered significant cost savings. In 2025 alone, savings of SEK 4 billion were achieved, bringing the total to SEK 12.8 billion since 2023.
Is the company improving?
There are several signs in the report pointing to a positive development, although challenges remain:
• Improved earnings: Operating income improved to SEK 3.7 billion in 2025 (compared to SEK 1.7 billion in 2024), with an operating margin of 2.8%.
• Organic growth: The company achieved organic sales growth of 3.9%, mainly driven by North and Latin America.
• Sustainability leadership: Electrolux continues to receive recognition as one of the world’s most sustainable companies, which is a key part of its strategy to attract future consumers.
Will they succeed?
The report expresses optimism but emphasizes that success depends on how well the company manages external factors and executes its strategy:
• Challenging market: The European market is described as being at its lowest level in ten years, with strong competition and pricing pressure across all regions.
• Risks: Success depends on the ability to quickly adapt to digitalization, AI, and automation. Failure to execute strategic priorities in time could negatively impact growth.
• Strategic drivers: The company focuses on four pillars: consumer preference, lifetime value creation, cost leadership, and cash flow generation.
Summary
Overall, the report shows a company actively restructuring to become more efficient and consumer-focused. This has already started to yield results in the form of improved profitability, despite a challenging global economic environment.
 Long
Long
Long