Saab AB: Defence Giant Pauses — Opportunity in Disguise?Technical Analysis
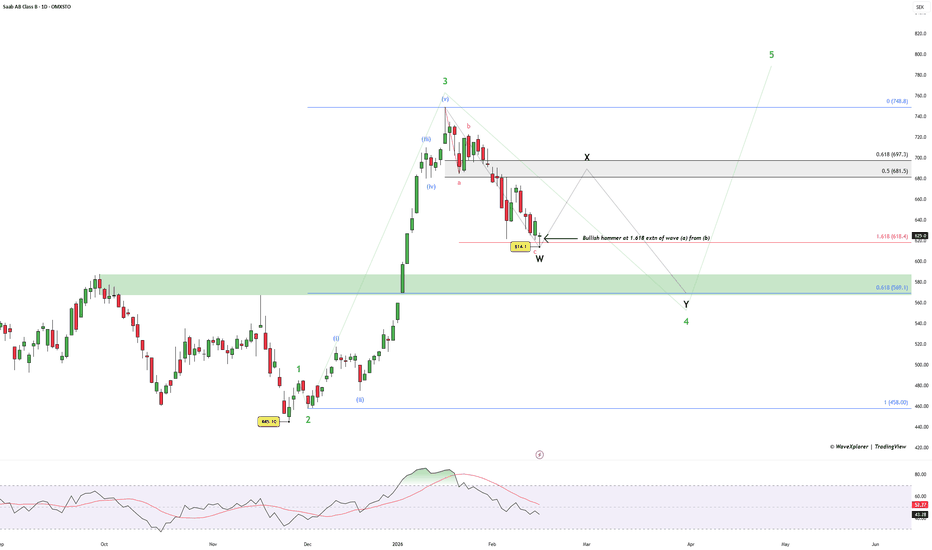
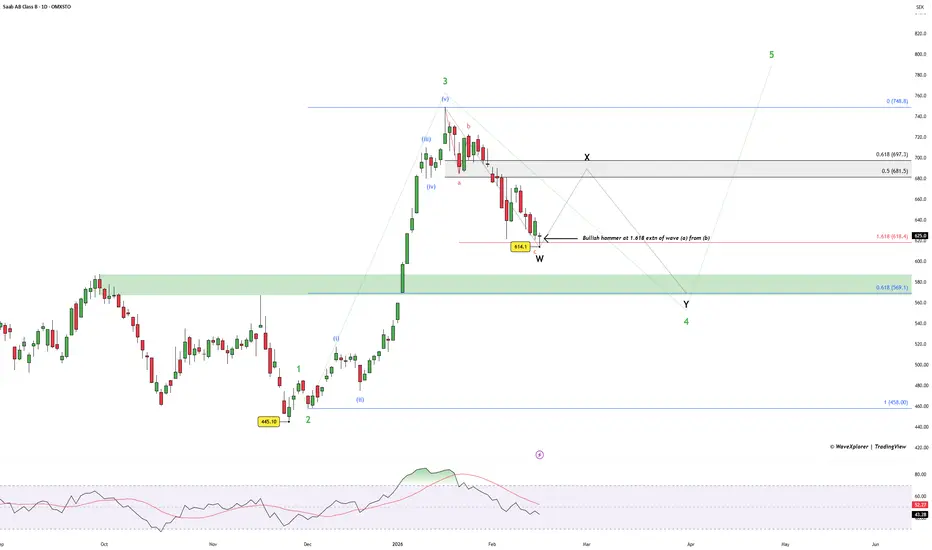
From the lows at 445.10, Saab AB advanced in a strong impulsive structure forming a 1-2, 1-2 setup and extending into a powerful higher degree Wave 3, topping near 748.8.
Post that high, price has corrected in what appears to be an ABC zigzag, with Wave C reaching the 1.618 Fibonacci extension of Wave A from B near 641.
A bullish hammer has formed at this zone, hinting at a potential short-term reversal.
If 641 holds, we may see an X connector rally toward the 0.5–0.618 retracement zone of Wave W between 681.5–697.3.
After that, a possible final Wave Y decline could unfold toward 569.1, which aligns with the 0.618 retracement of the entire Wave 3 rally and a broader support cluster.
Completion of this correction may set the stage for Wave 5, potentially pushing price beyond 748.8 toward 800+ SEK.
Invalidation : A decisive breakdown below key support zone weakens the Wave 4 scenario.
Fundamental View
Revenue has grown strongly over recent years, especially post-2022. Free cash flow remains positive though volatile.
Operating margins and ROCE are trending higher, showing improving efficiency and capital usage.
However, long-term debt has increased and valuation remains stretched with a P/E around the mid-50s.
This is not a cheap stock. It is priced for continued strong growth.
Verdict
Technically, Saab appears to be developing a Wave 4 correction within a larger bullish structure.
Fundamentally, the company is solid — but expensive.
If support holds and structure confirms, the larger trend remains bullish.
If growth slows or support breaks, downside risk expands quickly.
Disclaimer: This analysis is for educational purposes only and does not constitute investment advice. Please do your own research (DYOR) before making any trading decisions.
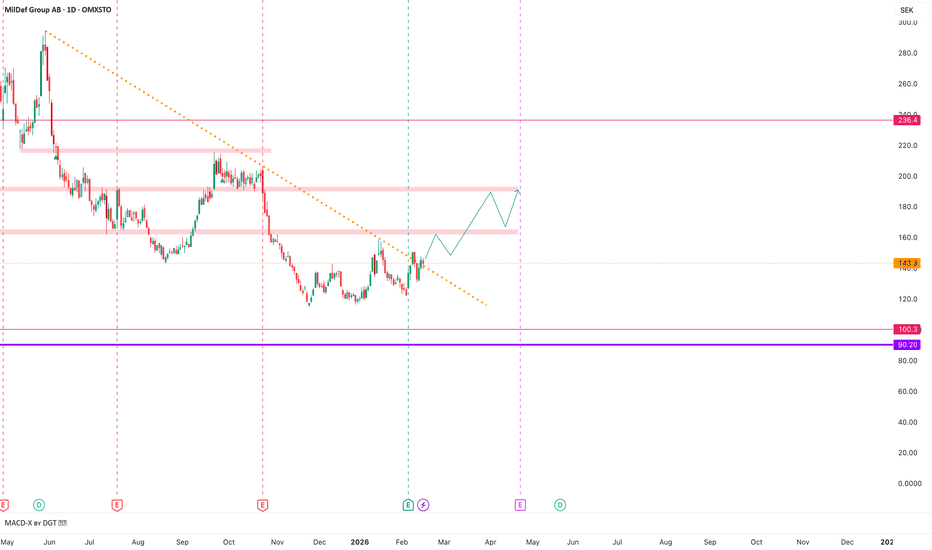
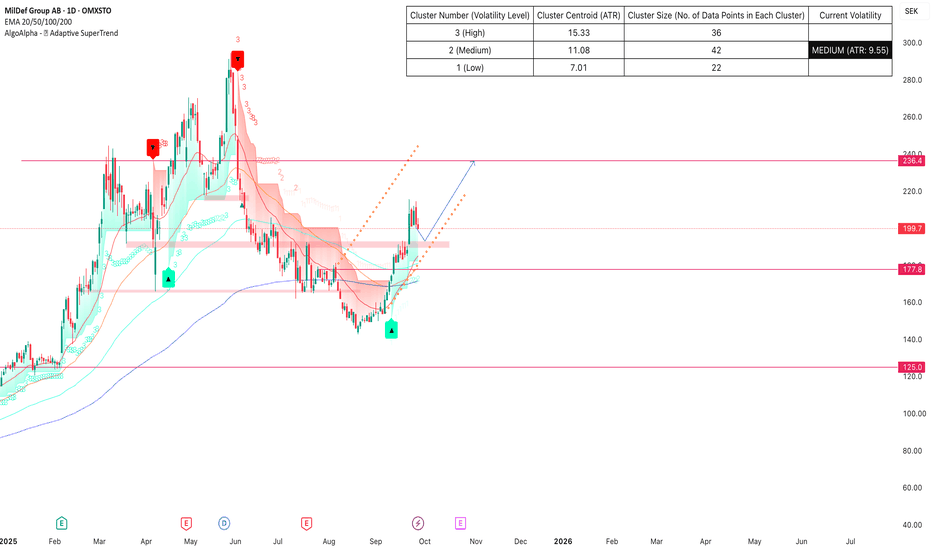
MILDEF - ConsolitdationMILDEF has reached the trend line but is unable to break through it definitively. This indicates very strong short pressure on the stock.
In normal price movements, a sharp break from this trend line is expected, but MILDEF does not have the strength to do so.
It will continue its sideways movement. The best possible movement is shown on the chart.
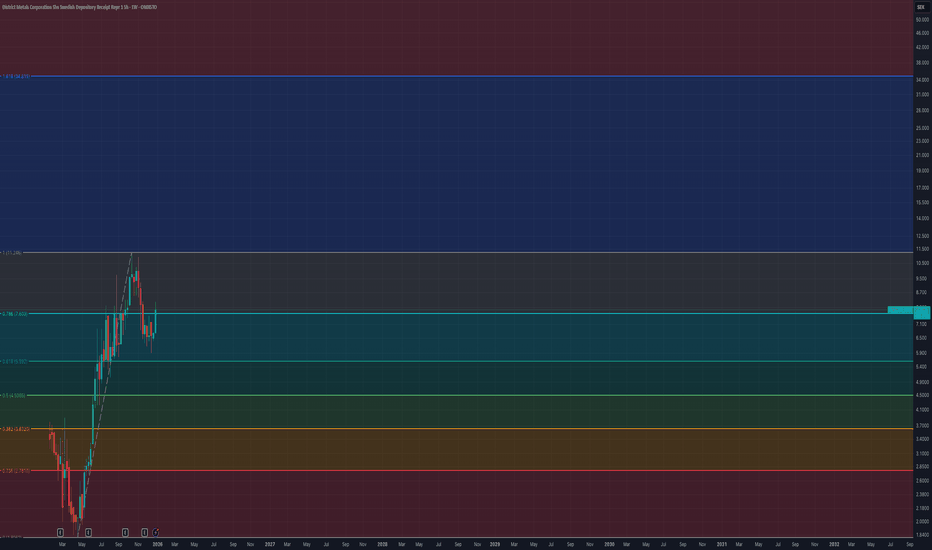
District Metals - Bullish outlook for the Uranium StockDistrict Metals (DMX): A Sweden-Focused Metals Story With a Regulatory Catalyst
District Metals is a Canada-listed exploration and development company with a strong focus on Sweden. The company is positioned around two key themes: polymetallic base and precious metals in historically productive mining districts, and long-dated optionality tied to energy and critical metals.
One of the company’s core assets is the Tomtebo project in the Bergslagen mining district. Bergslagen is one of Europe’s most established mining regions, with centuries of documented production across copper, zinc, lead, silver and gold. Tomtebo hosts multiple historical mines and polymetallic showings distributed along a large structural trend. The investment case here is straightforward: modern exploration techniques applied to an old mining district that was never explored with today’s geophysics, structural modeling, or systematic drilling. Value creation is driven by data — drilling results, geological continuity and scale — not narratives.
The second leg of the story, and the one attracting increasing attention, is Viken. This project hosts uranium alongside other metals such as vanadium, molybdenum, nickel, copper and zinc. For years, the economic potential of Viken has been structurally capped by Swedish legislation, as uranium extraction was effectively prohibited. That regulatory ceiling mattered — regardless of geology, uranium could not be part of any mine plan.
That is now changing.
Sweden has formally decided to reverse its long-standing uranium ban. The Swedish parliament has approved amendments to the Minerals Act and the Environmental Code that allow uranium to be classified as a concession mineral, meaning it can legally be explored for and extracted under the standard permitting framework. These changes are scheduled to come into force on 1 January 2026.
This is a material shift. It removes a hard legal stop that has existed for decades. For projects like Viken, uranium can once again be considered as part of the economic equation rather than being ignored entirely. That said, this is not a shortcut to production. Permitting, environmental assessments, technical studies, social acceptance and economics still apply. The law change does not eliminate risk — it eliminates prohibition.
From a market perspective, District Metals sits at the intersection of three forces: drill-driven exploration upside at Tomtebo, regulatory re-rating potential tied to uranium in Sweden, and a broader European push for domestic supply of critical raw materials. This is inherently high-risk territory, but that is where optionality and asymmetric outcomes live.
Execution, not sentiment, will decide the outcome.
Disclaimer: This post is not financial advice and should not be considered a recommendation to buy or sell any security. Always do your own research before making investment decisions.
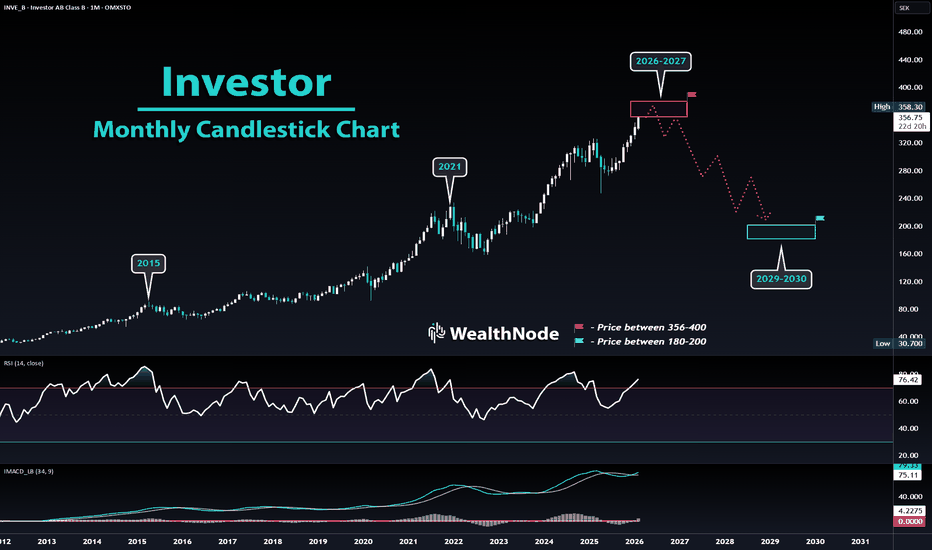
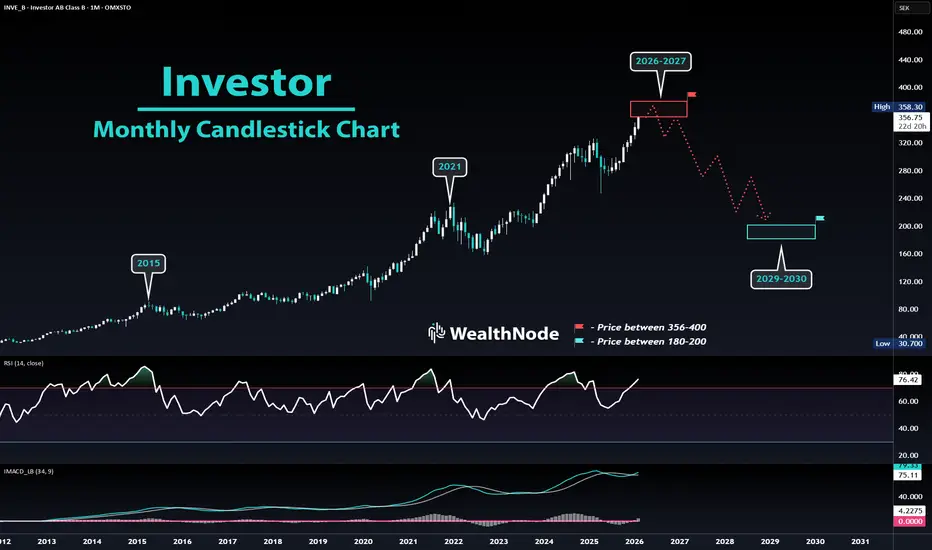
Investor - Price target - Incoming CrashThis is my price target for the stock Investor, Exact price movement is impossible to predict but I expect to see a price drop of around 40%+ from current levels.
We have now reached the target i set out 4 years ago at 356 based on fib extensions. We will most likely bounce around here and search us up higher before a breakdown, Reasoning for Investor to have such a aggressive decline is due to the 18.6 year real estate and economic cycle that is most likely ending this year, which will take stocks and other assets down by a significant amount starting late 2026 sometimes 2027.
Timeframes are extremely hard to set out but these are my estimated targets.
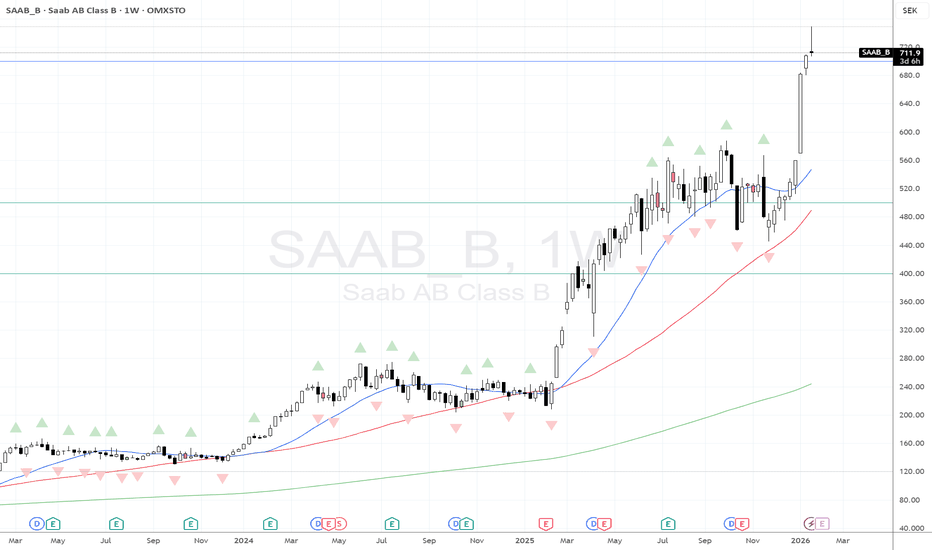
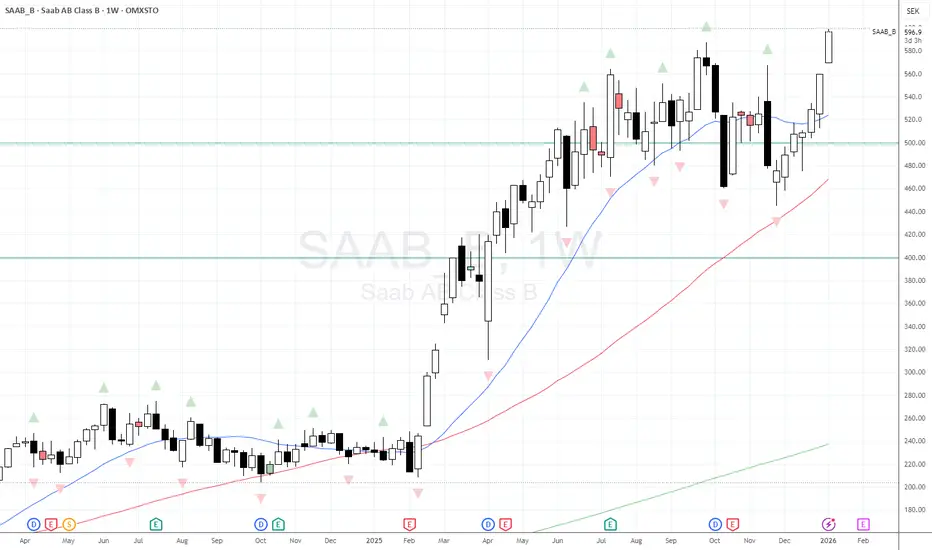
SAAB continues to rally off European Defence fears.A snippet from ForexTraderPaul's YT Channel Monday Market Update #211: Greenland is cold whilst Defence Stocks are hot.
Back in Nov/Dec of last year price across many European defence companies had fallen back towards the weekly 50MA (red MA on my chart) on the back of rumours of a Ukrainian Peace deal. My view was that if there was a deal then the support from the 50MA would likely crack and prices would fall quickly.
Well, clearly there was no deal, and in fact we've gone the other way in 2026 with geo-political tensions rising, and this is now reflected across many European Defence Manufacturers, including SAAB. We've now spiked to SEK700. Will this move be sustainable? Or is it just a knee-jerk spike? I think it might be the latter (certainly for the remainder of this week) before prices fall back. The trend remains up - I think this is just a bit of over exuberance. Points to note:
- Clear beneficiary of Nordic and broader European defence expansion.
- Strong demand across land systems, radar, and air defence.
- Valuation already reflects optimism.
What traders should be aware of: order book updates now matter more than geopolitical headlines.
SAAB breaks to new highs off the back of geo-political events.We saw a range of Defence companies on both sides of the Atlantic have anew year bump following the events in Venezuela.
Interestingly it was SAAB making the biggest moves on this side of the Atlantic yesterday. Why would that be? Is it because people see Trumps moves as in indication that a) he's more interested elsewhere than Europe and b) that means the Europeans will have to spend more on their own defence? It could be both (though I am remain unconvinced that Europe will pay/do what it needs to ensure its own defence.
Anyway, the price of SAAB has been on a great run since Feb 22...precisely when the Ukraine Conflict began. They have provided AEW to Ukraine, and recently France bought a couple more of their Globaleye AEW platforms to replace their E-3Fs, but I cant really imagine that is enough to shift the order book massively. Maybe its confirmation that there will be no peace-deal and that Ukraine really will go through and buy 100 Gripens, rather than the kind of grand-standing propaganda it was beginning to look like? Please enlighten me if you have better insight.
Either way it broke to new highs - its been a great Santa move from lows of 460 SEK. A weekly close at the highs this week will continue that bullish momentum.
Nobia AB - Sweden - December 2025On the above 2 month chart:
1. Price action is on legacy support
2. Price action prints with high positive divergence.
3. Price action prints and RSI resistance breakouts
4. Market structure resistance is 500% above.
How's that for simple?
Good luck!
Ww
Disclaimer
=======================================================
This is not financial advice. Nor should it be mistaken for prophecy.
If you invest based on the opinions of strangers on the internet, then what you’re trading isn’t a stock, it’s your own discernment.
I hold no position in Nobia AB at the time of writing. I merely observe the chart, and it suggests, rather persuasively, that the patient may be showing vital signs.
Whether it walks again depends, as always, on evidence.. . not faith.
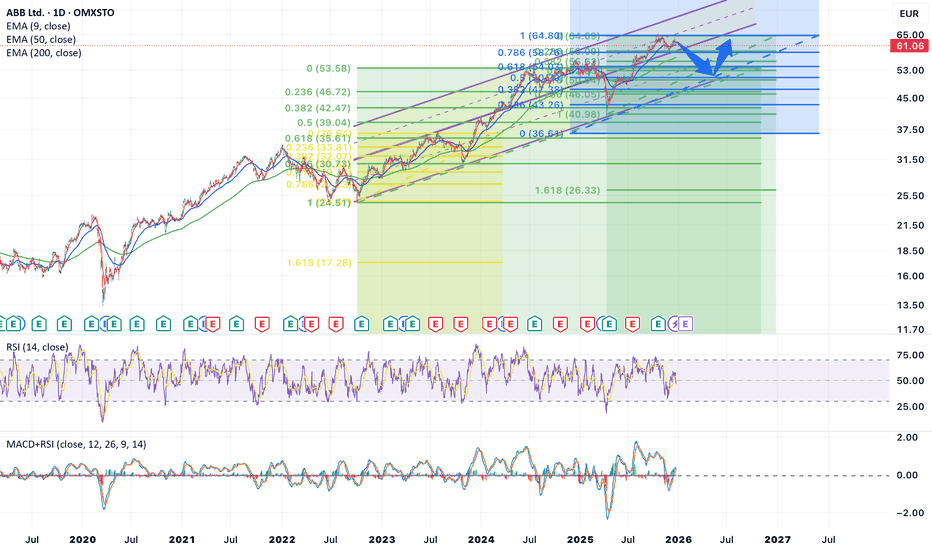
ABB📊 ABB Ltd (OMXSTO) – Technical Analysis
🔹 Overall Trend
• The long-term trend is bullish.
• Price is moving inside an ascending channel.
• Higher highs and higher lows are still intact.
⸻
🔹 Moving Averages (EMA)
• EMA 9: Short-term momentum, price is currently testing it.
• EMA 50: Acting as dynamic support.
• EMA 200: Well below price → confirms strong long-term uptrend.
As long as price stays above EMA 50 & EMA 200, the bullish structure remains valid.
⸻
🔹 Fibonacci Levels (Key Zones)
Important Fibonacci retracement levels visible on the chart:
Support zones:
• ≈ 58.8 – 56.8 → 0.236 Fib (major support)
• ≈ 53.5 – 52.0 → EMA 50 + Fib overlap (strong support)
• ≈ 49.0 – 46.5 → deeper correction zone (trend still bullish if held)
Resistance zones:
• ≈ 64.5 – 65.0 → recent high / Fib 0
• ≈ 68 – 70 → upper channel resistance
⸻
🔹 RSI (14)
• RSI is around 50–55
• This shows neutral momentum
• No overbought or oversold condition
• Healthy for a continuation after consolidation
⸻
🔹 MACD
• MACD is flat to slightly negative
• Indicates short-term consolidation
• No strong bearish divergence visible
• Momentum can turn bullish again if price holds support
⸻
🔹 Pattern & Price Action
• Price is consolidating near the upper half of the channel
• This looks like a bullish flag / correction within an uptrend
• Blue arrows suggest a possible pullback → continuation move
⸻
🔮 Scenarios
✅ Bullish Scenario (Preferred)
• Price holds above 56–58
• Bounce from EMA 50
• Targets:
• 64.5
• 68
• 70+ (upper channel)
⚠️ Bearish / Correction Scenario
• Break below 56
• Next supports:
• 53
• 49
• Even a drop to 49 would still be a healthy correction, not trend reversal
⸻
🧠 Conclusion
• Trend: Bullish
• Current phase: Consolidation / pullback
• Bias: Buy on dips, not chase highs
• Best entries are near EMA 50 & Fib supports
⸻
⚠️ Disclaimer
This analysis reflects only my personal technical view. I have no responsibility for your buy or sell decisions. Please manage your own risk and confirm with your own strategy.
Bullish 2From the chart, it can be seen that the price has been moving within the blue channel. Each time the price has touched the upper or lower line of the channel, it has reacted with a move either upward or downward. As shown, this has happened five times before, so there is a high probability that the price will react again this time and move upward to some extent.
#Truecaller 100% profit !!!!Truecaller AB reports 9% revenue growth 📈 to 506 million SEK and a net profit of 118 million SEK 💰. The “For Business” segment rises 53% 🚀, and premium subscribers 48% 🌟. Analysts forecast 17% annual growth 📊 and a target price of 60 SEK — investors could achieve nearly 100% profit 💵.
#Truecaller #StockMarket #Investing #Growth #TechStocks
10/24/25 - $yubcf - more treat than trick10/24/25 :: VROCKSTAR :: OTC:YUBCF
more treat than trick
- always a hard one to size up in the US mkts bc the OTC ticker is illiquid as all hell
- and the company has been fighting some headwinds
- but on a day like today i can start to get this squarely over 1.5% size w/o having to stress too much
- need to do more work, beware of the foreign settlement fee if you are a smol buyer (they will eat u)
- but a day to take a look
- digi identity in workplace is not a trend that's fading
- these guys have only hardware solution on mkt that makes sense
- hardware > software, always for security
V
Small bet on second EID providerFreja EID provides EID in a environment where using multiple EID becomes more popular. I would not be surprised to see using several EIDs for different purposes becomes recommended by public instances and institutions, if not a requirement, in the near future.
Earnings report tomorrow.
This is the One going 1000% in ner time Hello I hope you all can see all what’s coming.
We creeping holding the ma20 and the crossover in the ma system is showing a valid strength.
And the power we hade in the buying volume was over 1000% time the net value during normal days.
Klarna keep on rising to new al time height the we will understand. We will see what happens in the future.
Small bet on second EID providerFreja EID provides EID in a environment where using multiple EID becomes more popular. I would not be surprised to see using several EIDs for different purposes becomes recommended by public instances and institutions, if not a requirement, in the near future.
Earnings report tomorrow.