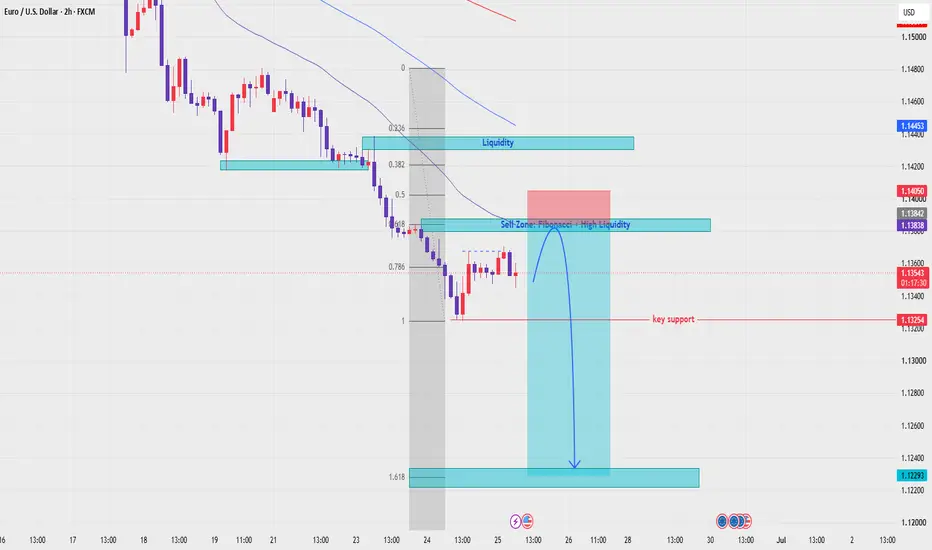
EURUSD — EMA Bearish Trend, Sell From Value Zone
Fundamental Analysis
EURUSD remains under bearish pressure as price continues to trade below the main EMA structure. Traders are still watching USD momentum, Fed expectations, and upcoming macro data.
For now, the technical structure still favours sellers while recovery attempts remain limited below EMA resistance.
Technical Analysis
On the 2H chart, EURUSD is trading below EMA 34, EMA 89, and EMA 200. This shows that the short-term trend remains bearish, with the EMA structure acting as d
Trend Line Break
XAUUSD — Bearish Structure Holds, Sell Bias Below 4018
Gold is trading around $3,982 after forming a light accumulation phase near the lower range. Price has slowed down after the recent sell-off, but the main structure is still bearish as long as gold remains below the descending trendline and below the $4,018 invalidation area.
From an SMC perspective, gold has already created multiple MSS confirmations to the downside. The current sideways movement looks more like liquidity accumulation than a clear bullish reversal. This means sellers may sti
XAUUSD: Main Trend Still BearishXAUUSD: Main Trend Still Bearish, Waiting for Confirmation Around 4,008
Market Context
Gold remains under strong bearish pressure after continuing to trade inside a clear downward structure. The latest price action shows that sellers are still controlling the market, while buyers are only trying to build a corrective rebound from the lower liquidity area.
At the moment, the key question is not whether gold has reversed, but whether price can hold above the 4,008 trendline area long enough to
XAUUSD – Bearish Structure Remains Strong Below IchimokuMASON XAUUSD – Bearish Structure Remains Strong Below Ichimoku
XAUUSD is trading around 3,971 after a strong bearish continuation. Price remains inside the descending channel and below the Ichimoku cloud, so the main structure is still bearish.
The priority view remains sell setups, especially if price retests the short-term sell zone.
Technical View
Gold is still moving in a clear downtrend channel. The market continues to create lower highs and lower lows, showing that sellers are controlli
MASON XAUUSD – Downtrend Still Dominates, Rebound Is Secondary
XAUUSD is trading around 4,062 after another strong bearish move. Price remains below the Ichimoku cloud and below the broken trendline, so the main structure is still bearish.
The primary view is sell continuation, while the secondary scenario is a short technical rebound before the next confirmation.
Technical View
Gold is still moving under clear bearish pressure after breaking the previous trendline support. The latest reaction around 4,054 shows that price is testing a strong liquidity
XAUUSD — Bearish Structure Holds Below EMA Resistance
Fundamental Analysis
Gold remains under short-term bearish pressure as price continues to trade below the main EMA structure. Traders are still watching USD momentum, Treasury yields, and upcoming U.S. macro data.
For now, the recovery attempts remain weak while price fails to reclaim the value range above.
Technical Analysis
On the 2H chart, XAUUSD is still trading below EMA 34, EMA 89, and EMA 200. This shows that the bearish structure remains active, with the EMA zone acting as dynamic r
MASON XAUUSD – Gold Breaks Trendline, Sell Continuation In Focus
XAUUSD is trading around 4,140 after a strong bearish move. Price has broken below the short-term rising trendline and remains below the Ichimoku cloud, showing that sellers are still controlling the structure.
The main view is sell continuation, especially if price retests the broken trendline or previous support zones.
Technical View
Gold has broken the rising trendline that previously supported the recovery wave. This is an important signal because the market is no longer respecting the s
XAUUSD — Medium-Term Buy Zone, Waiting For Liquidity Sweep
Gold is trading around $4,118 after rejecting from the short-term OB sell entry zone near $4,185–$4,198. Price has pulled back sharply, but the bigger focus is now shifting to the lower liquidity area.
From an SMC perspective, gold is moving toward a major demand zone where sell-side liquidity and the OB buy zone are sitting together. This area around $4,052–$4,085 is important because it was the origin of the previous bullish reaction and also sits above the strong low near $4,022.
The main
XAUUSD — Bearish Structure Continues, Liquidity Zones Remain Key
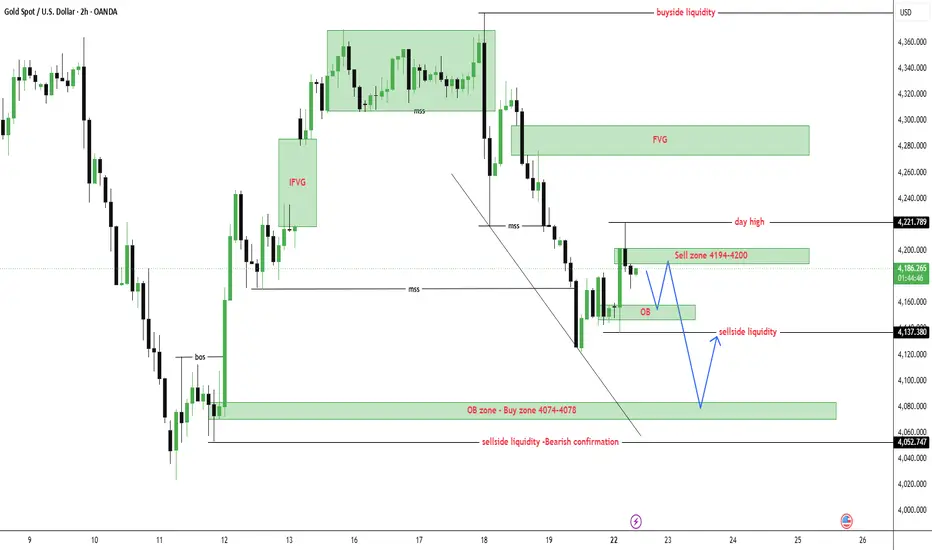
Gold is trading around $4,183 after failing to reclaim the day high near $4,221. Even with geopolitical tension still supporting volatility, the short-term structure remains bearish while price stays below the $4,194–$4,200 sell zone.
From an SMC perspective, gold has already rejected from the upper FVG area and continued to create lower structure. Price is now moving around a contested liquidity zone, where both buyers and sellers are active. This is why I do not want to chase price in the m
XAUUSD — EMA Downtrend Holds, Sell Position Remains Active
Fundamental Analysis
Gold remains under pressure as price continues to trade below the main EMA structure. Traders are still watching USD strength, Treasury yields, and upcoming U.S. macro data.
For now, the technical structure still favours sellers while recovery attempts are rejected from the value sell zone.
Technical Analysis
On the 1H chart, XAUUSD is trading below EMA 34, EMA 89, and EMA 200. The EMA structure is still pointing lower, showing that the short-term trend remains bearish
EURUSD — Corrective Bounce Before Deeper Bearish Continuation
Fundamental Analysis
EURUSD remains under pressure as price continues to trade below the main EMA structure. Traders are still watching USD momentum, Fed expectations, and upcoming macro data.
For now, the recovery looks corrective, not a confirmed bullish reversal. If price fails at the value sell zone, sellers may continue to control the next move.
Technical Analysis
On the 1H chart, EURUSD is still trading below EMA 34, EMA 89, and EMA 200. The EMA structure is above price, showing that
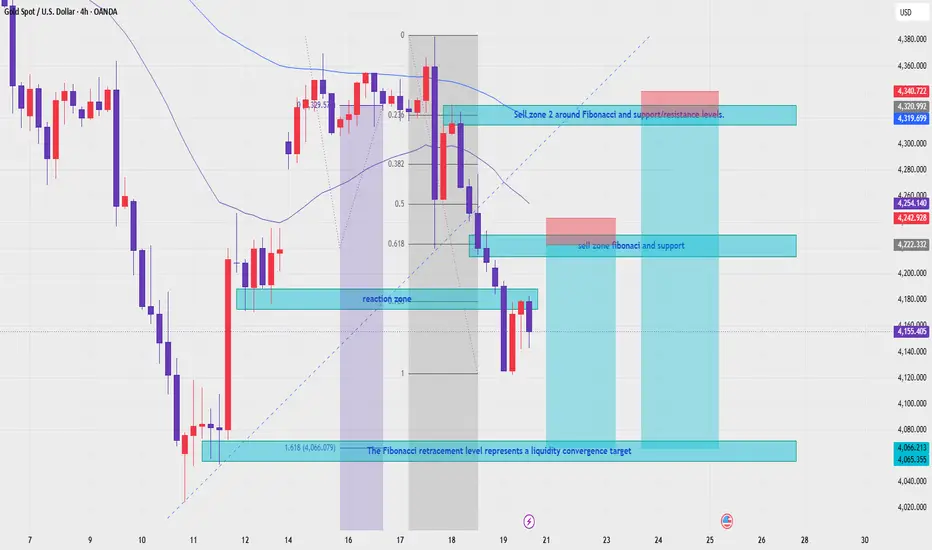
XAUUSD H4 — EMA Bearish TrendXAUUSD — EMA Bearish Trend, Two Sell Zones Toward Fibonacci Liquidity Target
Fundamental Analysis
Gold remains under bearish pressure as price continues to trade below the main EMA structure. The market is still watching USD strength, Treasury yields, and upcoming U.S. data, which may create volatility around key Fibonacci and liquidity zones.
For next week, the main view remains bearish while recovery attempts stay below the EMA resistance area.
Technical Analysis
On the 4H chart, XAUUSD i
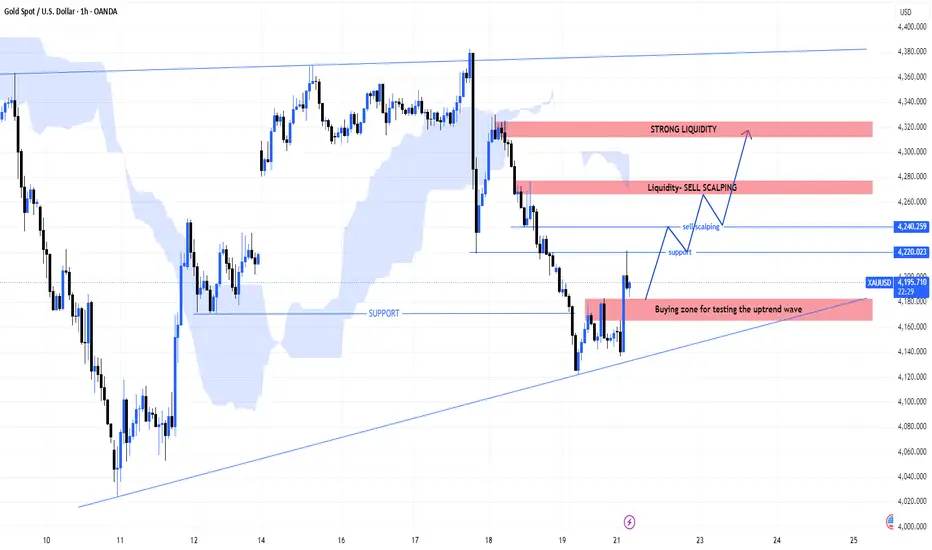
MASON XAUUSD – Gold Tests Uptrend Buy Zone
XAUUSD is trading around 4,191 at the start of the week. Price is reacting from the marked buy zone and still respecting the rising trendline, showing that buyers are trying to rebuild the short-term uptrend.
The main view is bullish recovery, but confirmation above 4,220–4,240 is still needed.
Technical View
Gold reacted accurately from the 4,160–4,180 buy zone, which is also close to the rising trendline support. This area is important because it shows where buyers are defending the curren
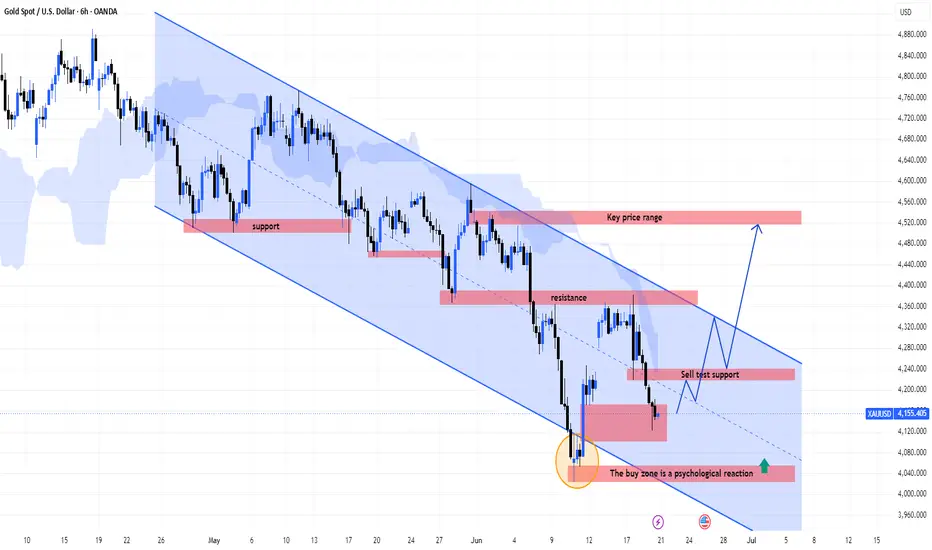
XAUUSD May Recover Into The Cloud Before A New Trend DecisionMASON XAUUSD – Gold May Recover Into The Cloud Before A New Trend Decision
XAUUSD is trading around 4,155 after reacting strongly from the lower liquidity area. Price is still inside the descending channel and remains below the Ichimoku cloud, so the larger structure is not bullish yet.
However, after filling the liquidity gap and reacting from the psychological buy zone, gold may form a technical recovery before choosing the next direction.
Technical View
Gold is still moving inside a clear
#SOBHA CUP and HANDLE formed in monthly timeframe🔵 TECHNICAL SETUP
An CUP and HANDLE chart pattern has been formed in the monthly timeframe in SOBHA ltd. It had broken out of its all time high of 1200 around Jan 2024 and has been consolidating since at lower volume which validates the bullish setup. The trendines suggest that the consolidation phase might be soon over and the stock may turn bullish in the upcoming months. RSI also suggest that the stock is currently neutral. This setup makes it a attractive buy around 1600-1700 if the breakout
GBPUSD — Bearish Continuation From EMA & Fibonacci Value Zone
Fundamental Analysis
GBPUSD remains under pressure as price continues to trade below the main EMA structure. For next week, traders should keep watching USD momentum, U.K. data, and broader risk sentiment.
For now, the technical structure still favours sellers while recovery attempts remain capped below EMA resistance.
Technical Analysis
On the 4H chart, GBPUSD is still moving inside a bearish structure, with EMA 34, EMA 89, and EMA 200 positioned above price. This confirms that the broade
EURUSD — Bearish Continuation From Fibonacci Value Zones
Fundamental Analysis
EURUSD remains under pressure as price trades below the main EMA structure. For next week, traders should continue watching USD momentum, Fed expectations, and upcoming U.S. data, as these factors may drive volatility around key Fibonacci zones.
For now, the technical structure still favours sellers while recovery attempts remain capped below EMA resistance.
Technical Analysis
On the 4H chart, EURUSD is still moving inside a descending structure. EMA 34, EMA 89, and EM
ADANIENT: Massive Trendline Break and Explosive Macro Breakout 1. The Macro Perspective: The Squeeze and The Floor
I am taking a LONG bias on Adani Enterprises Limited (ADANIENT) on the daily (1D) timeframe.
When analyzing pure market structure, the most violent reversals happen when a major descending trend is broken. Look at the structural development on the left half of this chart. The stock suffered a deep, agonizing markdown phase, with every attempted rally being aggressively swatted down by that massive descending black trendline. This brutal correc
XAUUSD — EMA Consolidation Before Bearish Continuation
Fundamental Analysis
Gold remains under short-term pressure as traders continue to watch USD momentum, Treasury yields, and upcoming U.S. macro data.
For now, the recovery has not confirmed a bullish reversal. Price is still reacting around the EMA area, so the current move may be only a short-term consolidation before sellers attempt another push lower.
Technical Analysis
On the 2H chart, XAUUSD is trading around 4,304 after a strong rejection from the upper value range. Price is now cons
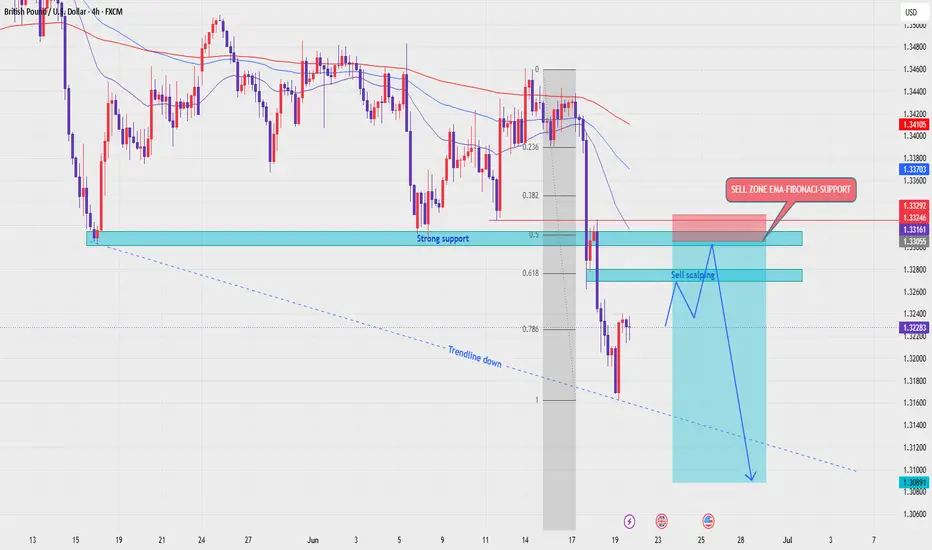
GBPUSD — Sell From EMA Value Zone & Fibonacci Levels
Fundamental Analysis
GBPUSD remains under short-term pressure as traders continue to watch USD strength, U.K. data, and upcoming macro events.
For now, the recovery has not confirmed a bullish reversal. Price is still trading below the key EMA resistance area, so pullbacks into value may continue to offer sell opportunities.
Technical Analysis
On the 2H chart, GBPUSD is trading around 1.3323 after a sharp bearish move from the upper range. Price is currently reacting near the strong suppor
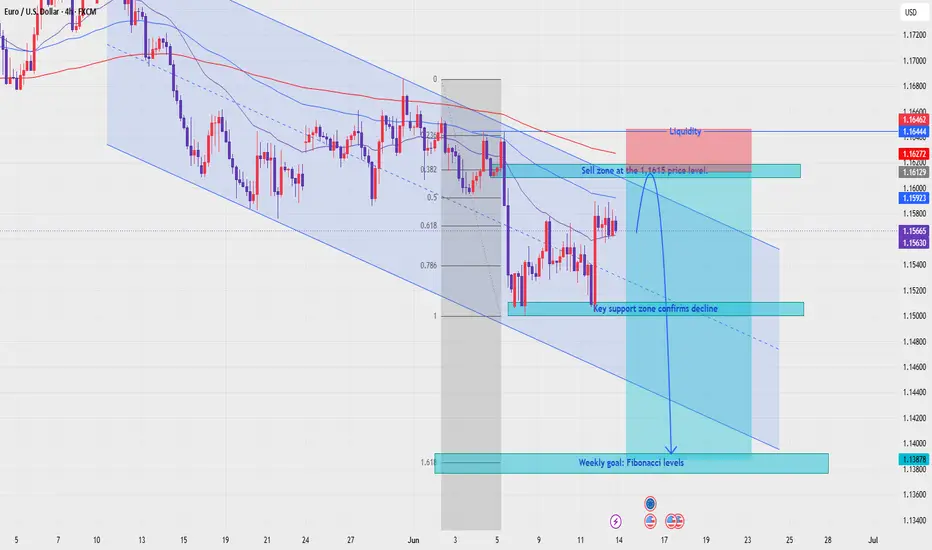
EURUSD — EMA Bearish Trend, Sell From Value Zone
Fundamental Analysis
EURUSD remains under pressure as the market continues to watch USD momentum, Fed expectations, and upcoming U.S. macro data. If the dollar stays supported, recovery attempts on EURUSD may remain limited.
For next week, the main focus is whether price can retest the value zone above before continuing lower in line with the EMA trend.
Technical Analysis
On the 4H chart, EURUSD is still trading inside a descending channel. EMA 34, EMA 89, and EMA 200 remain above price, sh
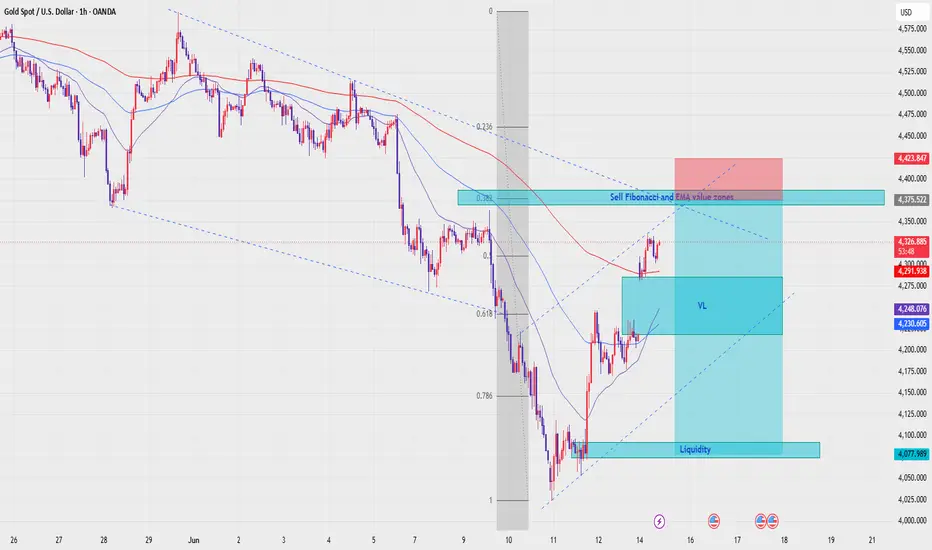
XAUUSD — Sell From Fibonacci & EMA Value Zone
Fundamental Analysis
Gold remains sensitive as traders continue to watch USD strength, Treasury yields, and upcoming U.S. macro data. While the recent recovery is visible, the broader structure still stays under EMA resistance.
For now, any upside move should be treated as a corrective pullback unless gold can break and hold above the main EMA value zone.
Technical Analysis
On the 1H chart, XAUUSD is recovering from the lower liquidity area around 4,077, but the main trend is still under b
XAUUSD -Strong Bullish Reaction After FOMC Strong Bullish Reaction After FOMC, Buy Retest Remains Priority
Gold is trading around $4,320 after a strong bullish reaction following the FOMC move. Price swept the weekly low near $4,219, then recovered sharply and reclaimed short-term structure.
From an SMC perspective, the market has already shown CHoCH and strong bullish displacement. The current pullback into $4,311–$4,320 is important because this area aligns with the FVG and retest liquidity zone. As long as gold holds above this zon