AUD/JPY Potential Pullback SetupThe Australian Dollar is approaching a key resistance zone near 114.70 after a steady uptrend. Price action shows rejection at this level, with potential downside targets around 113.17–112.11. Traders should watch for confirmation of reversal or breakout before positioning…
Australian Dollar / Japanese Yen
No trades
No trades
Compare with AUD to JPY
Details
This pair is the Australian Dollar against the Japanese Yen. In regards to U.S. equities on a short to medium term basis, it is often one of the most highly correlated pairs to price action. The pair tends to decline is a risk off approach and rise in a low risk environment on carry flows.
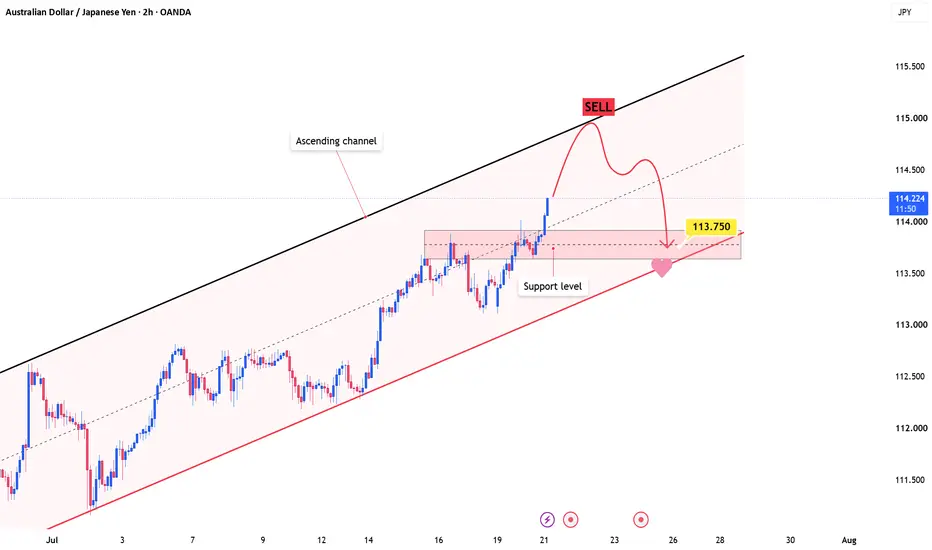
AUDJPY: A Pullback May Come Before the Trend ResumesAUDJPY is still moving inside a clear ascending channel, and the broader bullish structure remains intact. The latest push higher has been strong, but price is now trading well above the recent support area, so a short-term pullback would be natural.
The key zone to watch is around 113.750, where p
AUDJPY Bearish ScenarioOn Daily chart it created a bearish divergence. Since then, its trading within the channel.
On top of it There is a sharp retracement from its daily FVG within the channel.
I am still waiting for it to cross my Bearish Area to go Bearish and eying onto 109.50
Sell around 112.25 area but wait for
#AUDJPY NEXT MOVE POSSIBLE#AUDJPY UPDATE...!!!
Sell limited - 113.650 - 113.950
If price stay below 114.800, then next target 112.800 and 111.300 and above that 115.000
Plan;If price break 113.650-113.950 area,and stay below 113.800 ,we will place sell order in AUDJPY with target 112.800 and 111.300 & stop loss should be
AUDJPY SELL SETUP🚨 AUDJPY SELL SETUP 🚨
📍 Supply Zone Rejection
⚡ Clean Institutional Level
🐻 Sellers Waiting at Premium Price
💡 Trade Plan:
➡️ Price taps supply zone
➡️ Rejection confirmation candle
➡️ Execute SELL with discipline
🎯 Target:
📉 Previous Demand / Liquidity Sweep
🛑 Stop Loss:
🔺 Above Supply Invalidi
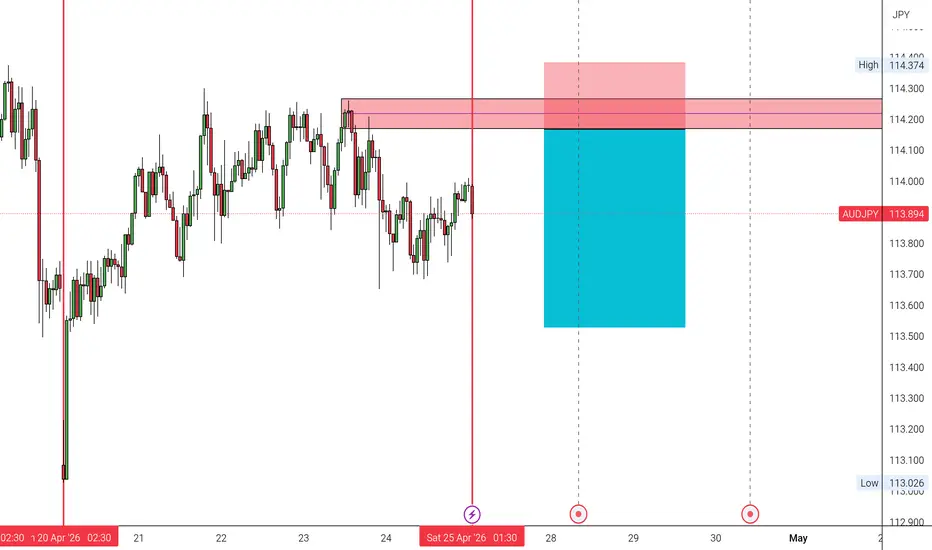
AUDJPY – Rejection at Key Supply ZoneAUDJPY – Rejection at Key Supply Zone 🔴📉
Price has tapped into a strong supply zone (114.20–114.30) and showing clear rejection signs.
Market structure is still ranging, but this zone has historical selling pressure.
Plan: • Waiting for confirmation (bearish rejection / weak retest)
• Entry after c
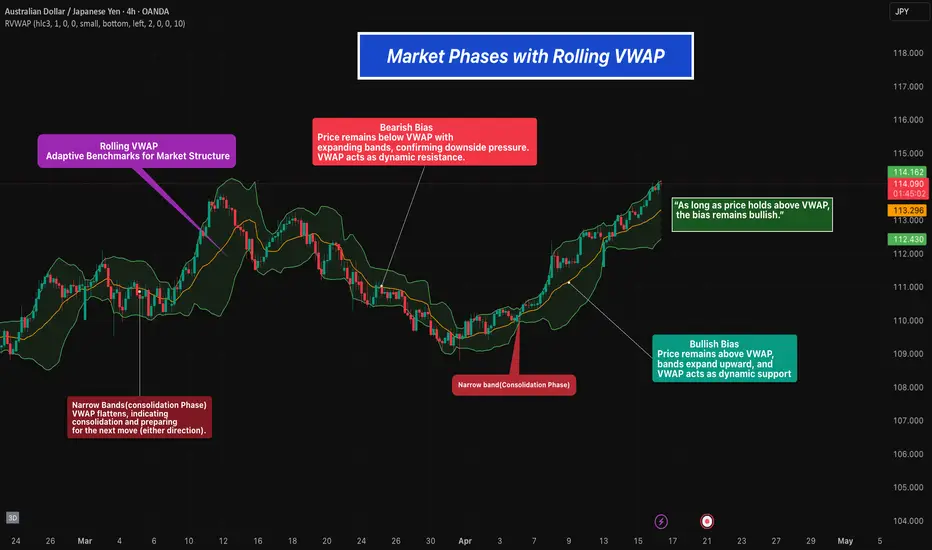
Market Phases with Rolling VWAP📘Overview
Rolling VWAP helps define market structure by identifying different phases of price behavior.
Instead of using VWAP as just a single line, combining it with expanding and contracting bands allows us to understand whether the market is trending or consolidating.
⸻⸻⸻⸻⸻⸻⸻⸻⸻
📉 Key Price A
AUDJPY at Strong Supply ZoneAUDJPY has reached a key supply zone on HTF, showing a potential reversal area 💎
After a strong bullish push, price is now entering a fresh supply zone, where sellers are likely to step in.
🔍 Market Structure:
Strong bullish move → into supply
Clear resistance zone (unmitigated)
Price slowing down
AUDJPY ANALYSIS ON (06 APR 2026)#AUDJPY UPDATEDE
Current price - 110.170
If price stay below 110.700, then next target 109.600,109.200 and 108.800 and above that 111.500
Plan;If price break 110.300-110.400 area,and stay below 110.700 ,we will place sell order in AUDJPY with target of 109.600,109.200 and 108.800 & stop loss sho
See all ideas
Summarizing what the indicators are suggesting.
Oscillators
Neutral
SellBuy
Strong sellStrong buy
Strong sellSellNeutralBuyStrong buy
Oscillators
Neutral
SellBuy
Strong sellStrong buy
Strong sellSellNeutralBuyStrong buy
Summary
Neutral
SellBuy
Strong sellStrong buy
Strong sellSellNeutralBuyStrong buy
Summary
Neutral
SellBuy
Strong sellStrong buy
Strong sellSellNeutralBuyStrong buy
Summary
Neutral
SellBuy
Strong sellStrong buy
Strong sellSellNeutralBuyStrong buy
Moving Averages
Neutral
SellBuy
Strong sellStrong buy
Strong sellSellNeutralBuyStrong buy
Moving Averages
Neutral
SellBuy
Strong sellStrong buy
Strong sellSellNeutralBuyStrong buy
Displays a symbol's price movements over previous years to identify recurring trends.
Frequently asked questions
The current rate of AUDJPY is 111.576 JPY — it has increased by 0.06% in the past 24 hours. See more of AUDJPY rate dynamics on the detailed chart.
The value of the AUDJPY pair is quoted as 1 AUD per x JPY. For example, if the pair is trading at 1.50, it means it takes 1.5 JPY to buy 1 AUD.
The term volatility describes the risk related to the changes in an asset's value. AUDJPY has the volatility rating of 0.23%. Track all currencies' changes with our live Forex Heatmap and prepare for markets volatility.
The AUDJPY showed a 0.74% rise over the past week, the month change is a −1.05% fall, and over the last year it has increased by 16.39%. Track live rate changes on the AUDJPY chart.
Learn how you can make money on rate changes in numerous trading ideas created by our community.
AUDJPY is a minor currency pair, i.e. a popular pair that is not associated with USD. Such pairs are also called cross currency pairs.
Currencies are usually traded through forex brokers — choose the one that suits your needs and go ahead. You can trade AUDJPY right from TradingView charts — just log in to you broker account. Check out the list of our integrated brokers and find the best one for your needs and strategy.
When deciding to buy or sell currency one should keep in mind many factors including current geopolitical situation, interest rates, and other. But before plunging into a deep research, you can start with AUDJPY technical analysis. The technical rating for the pair is sell today, but don't forget that markets can be very unstable, so don't stop here. According to our 1 week rating the AUDJPY shows the neutral signal, and 1 month rating is buy. See more of AUDJPY technicals for a more comprehensive analysis.