BTC/USD Bullish Reversal Setup – Market Retest OpportunityBitcoin CME Futures (1H) is showing a potential bullish reversal after completing a rounded bottom formation near the 70,000 support zone. Price has recovered from recent lows and is moving toward the key resistance level around 73,040. A successful breakout and retest of this resistance could confi
Peers for comparison
The Monthly Bearish FVG Flip (IFVG)The "Flip" Narrative:
A key component of my analysis is monitoring the Monthly Bearish FVG. In a bearish delivery, this zone should act as resistance. However, if price closes above this gap with strong displacement, it "flips" the zone into an Inversion Fair Value Gap (IFVG).
Bullish Confirmation:
Bitcoin Stabilisation Signals Base-Building Under Macro PressureBitcoin’s recent price action has been quietly at odds with its macro environment.
By mid-March 2026, it found itself in an unusual position: the macro backdrop had turned decisively hostile. Oil prices were surging, U.S. rate-cut expectations had largely evaporated (with rates unchanged eventual
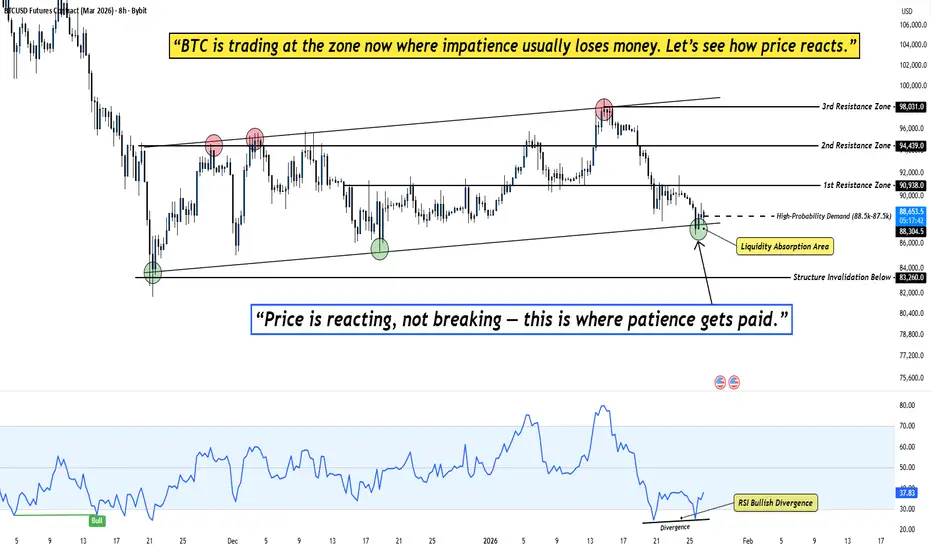
Bitcoin at Demand: Where Most Traders Panic and Smart Money WaitWhen I look at this chart, I don’t see weakness.
I see price reacting exactly where it should .
Bitcoin is sitting above a clearly defined demand zone, and instead of collapsing, price is slowing down and compressing.
That usually tells me the market is absorbing liquidity, not distributing .
K
BTC Compression Phase: Where Smart Money Builds Positions!Hey guy's, When I look at this chart, I’m not seeing fear or trend failure.
I’m seeing something far more important, controlled compression above demand .
Bitcoin has pulled back, swept liquidity, and is now holding above a clearly defined demand area while volatility keeps contracting.
This kind
Bitcoin Next move $70k or $120k?CRYPTOCAP:BTC Is About to Bounce From the Level Everyone Is Ignoring
CME Gap 👉 $91,170
FVG below 👉 $89,020
Both zones = liquidity magnets.
No upside CME gaps left… only 1 upside FVG at $120,370
My view:
Fill → Sweep → Strong bounce expected from $89K–$91K range.
Next major draw = $120K FVG.
NF
BITCOIN CME Gap Alert: CME GAP around $91000BITCOIN CME Gap Alert:
As per CME chart, Bitcoin still has an unfilled gap between $91,970 – $92,730.
In my opinion, BTC must revisit around $91,970 to fully close this gap.
Price usually returns to CME gaps because they act as liquidity zones and market inefficiencies, the market tends to fill th
See all ideas
A representation of what an asset is worth today and what the market thinks it will be worth in the future.
Displays a symbol's price movements over previous years to identify recurring trends.
Frequently asked questions
One way to gain exposure to BTCH2019 is through a broker that offers futures. Before trading, make sure you understand how the product works and the risks involved.
You can trade BTCH2019 directly from TradingView:
– Choose a broker: Explore our supported trading partners and pick one that fits your needs
– Compare options: View available brokers side by side to evaluate fees and features
– Connect your account: Open Supercharts, click "Trade", select your broker, and log in
– Start trading: Place orders directly from the chart
Tip: If you're new to trading, try paper trading first — it lets you practice strategies in real market conditions without risking funds.
You can trade BTCH2019 directly from TradingView:
– Choose a broker: Explore our supported trading partners and pick one that fits your needs
– Compare options: View available brokers side by side to evaluate fees and features
– Connect your account: Open Supercharts, click "Trade", select your broker, and log in
– Start trading: Place orders directly from the chart
Tip: If you're new to trading, try paper trading first — it lets you practice strategies in real market conditions without risking funds.
The nearest expiration date for BTCH2019 is Mar 29, 2019.
Futures contracts expire on predetermined dates. As expiration approaches, many traders roll positions into the next contract to maintain exposure to the market.
Key metrics to watch near expiration:
• Volume and liquidity: Trading activity often shifts to the next contract month
• Open interest: Falling open interest may signal positions being closed or rolled forward
• Forward curve: Differences between contract prices can help identify market structure, including contango and backwardation
Explore the BTCH2019 chart to monitor active contracts and contract-month activity.
Futures contracts expire on predetermined dates. As expiration approaches, many traders roll positions into the next contract to maintain exposure to the market.
Key metrics to watch near expiration:
• Volume and liquidity: Trading activity often shifts to the next contract month
• Open interest: Falling open interest may signal positions being closed or rolled forward
• Forward curve: Differences between contract prices can help identify market structure, including contango and backwardation
Explore the BTCH2019 chart to monitor active contracts and contract-month activity.