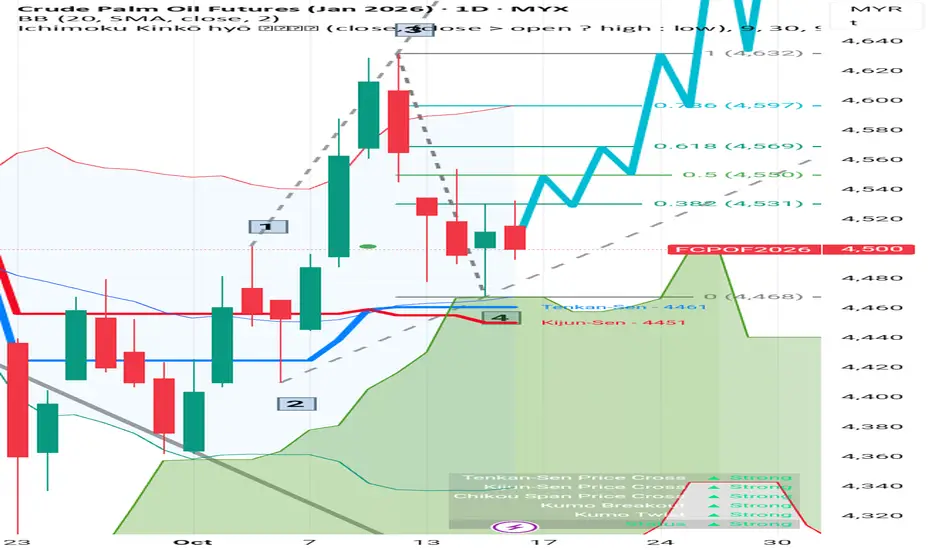
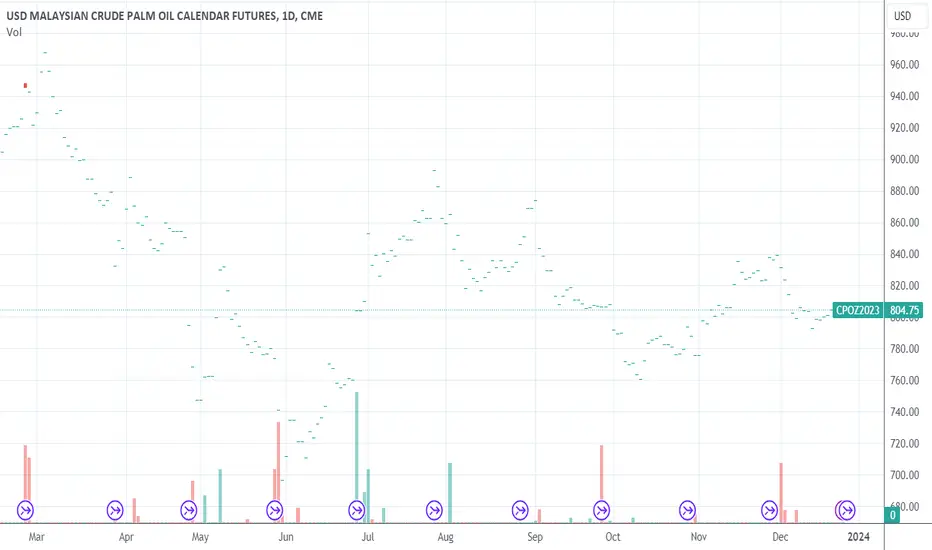
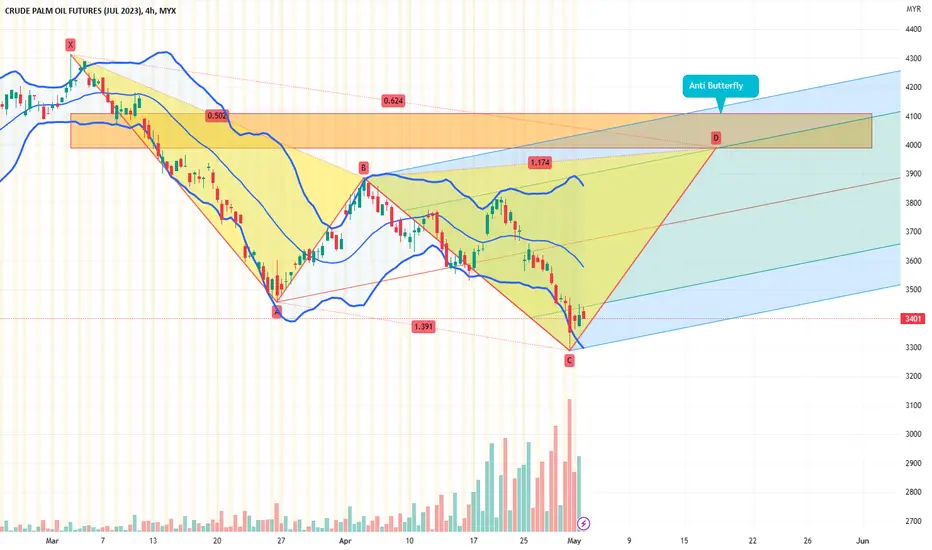
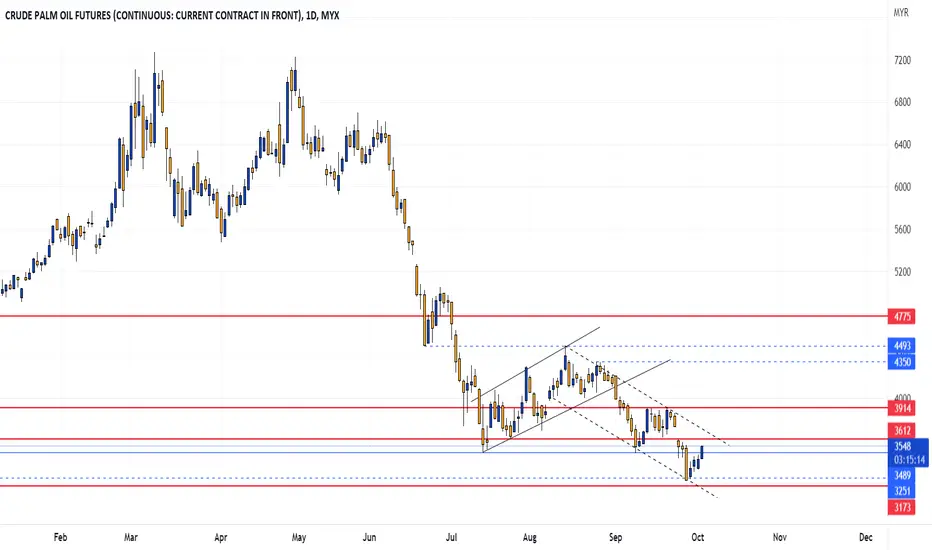
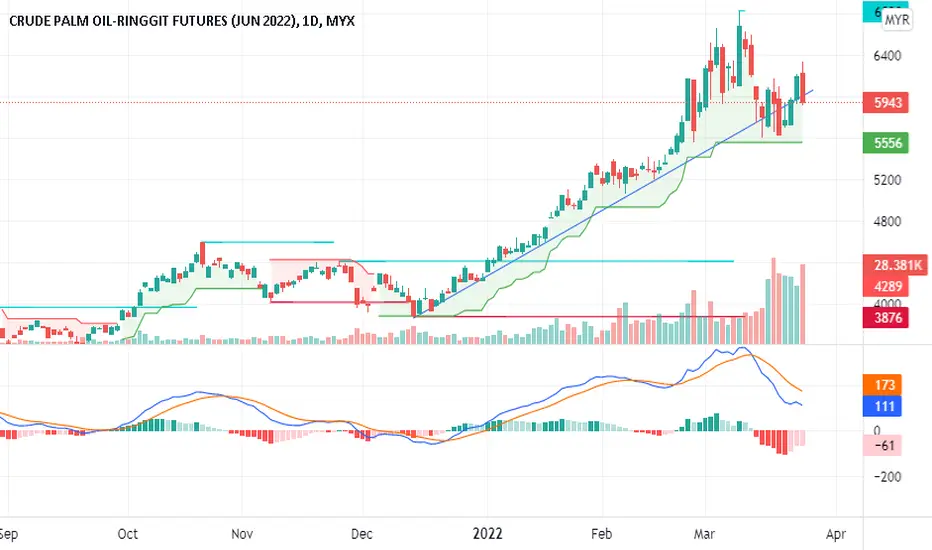
Crude Palm Oil Futures (FCPOF2026) is in an intermediate uptrendDespite the minor pullback on October 16 (the current day). Market is attempting to consolidate above the 20-day SMA and is showing strong bullish signs based on the Ichimoku indicator, with a near-term target potentially towards the 4,700–4,800 MYR level.
Peers for comparison
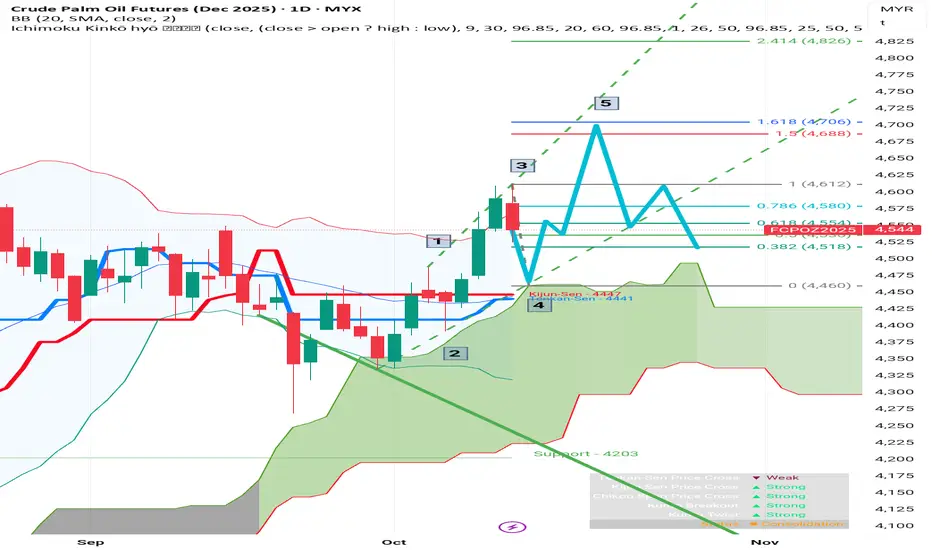
a bullish outlook, following EW impulse patternIdentified a potential 5-wave upward impulse move starting from the low in early October.
Wave 3 appears to have just completed, reaching a high of 4,612. This wave is typically the strongest and longest.
The chart projects a corrective Wave 4 is now underway. The blue line indicates a potential p
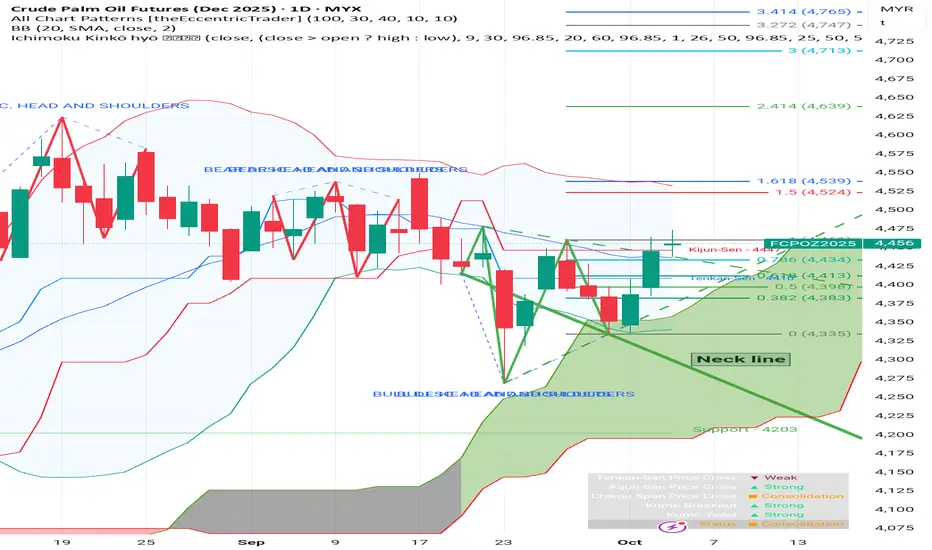
Potential Inverse H&SA descending trendline has been drawn, connecting the peaks between the shoulders and the head. A decisive break and close above this neckline would be a bullish confirmation signal, suggesting a potential trend reversal to the upside.
Ichimoku Cloud Analysis:
The price is currently trading inside
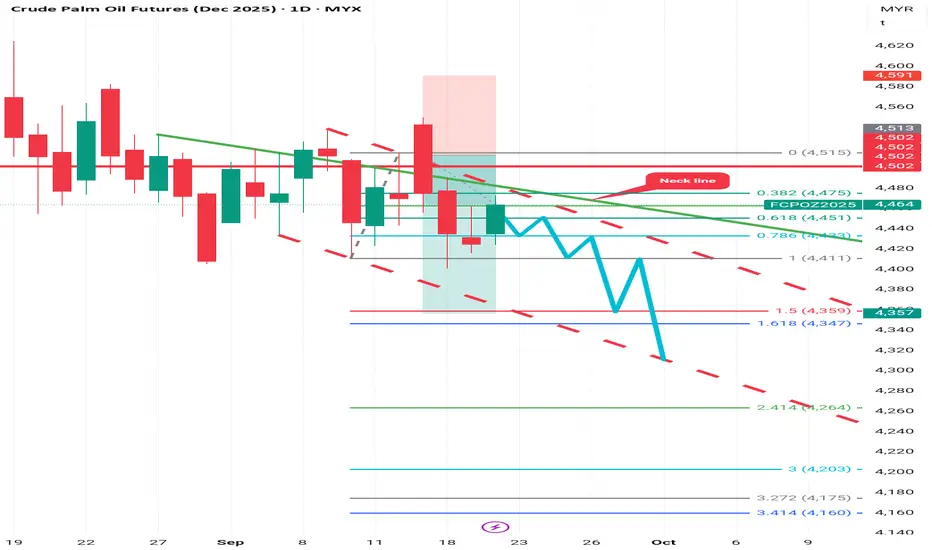
A baerish outlook for fcpo pricesA potential Head and Shoulders pattern, which is a classic bearish reversal formation. The chart has labeled "Neck line" around the MYR 4,475 price level. A decisive break below this neckline would confirm the pattern and signal a potential move lower.
Fibonacci Retracement: A Fibonacci retracement
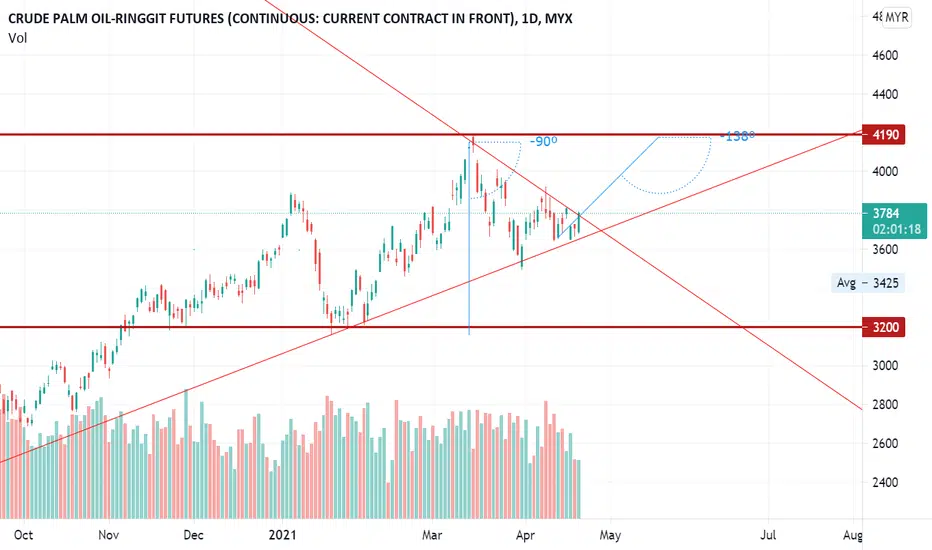
Malaysian Palm Oil Hovers around MYR 3,780Malaysian palm oil futures traded around MYR 3,780 per tonne, extending gains from the prior session amid strength in rival edible oils. Prospects of lower production because of dry weather and declining inventories also lifted sentiment. Malaysia's palm oil stocks at the end of November fell after
See all ideas
A representation of what an asset is worth today and what the market thinks it will be worth in the future.
Displays a symbol's price movements over previous years to identify recurring trends.
Frequently asked questions
One way to gain exposure to FCPOX2019 is through a broker that offers futures. Before trading, make sure you understand how the product works and the risks involved.
You can trade FCPOX2019 directly from TradingView:
– Choose a broker: Explore our supported trading partners and pick one that fits your needs
– Compare options: View available brokers side by side to evaluate fees and features
– Connect your account: Open Supercharts, click "Trade", select your broker, and log in
– Start trading: Place orders directly from the chart
Tip: If you're new to trading, try paper trading first — it lets you practice strategies in real market conditions without risking funds.
You can trade FCPOX2019 directly from TradingView:
– Choose a broker: Explore our supported trading partners and pick one that fits your needs
– Compare options: View available brokers side by side to evaluate fees and features
– Connect your account: Open Supercharts, click "Trade", select your broker, and log in
– Start trading: Place orders directly from the chart
Tip: If you're new to trading, try paper trading first — it lets you practice strategies in real market conditions without risking funds.
The nearest expiration date for FCPOX2019 is Nov 15, 2019.
Futures contracts expire on predetermined dates. As expiration approaches, many traders roll positions into the next contract to maintain exposure to the market.
Key metrics to watch near expiration:
• Volume and liquidity: Trading activity often shifts to the next contract month
• Open interest: Falling open interest may signal positions being closed or rolled forward
• Forward curve: Differences between contract prices can help identify market structure, including contango and backwardation
Explore the FCPOX2019 chart to monitor active contracts and contract-month activity.
Futures contracts expire on predetermined dates. As expiration approaches, many traders roll positions into the next contract to maintain exposure to the market.
Key metrics to watch near expiration:
• Volume and liquidity: Trading activity often shifts to the next contract month
• Open interest: Falling open interest may signal positions being closed or rolled forward
• Forward curve: Differences between contract prices can help identify market structure, including contango and backwardation
Explore the FCPOX2019 chart to monitor active contracts and contract-month activity.