Multi-Timeframe CHOCH + BOS Strategy1. Trend Identification (1H)
• Bullish CHOCH + Bullish BOS = Bullish Trend
• Bearish CHOCH + Bearish BOS = Bearish Trend
2. Location
• Wait for price to retrace into the 1H Order Block (Demand for longs, Supply for shorts).
3. Confirmation (5M)
• Long: 5M candle closes above the latest fractal hig
Compare with Indian Oil Corp. Ltd.
24.44 INR
420.96 B INR
7.77 T INR
3.74 B
Next report date
—
Report period
—
EPS estimate
—
Revenue estimate
—
Company info
Sector
Industry
Website
Headquarters
New Delhi
Founded
1959
IPO date
Oct 9, 1995
ISIN
INE242A01010
FIGI
BBG000C1K6Q9
Identifiers
ISIN INE242A01010
Indian Oil Corp. Ltd. is a holding company, which engages in refining, pipeline transportation, and marketing of petroleum products. It also explores and produces crude oil and gas; and markets natural gas and petrochemicals. It operates through the following business segments: Petroleum Products, Petro-Chemicals, and Other Businesses. The Other Businesses segment covers the sale of gas, explosives, and cryogenics; wins mill and solar power generation; and oil and gas exploration activities. The company was founded on June 30, 1959 and is headquartered in New Delhi, India.
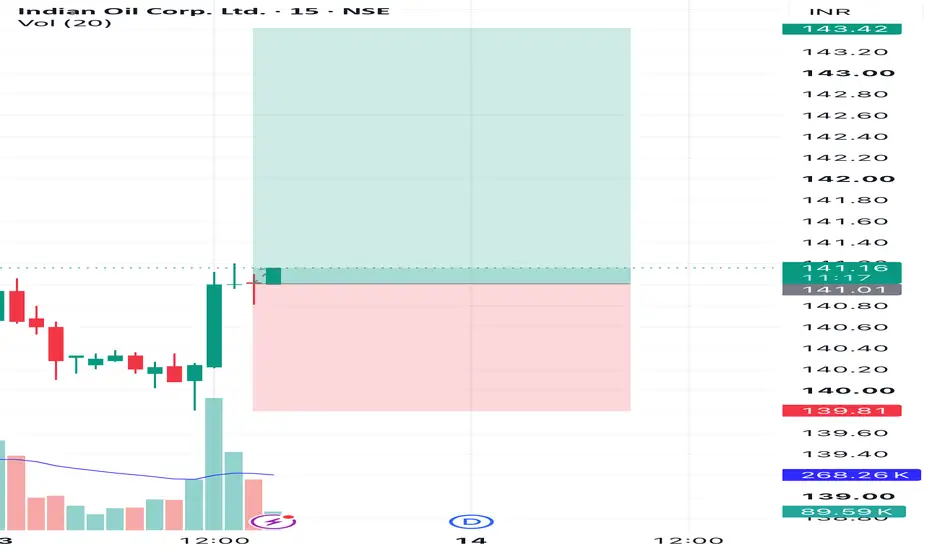
Liquidity sweep in 15 min candleLiquidity sweep occurred at 11:45 am on the 15-minute chart, followed by a break of structure. Then I waited for a little retracement, and now it's time to enter on a hammer candle. You can put a risk-reward ratio of 1:2. Thank me later. It is a high-probability setup.
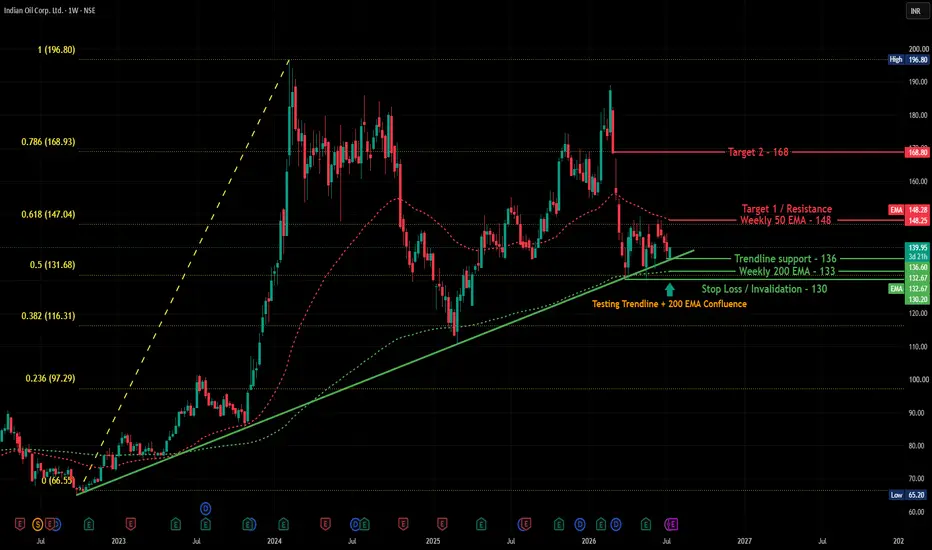
IOC Trendline Support Holds, Valuation Backs the Technical StoryOverview
Indian Oil Corporation is holding right at a confluence of technical support on the weekly chart, while also trading at valuations that stand out favorably against its refining peers. This is a good example of technical and fundamental pictures lining up — worth examining both together.
Te
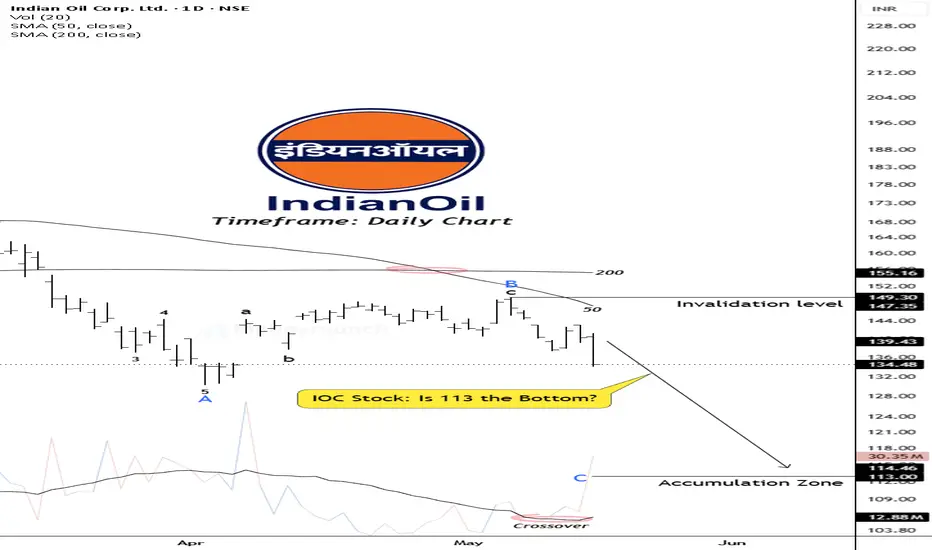
Indian Oil Corporation (IOC) — Elliott Wave Research PerspectiveIndian Oil Corporation appears to be trading within a broader bearish structure on the daily timeframe, with price action continuing below both the 50-day and 200-day moving averages — indicating sustained medium-term weakness.
Wave C appears to have resumed downward momentum after rejection
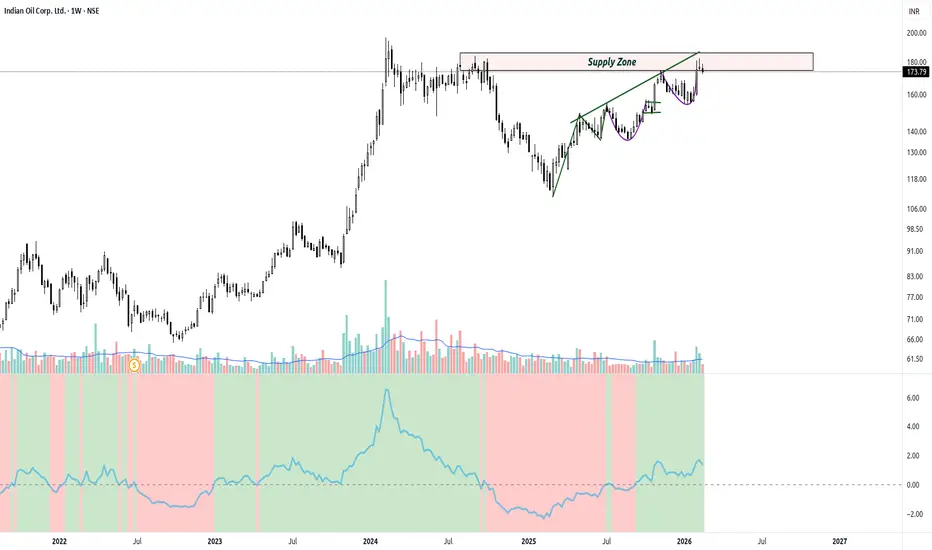
IOC: Approaching Major Supply Zone- Wait for BOThe Core Thesis: Structural Strength Meeting Resistance
IOC remains in a robust long-term uptrend, characterized by a series of Break of Structure (BOS) levels. However, unlike its peers who have more "open air" above them, IOC is currently knocking on the door of a significant Supply Zone (₹180–₹1
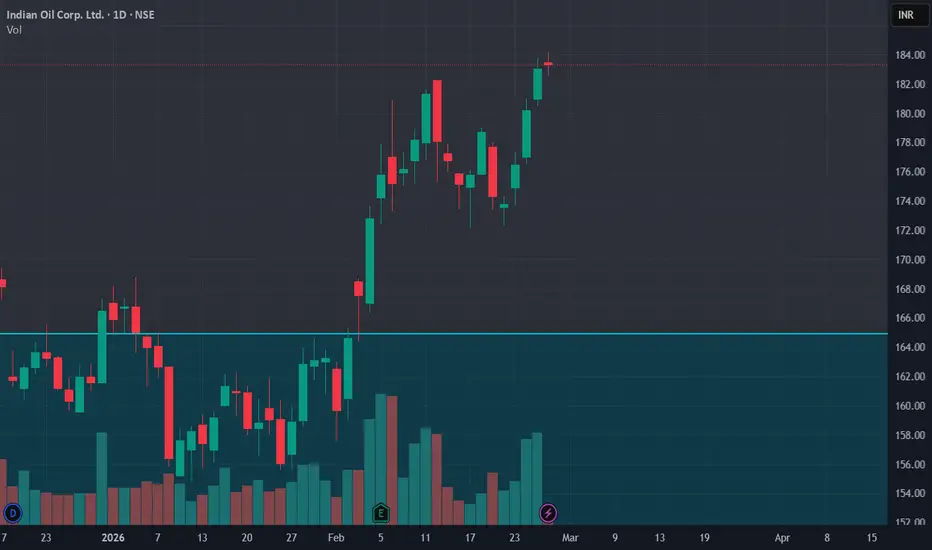
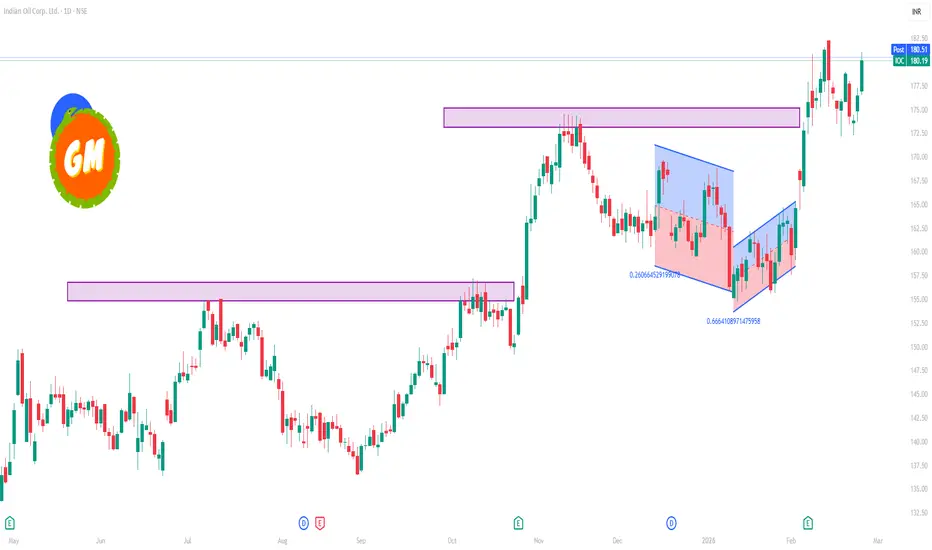
IOC 1 Day Time Frame 📈 Live 1-Day Price Snapshot
Current price (latest traded): ~₹176.5 – ₹179 range during today’s trade on NSE.
Today’s high: ~₹179.5
Today’s low: ~₹176.5
52-week range: ~₹110.7 – ₹182.3.
📊 Daily Pivot / Support & Resistance (Approx)
These are intraday/1D pivot levels calculated based on recent price
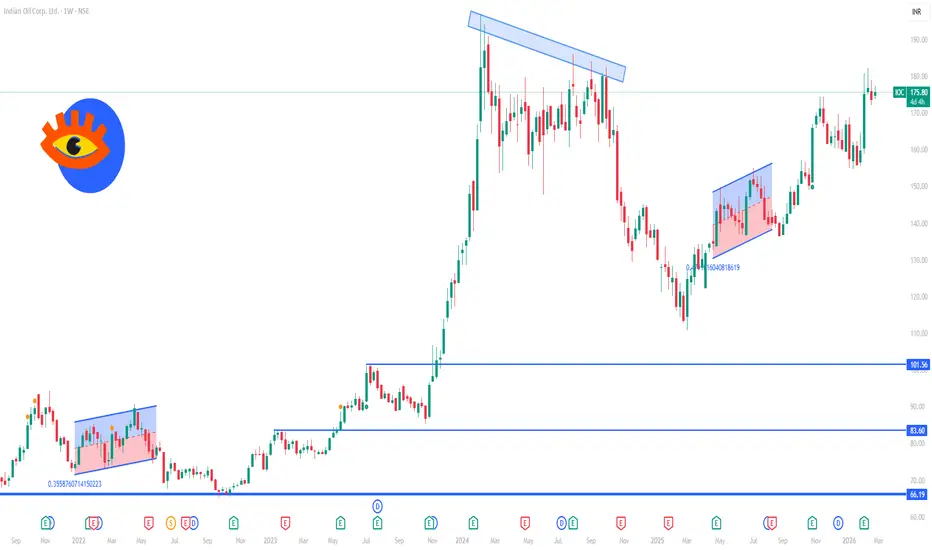
IOC 1 Week Time Frame 📌 Current Price Context (approx): ~₹175–₹176 per share (today’s trading range) — still near the 52-week high zone.
📍 1-Week Technical Levels (Support & Resistance)
🔹 Weekly Pivot & Key Levels
(Weekly pivots capture the balance between buyers & sellers for this week)
• Weekly Support 1 (S1): ~₹170.
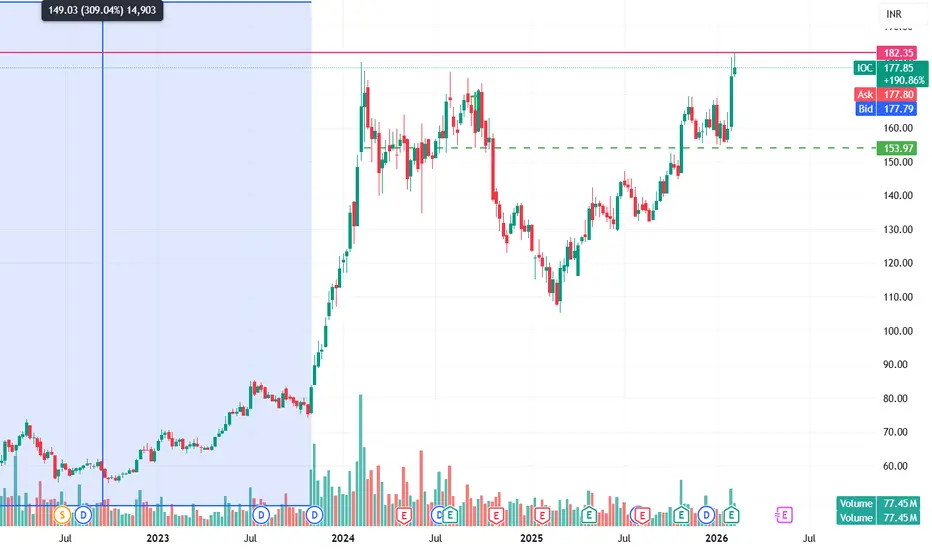
IOC – 7+ Years Mega Breakout in the MakingIOC is not setting up for a routine breakout. The stock is attempting to emerge from a massive 7–8 year consolidation phase, making this a potential multi-year structural breakout rather than a short-term move.
Since 2017, IOC has repeatedly faced selling pressure near the 180–190 resistance zone,
See all ideas
Summarizing what the indicators are suggesting.
Neutral
Neutral
Neutral
An aggregate view of professional's ratings.
Neutral
Neutral
Neutral
Displays a symbol's price movements over previous years to identify recurring trends.
Frequently asked questions
The current price of IOC is 125.85 INR — it has decreased by −0.79% in the past 24 hours. Watch Indian Oil Corp. Ltd. stock price performance more closely on the chart.
Depending on the exchange, the stock ticker may vary. For instance, on NSE exchange Indian Oil Corp. Ltd. stocks are traded under the ticker IOC.
IOC stock has fallen by −5.38% compared to the previous week, the month change is a −6.46% fall, over the last year Indian Oil Corp. Ltd. has showed a −18.13% decrease.
We've gathered analysts' opinions on Indian Oil Corp. Ltd. future price: according to them, IOC price has a max estimate of 230.00 INR and a min estimate of 105.00 INR. Watch IOC chart and read a more detailed Indian Oil Corp. Ltd. stock forecast: see what analysts think of Indian Oil Corp. Ltd. and suggest that you do with its stocks.
IOC stock is 0.97% volatile and has beta coefficient of 1.18. Track Indian Oil Corp. Ltd. stock price on the chart and check out the list of the most volatile stocks — is Indian Oil Corp. Ltd. there?
Today Indian Oil Corp. Ltd. has the market capitalization of 1.79 T, it has decreased by −2.01% over the last week.
Yes, you can track Indian Oil Corp. Ltd. financials in yearly and quarterly reports right on TradingView.
Indian Oil Corp. Ltd. is going to release the next earnings report on Nov 14, 2026. Keep track of upcoming events with our Earnings Calendar.
IOC earnings for the last quarter are −1.18 INR per share, whereas the estimation was −7.42 INR resulting in a 84.09% surprise. The estimated earnings for the next quarter are 3.67 INR per share. See more details about Indian Oil Corp. Ltd. earnings.
Indian Oil Corp. Ltd. revenue for the last quarter amounts to 2.82 T INR, despite the estimated figure of 2.34 T INR. In the next quarter, revenue is expected to reach 2.55 T INR.
IOC net income for the last quarter is −16.31 B INR, while the quarter before that showed 144.58 B INR of net income which accounts for 0.00% change. Track more Indian Oil Corp. Ltd. financial stats to get the full picture.
Indian Oil Corp. Ltd. dividend yield was 6.09% in 2025, and payout ratio reached 26.99%. The year before the numbers were 2.35% and 30.38% correspondingly. See high-dividend stocks and find more opportunities for your portfolio.
As of Oct 13, 2026, the company has 29.65 K employees. See our rating of the largest employees — is Indian Oil Corp. Ltd. on this list?
EBITDA measures a company's operating performance, its growth signifies an improvement in the efficiency of a company. Indian Oil Corp. Ltd. EBITDA is 690.60 B INR, and current EBITDA margin is 10.29%. See more stats in Indian Oil Corp. Ltd. financial statements.
Like other stocks, IOC shares are traded on stock exchanges, e.g. Nasdaq, Nyse, Euronext, and the easiest way to buy them is through an online stock broker. To do this, you need to open an account and follow a broker's procedures, then start trading. You can trade Indian Oil Corp. Ltd. stock right from TradingView charts — choose your broker and connect to your account.
Investing in stocks requires a comprehensive research: you should carefully study all the available data, e.g. company's financials, related news, and its technical analysis. So Indian Oil Corp. Ltd. technincal analysis shows the sell today, and its 1 week rating is strong sell. Since market conditions are prone to changes, it's worth looking a bit further into the future — according to the 1 month rating Indian Oil Corp. Ltd. stock shows the sell signal. See more of Indian Oil Corp. Ltd. technicals for a more comprehensive analysis.