Compare with E-mini Natural Gas Futures (Dec 2021)
Contract highlights
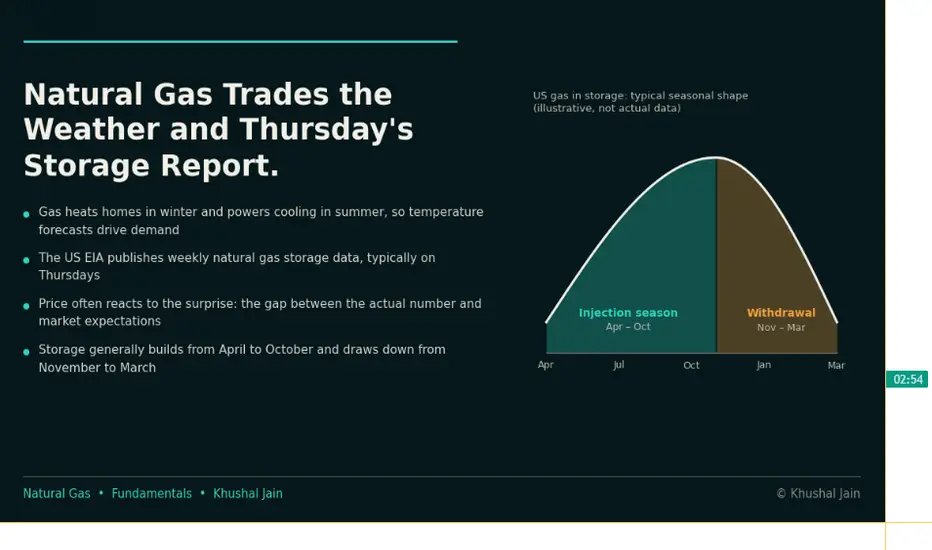
Natural Gas Trades the Weather and Thursday's Storage ReportNatural Gas Trades the Weather and One Weekly Report. Miss Either and You Are Trading Blind.
Few markets react as sharply to a forecast and a single number as natural gas does.
Natural gas is used for heating homes in winter and generating power for cooling in summer. So demand expectations shi
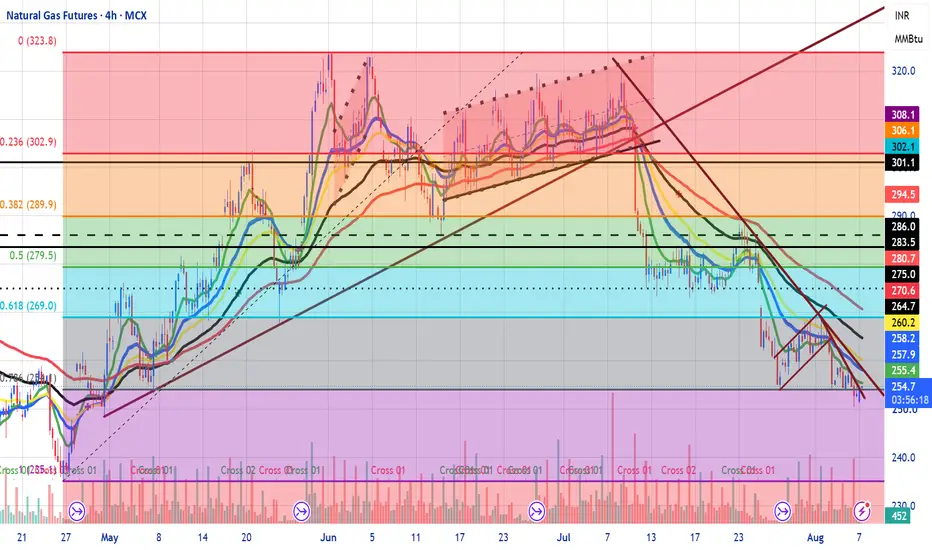
Natural Gas - Is Worst Over ???In the month of August NG will be Bottoming out and can start fresh rally very soon...
Buy 257-259 range...sl 255 and target will be 296-302....Can buy Future in recomended zone with Hedge trade 250 put for capital protection....Below 255 daily closing is SL for Future buying and hold 250 put ...el
Natural Gas — Daily Chart📊 Bearish bias below 285.9 resistance.
🔴 Sell zone: 280–286 on rejection
📉 Breakdown: Below 264.7 can add downside momentum
🎯 Targets: 233.1 → 217.4 → 201.8
🛑 Invalidation: Sustained move above 285.9
⚠️ Current price : 272.4 → better to wait for rejection or confirmed breakdown rather tha
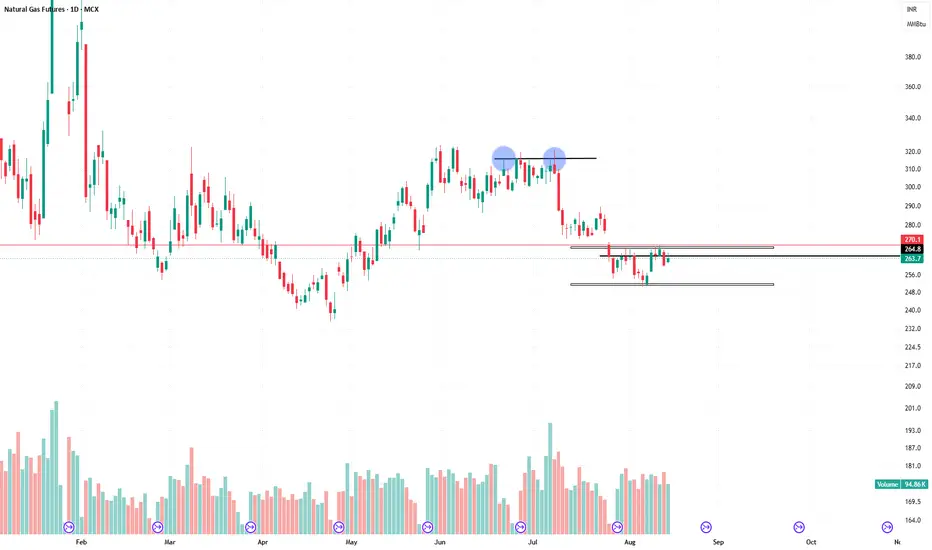
NATURAL GAS — IH&S Formation | Preparing for the Next Leg?Natural Gas is building a potential Inverse Head & Shoulders (IH&S) pattern on the daily timeframe, and the structure is getting interesting.
After falling from the ₹320+ zone, price formed a base around ₹250 and started recovering. We can now see a possible:
Left Shoulder → Head → Right Shoulder
Natural Gas: Buy Zone 210–222 | September Time CycleNatural Gas Futures – Weekly Analysis
Price is currently trading around 266.
I am watching the 210–222 zone as a potential buying area.
The setup is based on:
Weekly structure & historical support
61.8% Fibonacci retracement zone
Gann time-cycle observation
Potential Elliott Wave flat correction
NATURALGASOn the daily timeframe, the price structure appears to be forming a potential bullish harmonic pattern near the PRZ. Based purely on the harmonic structure, my view is bullish and I am watching for a possible reversal and upward move from this zone.
This is only my technical/educational view based
NATURAL GAS - BULLISH OUTLOOKAs you can see in Chart..
Natural Gas last uptrend starts from ₹236 to ₹324 around..
Almost 88 Rupees up trend in just 2 months of period..
Now as you can see in chart..
₹236 to ₹324 Fibonacci, Every time break Fibonacci levels on very strongly..
0.236, 0.50 and comes down till 0.786..
So, as per
See all ideas
A representation of what an asset is worth today and what the market thinks it will be worth in the future.
Displays a symbol's price movements over previous years to identify recurring trends.
Frequently asked questions
The nearest expiration date for E-mini Natural Gas Futures (Dec 2021) is Nov 24, 2021.
Traders prefer to sell futures contracts when they've already made money on the investment, but still have plenty of time left before the expiration date. Thus, many consider it a good option to sell E-mini Natural Gas Futures (Dec 2021) before Nov 24, 2021.