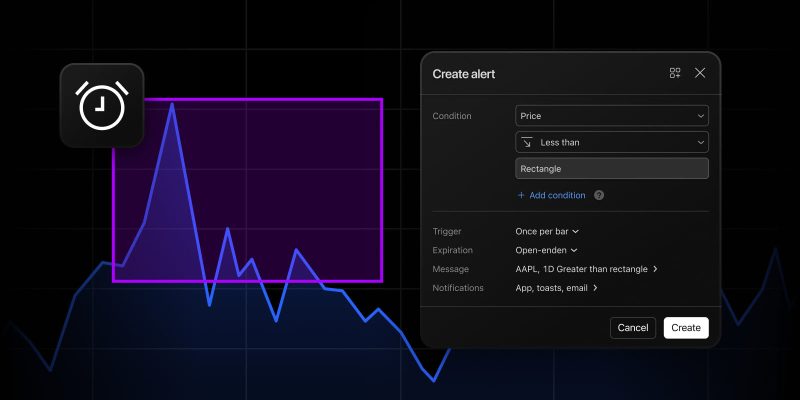
The rectangle is one of the fastest ways to mark a support or resistance zone on a chart. But until now, alerts on rectangles only offered channel conditions — Entering Rectangle, Exiting Rectangle, Inside Rectangle, and Outside Rectangle. Those watch the zone as a whole: price came in, price went out. What they couldn’t tell you is that the price is on the right side of that zone for your setup — above your support or below your resistance.
Now you can set the alert to watch a specific side of the rectangle:
- Greater than: Tracks when price is above the upper boundary of the rectangle. Use it with a support zone to know when price is holding above it
- Less than: Tracks when price is below the lower boundary of the rectangle. Use it with a resistance zone to know when price is still capped below it

Because the condition is tied to the rectangle itself, moving or resizing the zone updates the alert level with it. Adjust the box, and the alert follows.
How it works
Setting up an alert takes just a few steps:
- Draw a rectangle over the zone you’re watching
- Open the alert menu from the clock icon on the floating drawing toolbar, or right-click the rectangle and pick Add alert on drawing
- Select Greater than or Less than as the condition
- Set the frequency and how you want to be notified, then press Create — and you’re done
So go ahead — box your zones and set Greater than or Less than on the side you care about. Let TradingView watch the level so you can focus on trading.
Let us know what you think, your feedback keeps TradingView growing and improving every day.
Team TradingView