The Russell May Be RunningThe Russell 2000 small cap index had a big pullback in the late summer, but some traders could think it’s rising again.
The first pattern on today’s chart is the January peak of 2,735. RUT bounced at that level in April and May before advancing to new highs. It held the same level after sliding between mid-August and mid-October. That may confirm old resistance has become new support.
Second, prices have recovered after testing below their 200-day simple moving average (SMA). Is the long-term
TradeStation Europe B.V. is registered with the Dutch Chamber of Commerce (no. 98426657), and authorised and regulated by the Dutch Authority for the Financial Markets in the Netherlands (AFM).
TradeStation publications
Meta May Be OversoldMeta Platforms fell sharply in recent weeks, but now it may be oversold.
The first pattern on today’s chart is the August high of $612.43. The social-media giant has been trying to stabilize at that level for the last week, which could suggest it’s becoming support.
Second, the 50-day simple moving average (SMA) had a “golden cross” above the 200-day SMA about a month ago. That could suggest its longer-term trend is growing more bullish.
Next, stochastics have fallen into oversold territory.
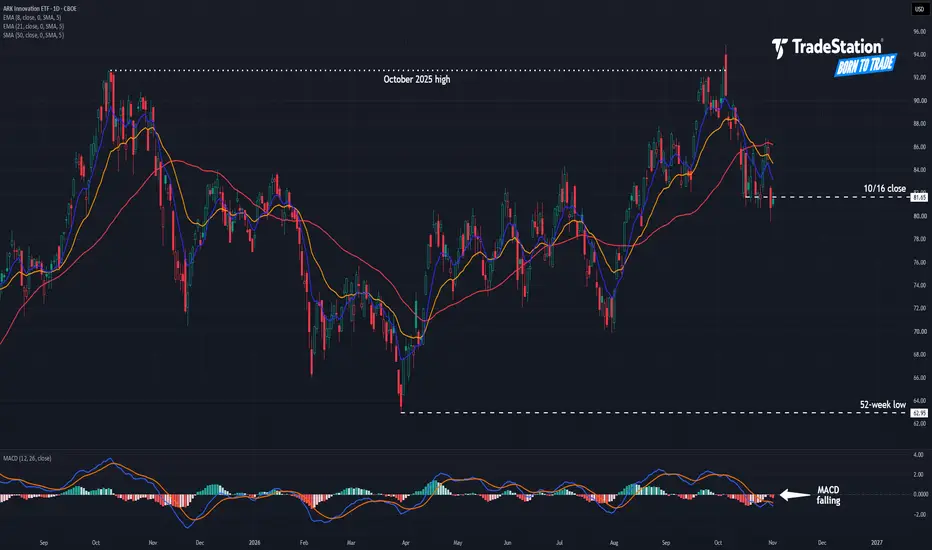
ARK Innovation: Is Support Breaking?The ARK Innovation ETF rallied sharply in August and September, but now it could be going the other way.
The first pattern on today’s chart is the October 2025 high of $92.65. The fund tried unsuccessfully to cross that level early last month. It quickly dropped from the high, potentially confirming a bearish reversal.
Second, ARKK had a weekly close at $81.65 on October 16. It probed below that level several times in the following sessions while managing to close above. However, it decisively
Salesforce Could Be SlidingSalesforce rallied over the summer, but some traders may think it’s sliding in the autumn.
The first pattern on today’s chart is the September 3 high, followed by a lower low and lower high. That may suggest that a descending channel is taking shape.
Second, the recent peak was slightly above the highest daily close in December 2025. The software company’s unsuccessful probe above that level may be viewed as a false breakout or double-top reversal pattern.
Third, the 8-day exponential moving
Super Micro Might Be SlippingSuper Micro Computer recently dropped, and some traders may see more downside risk.
The first pattern on today’s chart is the October 7-20 decline. The computer maker has tried to recover from the drop, but some traders may view the bounce as a bearish flag.
Second, SMCI peaked at roughly a 50 percent retracement of the slide. That may confirm its direction is pointing lower.
Third, prices remain well above the 52-week low of $19.48. Is there downside space to be filled?
Next, the 8-day expo
Valero Could Be OversoldValero Energy has been climbing all year, and now it’s pulled back.
The first pattern on today’s chart is September 29’s weekly low of $379.57. VLO is stabilizing near that level, which could suggest it’s become support.
Second, prices have dipped slightly below their rising 50-day simple moving average. Is the intermediate-term trend still bullish?
Third, the oil refiner is near the bottom of its Keltner Channel. Stochastics have also dipped into oversold territory.
TradeStation has, fo
Dell: Potential Signs of WeaknessDell Technologies has more than tripled this year, but it could be showing signs of weakness.
The first pattern on today’s chart is the October 14-15 drop as high inflation readings hurt broader market sentiment.
Second, DELL rebounded to stall at the September 10 weekly low of $506.25. Has old support become new resistance?
Third, the computer maker peaked around $595 in September and October. That could be viewed as a double-top reversal pattern, which was potentially confirmed by the subse
More Upside in the 10-Year Treasury Yield?The yield on 10-year Treasury notes recently hit multiyear highs, and some traders may see further upside.
The first pattern on today’s chart is the breakout in late August and steady rise in September. The yield reached its highest level in 24 years before pulling back, which may suggest it’s broken out.
Second, TNX has stabilized above a weekly low of 4.93 percent before the latest surge. Holding this level would represent a higher low. It would also confirm support at the 2023 high of 5 per
The U.S. Dollar Could Still Be RisingThe U.S. dollar recently had a big surge, and some traders may think it’s still rising.
The first pattern on today’s chart is June’s closing high of 101.586, which DXY ripped through in early October. It’s now pulling back and stabilizing at the same price zone. Has old resistance become new support?
Second, the 8-day exponential moving average (EMA) has stayed above the 21-day EMA. That may reflect short-term bullishness.
Next, stochastics are turning up from an oversold condition.
Finally,
CF’s Tight PullbackCF Industries rallied early this year, and some traders may see potential for more upside.
The first pattern on today’s chart is the relationship between the 50-, 100- and 200-day simple moving averages (SMA). That alignment, with faster SMAs above slower ones, may reflect a bullish longer-term trend.
Second, the fertilizer stock closed at $120.64 on September 23 before slipping lower. It’s been challenging that level as the 200-day SMA pushes from below. That could suggest that pressure is bu
Micron Might Be Getting HeavyMicron Technology hasn’t made a new high in months, and now it might be getting heavy.
The first pattern on today’s chart is the pair of converging lines since June. The memory-chip maker dropped below that triangle last week and has remained there since, which could be viewed as a breakdown.
Second, MU has been sitting at a weekly low from mid-September. However, it may be fading as support.
Third, prices have stalled under the 50-day and 100-day simple moving averages. That could reflect we
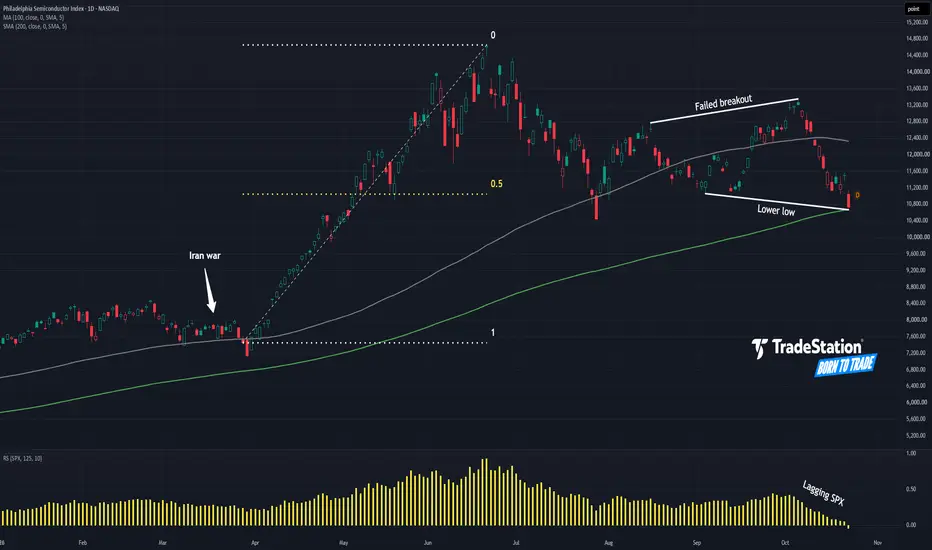
Semiconductor Index: Potential BreakdownThe Philadelphia Semiconductor Index has been rangebound for months, and some traders may see risk of a breakdown.
The first pattern on today’s chart is the rally between early April and mid-June. SOX tried to rebound at a 50 percent retracement of that advance, but failed to make new highs and is now back near its July low. That may suggest its bullish trend is over.
Second, the index made a slightly higher high early this month that didn’t hold. That was followed by a lower low versus last m
Okta May Be OversoldOkta rallied sharply after its last earnings report, and now it’s pulled back.
The first pattern on today’s chart is the September 15 close of $190.45. The cybersecurity stock remained below that level for the subsequent week before running to new multiyear highs. It’s now retreated to hold the same price zone. Has old resistance become new support?
Second, Tuesday’s low was below Monday’s low. It also made a higher high. That kind of bullish outside candle may suggest that prices have stopped
Delta Air Lines Might Be Losing AltitudeDelta Air Lines has been sliding since June, and some traders may think it’s breaking key support.
The first pattern on today’s chart is the June 11 low of $76.40. DAL bounced at the level early last month, but now it’s sliding through it.
Second, the 50-day simple moving average (SMA) is falling. Prices have also crossed below the 200-day SMA. That may reflect longer-term weakening.
Next, the 8-day exponential moving average (EMA) is falling and has dipped under its 21-day EMA. MACD has also
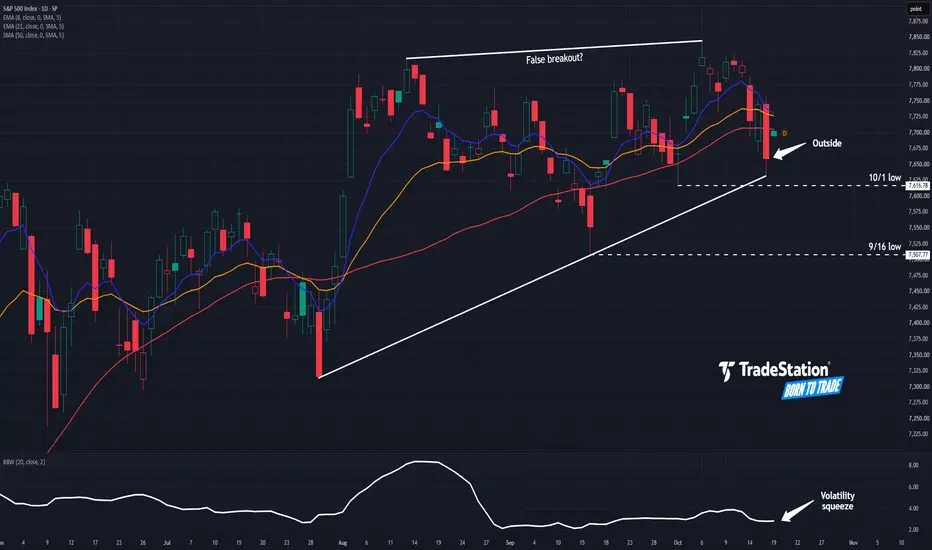
S&P 500: Cracks Forming?The S&P 500 is chopping near record highs, and some traders may see downside risk.
The first pattern on today’s chart is October 6’s all-time of 7,845 -- less than half a percent above its previous record in early August. The index has made higher lows at a steeper angle, creating a potentially bearish ascending wedge.
Second, Friday’s high surpassed Thursday’s. A lower low followed. Such a bearish outside day could be viewed as a reversal signal.
Third, the index dipped under its 50-day simp
Palantir Sneaks HigherPalantir Technologies rallied in August, and now it may be breaking out.
The first pattern on today’s chart is the gap after earnings, revenue and guidance beat estimates. That may reflect bullish fundamentals.
Second, the 50-day simple moving average (SMA) had a “golden cross” above the 200-day SMA the following month. That could suggest that the long-term trend has turned bullish.
Third, the 8-day exponential moving average (EMA) has remained above the 21-day EMA. MACD is also rising. Is th
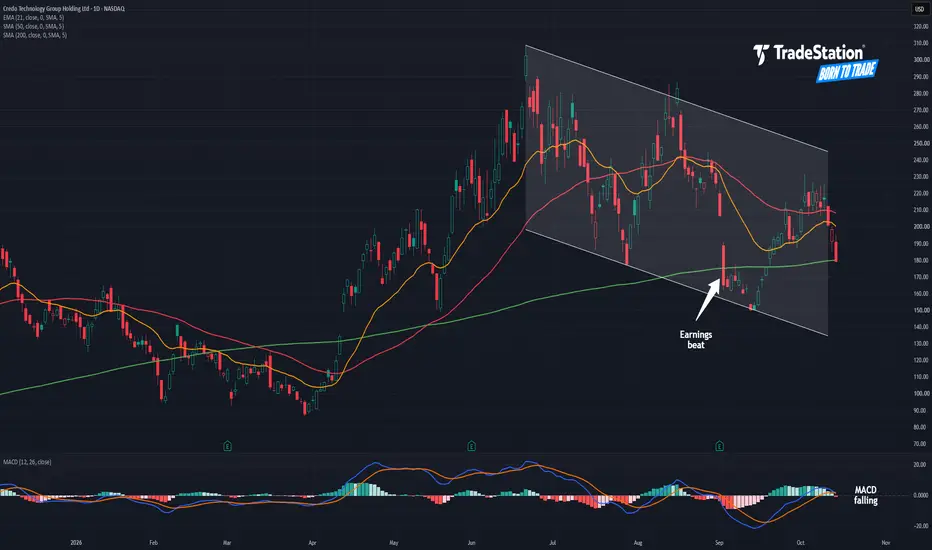
Credo May Be CrumblingCredo Technology rallied sharply in the spring, but now it may be faltering.
The first pattern on today’s chart is the series of lower highs and lower lows since late June. That falling channel may reflect the start of a new downtrend.
Second, prices have gotten stuck at the 50-day simple moving average (SMA). They’re also back at the 200-day SMA. Those points could reflect bearishness in the intermediate and long terms.
Third, the connectivity company is under its 21-day exponential moving a
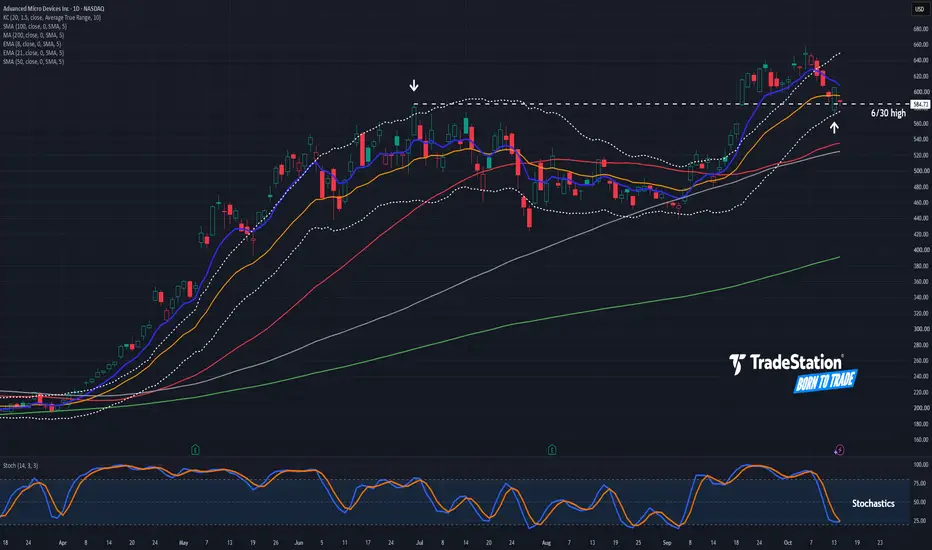
AMD Pulls Back After Breaking OutAdvanced Micro Devices broke out last month, and now it’s pulled back.
The first pattern on today’s chart is the June 30 high of $584.73. The chipmaker jumped above that level on September 21. Yesterday, it pulled back to bounce at the same price area and remains there today. Has old resistance become new support?
Second, Tuesday’s low occurred at the bottom of the Keltner Channel.
Third, stochastics have dipped near oversold territory.
Fourth, the 50-day simple moving average (SMA) is above
SpaceX Steadies After SurgeSpace Exploration Technologies jumped earlier this month, and some traders could think the ascent will continue.
The first pattern on today’s chart is the October 1-6 rally. The space-launch company has pulled back to hold a 50 percent retracement of that move, which may confirm the direction of the advance.
Second, SPCX peaked at $158.13 on September 21. Staying above that monthly high could indicate that resistance is breaking.
Next, the 8-day exponential moving average (EMA) is above the 2
JPMorgan Pulls Back Before EarningsJPMorgan Chase has pulled back, but it may be stabilizing as earnings approach.
The first pattern on today’s chart is the decline since early September. JPM bounced near a weekly close from June early this month, followed by a retest last week. That double bottom may suggest the downward move is finished.
Second, the financial giant is pushing through a falling trendline.
Next, the recent lows occurred above the rising 200-day simple moving average (SMA). The 100-day SMA is also above the 200
Is Amazon Coming to Life?Amazon.com has barely moved since early last year, but some traders may think it’s starting to move.
The first pattern on today’s chart is the gap on July 31 after quarterly results beat estimates. The hyperscaler retraced most of that surge but bounced above its pre-earnings levels.
Second, AMZN bottomed at $244.30 on September 16. It held that level again last week, which could suggest support is in place.
Third, yesterday it closed above the September 21 peak at its highest level since la
ServiceNow Challenges ResistanceServiceNow rallied in August and paused in September. Now some traders may think it will continue higher.
The first pattern on today’s chart is the series of lower highs since late August. Could the software company break that falling trendline?
Second, the 50-day simple moving average (SMA) recently had a “golden cross” above its 200-day SMA. That may reflect a more bullish long-term trend.
Third, the long basing pattern between February and June could also reflect bottoming has occurred.
F
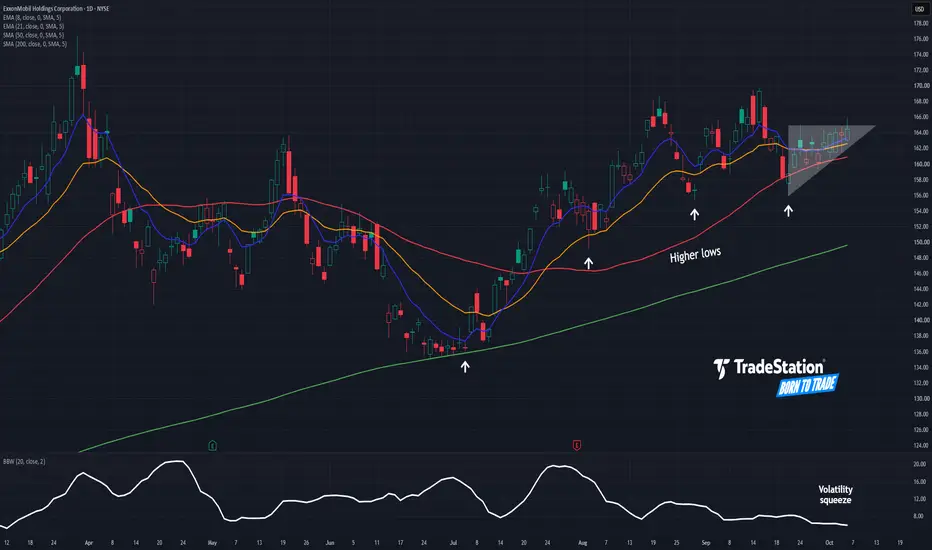
ExxonMobil: Potential Continuation PatternExxonMobil has been rising along with energy stocks, and some traders may see potential for another leg higher.
The first pattern on today’s chart is the narrowing consolidation since September 22. XOM has made higher lows while mostly staying under the September 24 high of $164.91. Is that a bullish ascending triangle that’s breaking to the upside?
Second, Bollinger Bandwidth has narrowed to the tightest range since March. Such tight consolidation may create potential for prices to expand.
Freeport Might Be Breaking FreeFreeport-McMoRan hit a record high in August. Now after a pullback, some traders may see further upside.
The first pattern on today’s chart is the narrowing range on either side of about $70, accompanied by tightening Bollinger Bandwidth. Does this compression create potential for a breakout and price expansion?
Second, the 50-day simple moving average (SMA) is above the 100-day SMA. Both are above the 200-day SMA. That configuration, with faster SMAs above the slower SMAs, could reflect a bul