• Products
  • Community
  • Markets
  • Brokers
  • More
Get started
  • Markets
  • /Denmark
  • /Stocks
  • /Ideas
Is Novo breaking out of a falling trend channel?In 2024, Novo formed a head–shoulder pattern with a breakdown at the end of September. Since then, the stock has been moving within a falling trend channel until now. On September 18 this year, the stock broke above the trend channel by 6–7% on increased volume. It has since pulled back to test the upper line of the channel and is now moving up again. There is resistance around 390. If the stock breaks significantly above this level with rising volume, it will be clearly technically positive. Price momentum indicators are currently neutral, and the stock remains within a red Ichimoku cloud, but RSI 21 is trending higher. The stock is slightly technically positive at this point but could quickly turn decisively positive if it breaks above 390. The analysis covers a medium-term horizon (1–6 months). Fundamentals: Fundamental analysts remain broadly positive on the stock. “Novo announced a global restructuring affecting 9,000 employees. The purpose is to increase decision-making speed, strengthen performance culture, and redirect resources toward growth areas within diabetes and obesity ... Despite short-term uncertainty, we assess that growth potential remains attractive (though somewhat lower than previously expected). The pipeline is strong, and Novo remains in a leading capacity position.” Quoted from Jyske Bank, Denmark. Disclaimer: I hold a position in the stock. Note: You must do your own research and assessment before buying or selling shares.
OMXCOP:NOVO_B
by scorpiris
Updated
33
The Iron Leviathan: A Structural Analysis of Cyclical CrossroadsThe ocean does not care for your spreadsheet formulas, nor does it weep when your capital sinks into the deep. Five thousand winters ago, we read the stars and the flight of birds to survive the treacherous trade routes. Today, we read the candlestick charts of Maersk. This is an ancient empire built on modern steel, sitting at a fascinating cosmic crossroads where fundamental value meets brutal macroeconomic tides. To understand this enterprise, an investor must look beyond short term price action and examine the absolute defenses of the fleet, its competitive moat, and its power to command tribute from the merchants of the world. To the uninitiated eye, pricing power seems like a simple decree a king demanding more gold just because he wears the crown. But on the wine dark sea, pricing power is a complex, shifting tide governed by the laws of capacity and the desperation of merchants. For the Maersk armada, this power operates like a pendulum swinging between two completely different realms. -The Shackles of Peace; When the waters are calm and the kingdoms of the earth are at peace, Maersk has very little unilateral pricing power on the immediate open market (the "spot market"). Shipping containers are ultimately a commodity. If rival fleets launch an excess of massive steel hulls into the water, supply outstrips demand, and freight rates crash to the seafloor. In these times of quiet doldrums, Maersk must accept whatever low tribute the global market indices dictate just to keep their vessels moving. -The Premium of Chaos; The true, terrifying peak of Maersk’s pricing power emerges during times of geopolitical crisis, structural bottlenecks, or blockaded straits. When supply chains break, global vessel capacity is instantly squeezed tight. Desperate merchants see their goods rotting on the docks and realize they face ruin if they cannot reach the marketplace. Because Maersk controls the ultimate, premium logistics network, they can implement Peak Season Surcharges and emergency disruption fees. Merchants will willingly pay a five-fold premium not for the ship itself, but for the guaranteed slot and the certainty that their treasure will survive the journey. To the modern chart watcher, pricing power is not just an abstract shield it is the direct catalyst that dictates whether the stock price climbs to the heavens or sinks into the dark abyss. On the Trading View star map, this power transmits into price action through three distinct channels. 1. The Cash Flow Multiplier (The Bull Catalyst): When Maersk weaponizes its pricing power during supply chain crises, its revenue scales exponentially while its fixed costs remain flat. This triggers a massive explosion in Free Cash Flow. On your chart, this fundamental shift is what fuels massive momentum breakouts, as institutional funds rush to buy the surging earnings. 2. The Valuation Floor (The Bear Shield): When the global spot market crashes due to an oversupply of hulls, Maersk's pricing power handles the defense. Because they lock in multi year pricing covenants with massive global corporate empires, their earnings do not completely fall off a cliff. For the stock price, this creates a reliable structural floor, preventing catastrophic sell offs and holding key long-term support levels. 3. The Multiplier Premium (The Institutional Magnet): A shipping company with zero pricing power is treated like a volatile, low-margin slave to the commodity cycle, punished with a low valuation. Because Maersk can command premium tribute through its integrated network, the market rewards it with a higher price to earnings premium. Investors are willing to pay more gold per share because they know Maersk can defend its profit margins even when the macro seas turn treacherous. The scrolls have been unrolled, and the warring currents of the deep have been laid bare. Now, we stand upon the jagged cliffs of the marketplace, watching this massive iron leviathan navigate the cosmic crossroads. Whether this armada conquers the next epoch or gets trapped in the stagnant doldrums is a riddle only the gods of liquidity can answer. The forces of structural overcapacity and geopolitical chaos are locked in a titanic, mathematical stalemate. No single trader, no matter how wise, can predict which wind will break the deadlock first. Keep your star maps clean and your drawing tools precise. Do not let greed cloud your vision, nor fear freeze your hand. Treat Maersk as the volatile, uncaring beast it has always been since humanity first pushed logs into the foaming surf. Watch the boundaries of the horizontal channel, track the tribute of the freight indices, and let the market reveal its own true course. May the gods of the trade winds watch over your capital, may the sea mothers smile upon your ledger, and may your stops never be breached by the terrifying leviathans of the deep!
OMXCOP:MAERSK_A
by Capitalist_Zach
Updated
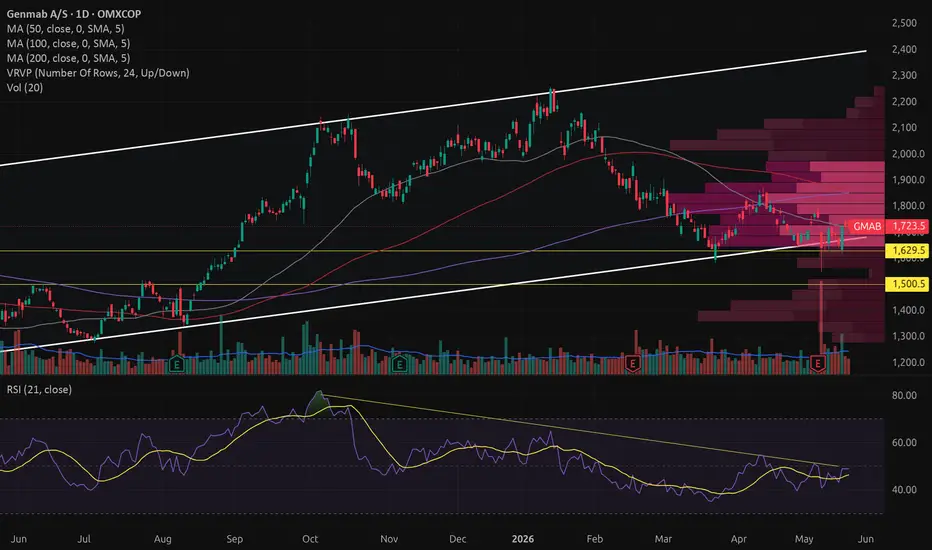
Technical and Fundamental Assessment of Genmab Technical Analysis Genmab has been in an upward trend since the beginning of April 2025. The trend is only partly supported by the moving averages (MA) and is weakened by a declining RSI-21. The price is currently below or near the lower edge of a red Ichimoku cloud and is trading in the lower part of the trend channel. Volume balance has been close to neutral over the past six months. Volume is an important independent indicator, as it is not based on an interpretation of price. The stock has support around 1630 and 1500. A significant break below these support levels or the trend line would indicate a new direction, at least in the short term. From a technical perspective, the stock is slightly positive in the medium to long term, i.e. one to six months. Fundamental Factors Genmab is a biotechnology company engaged in the development of human antibody therapies for the treatment of cancer and other diseases. The company depends on innovation and strong products in line with patent expirations. Investment in biotechnology companies is considered high risk; therefore, one’s portfolio should not contain a large proportion of such companies. Cash flow from operations has been steadily increasing. Fundamental analysts are, by and large, recommending the stock as a buy. Disclaimer: I hold a position in Genmab. Note: You must conduct your own research and assessment before buying or selling securities.
OMXCOP:GMAB
by scorpiris
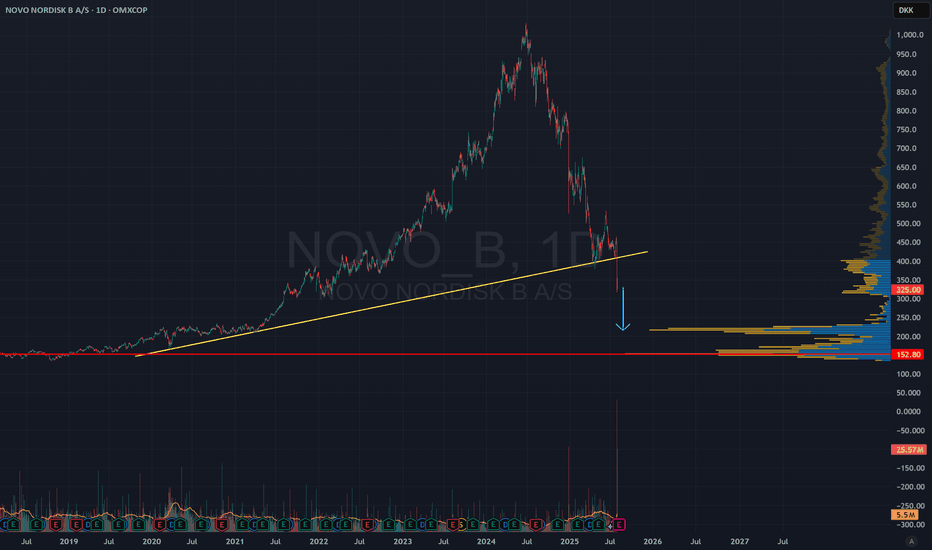
Finding support at $213Broke long term trend, find the next support around $213.
OMXCOP:NOVO_BShort
by mtraderz
Updated
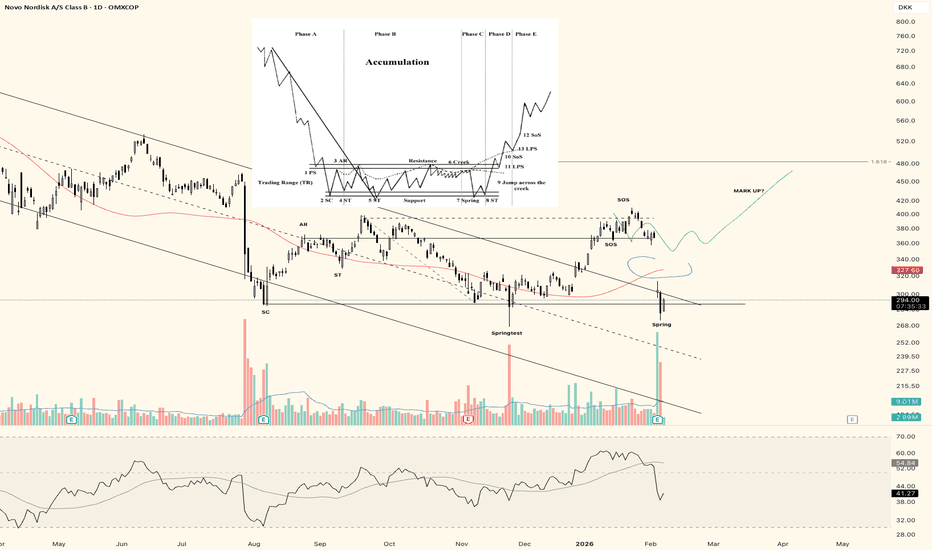
Novo Nordisk made some wild moves. What's next? In this video I explain why I was looking at an accumulation schematic, but also why this could've been a distribution as well. I also show a bit of NYSE:NIO to explain how to approach pictures vs reality. Again, not going to much into depth as for me taking these video's is something I have to get used to. Please leave a comment with feedback.
OMXCOP:NOVO_B
14:49
by Martechnic
22
NOVO NORDISK finishing an accumulation patternAs the title says, and you'll be able to see in the chart: It seems like NYSE:NVO is finishing up an accumulation here. Spring setting in right now. For better confirmation wait for some weekly closes above bottom of range here.
OMXCOP:NOVO_BLong
by Martechnic
Updated
11
Novo 1h AB=CD to gap closeNovo keeps making succesful ab=cd's at the moment. Smaller ones turning into partt of bigger etc. Right now an even bigger one would take it to a possible channel low, a "failed turning point" and gap close. I'm definitely watching this closely!
OMXCOP:NOVO_B
by BaliShag
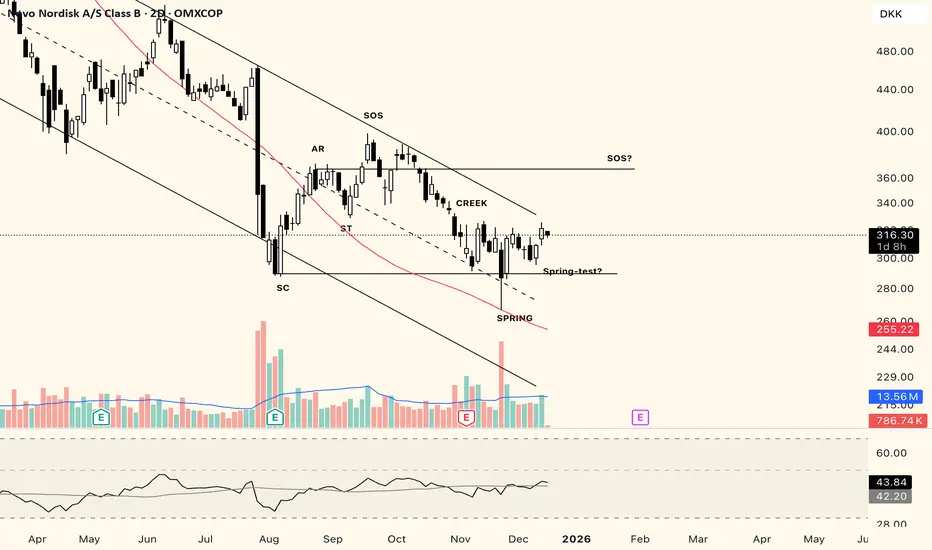
Novo Nordisk about to finish accumulation range?As the title says. Looks like NYSE:NVO is finishing up an relative small accumulation range. Question is whether the spring-test is done here or not. Sometimes there's a big push and retrace to create a test. Sometimes something that resembles current PA can be enough. Let's see how it develops. But expecting continuation up on the higher timeframe. Breakout and retest of downwards trend (descending channel) would be a big sign.
OMXCOP:NOVO_BLong
by Martechnic
Updated
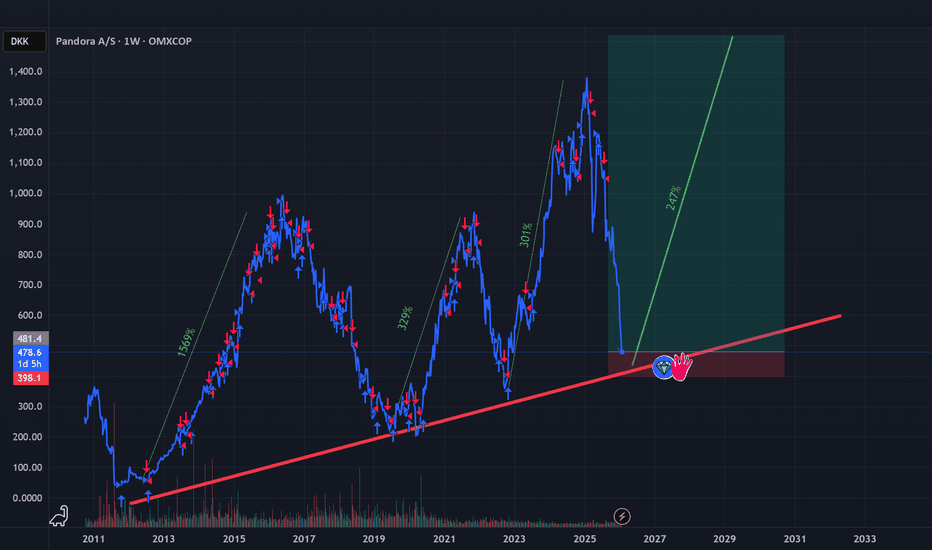
Pandora (PNDORA) - Reversal PlayOMXCOP:PNDORA My Thesis in 4 Bullets: The market fears $112/oz silver costs, but the CFO just confirmed they are >75% hedged for 2026 (likely locked near ~$35/oz).They will also have time to adjust jewelry`s silver to metal ratio. Valuation Dislocation: Pandora trades at ~7.5x P/E while peers like Signet and Richemont trade at ~26x. A simple reversion to 12x doubles the stock. The "India" Call Option: The EU-India Free Trade Agreement (FTA) is a hidden catalyst. It eliminates tariffs on gems/jewelry, lowering component costs and unlocking the Indian luxury market. Silver Mean Reversion: Commodities are cyclical. If silver drops in H2 2026, today's "headwind" becomes a massive earnings explosion for 2027. DCF Analysis: Professional Models Confirm the Upside Alpha Spread's DCF valuation (updated Jan 24, 2026) shows a Base Case fair value of 1,611.59 DKK, a 237% upside from the current 478.7 DKK price. The model shows the stock is undervalued by 70%. Current Price: 483 DKK DCF Fair Value (Base Case): 1,611.59 DKK | Upside: +234% Conservative Target (12x P/E): ~850 DKK | Upside: +76% Even if you haircut the DCF model by 50% to account for the current crisis, fair value is 800 DKK, still 66% upside from here. My Trade: I'm entering with 1/3 position at 483 DKK today (along side Blackrock). I'll add more if Feb 5th guidance scares weak hands down to 450-400 DKK. My target is 850 DKK by Dec 2026. All thoughts are appreciated! Best.
OMXCOP:PNDORALong
by Kid_poker
22
$NVO — another upside breakout today. Still holding the full posNYSE:NVO — another upside breakout today. Still holding the full position, now with a large open profit. The Danish primary listing of Novo Nordisk, OMXCOP:NOVO_B , is now trading in clear air. The 460 DKK area looks like the most logical swing target, which aligns slightly above my $70 zone on the US listing.
OMXCOP:NOVO_BLong
by Swing_Trader_Saan
NOVO: The Pawn That Refused to Fall – Triangle Breakout ImminentThe Thesis: Novo Nordisk (NOVO_B / NVO) just survived the ultimate geopolitical stress test. With the recent threats regarding US tariffs on Denmark (the "Greenland leverage"), Novo was the perfect pawn in a high-stakes negotiation. The market panic briefly flushed the price down to test critical support, but the rebound was instant and violent. This tells me one thing: There are no sellers left. The underlying demand is massive. Technical Setup: The First Consolidation We are currently witnessing the completion of the first major consolidation phase within the newly birthed uptrend. After reclaiming the 200-Day Moving Average (the black line), the stock has coiled into a classic Bullish Triangle / Pennant formation. Support Held: The 200 DMA was successfully defended as a "floor" during the political volatility. The Pattern: We are compressing between rising lows and a flat resistance. This energy is about to release to the upside. The Trade: Breakout & Targets We are looking for a clean break above the upper trendline of this triangle to trigger the next leg up. 🎯 Mid-Term Target: 450 – 480 DKK (This zone represents the next major structural resistance and gap-fill area from 2024. Once we clear the psychological 400 level, there is very little air resistance up to 450.) 🛡️ Invalidation (Stop Loss): Close below 375 DKK (If we lose the 200 DMA and the recent "Greenland Lows", the thesis is invalid.) Verdict: The political noise was a bear trap. The trend is real. The consolidation is ending. I am long and strong with my option trades.
OMXCOP:NOVO_BLong
by enakocapital
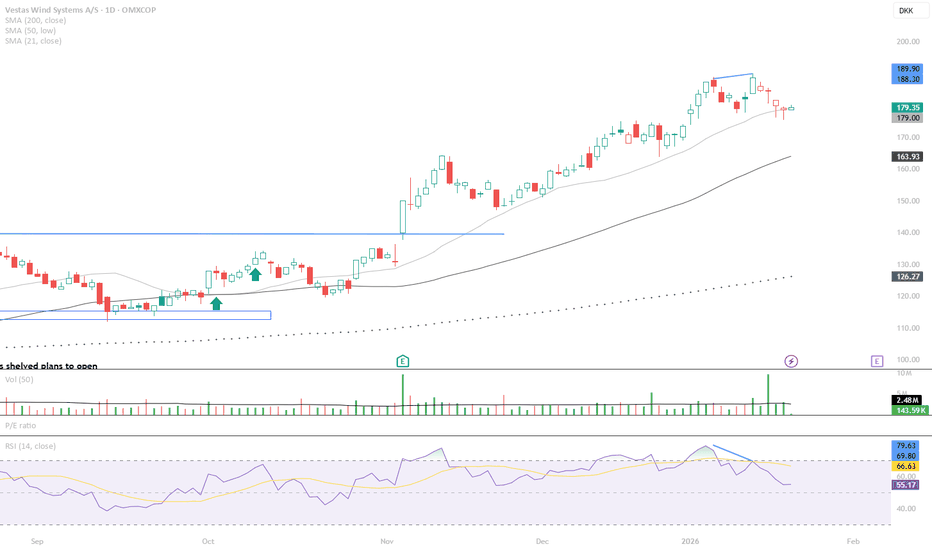
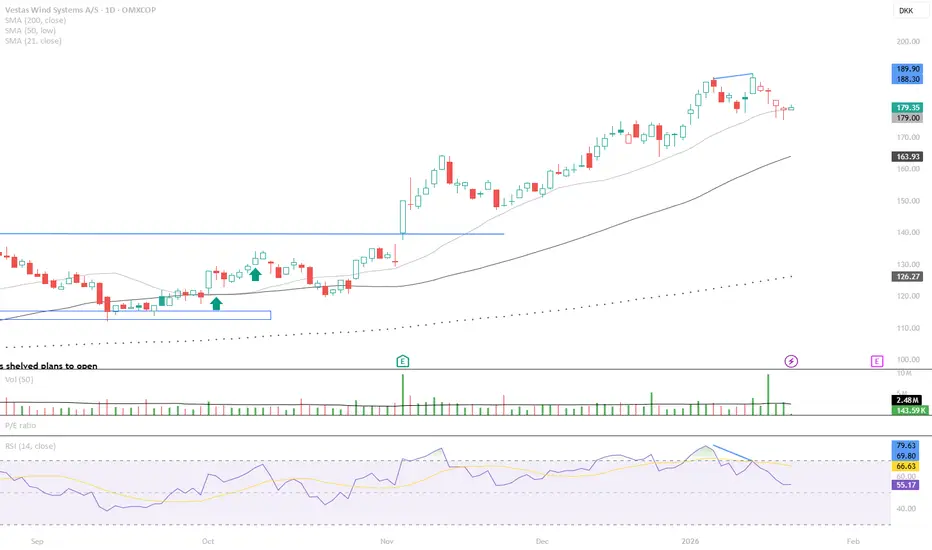
Bearish divergenceAfter initial breakout, first sign of RSI divergence. This is combined with double top, and huge volu not able to push price higher tells me it is time to book 50% of the profit.
OMXCOP:VWSShort
by yash_gurjar_07
Novo Nordisk - Inverse H&S after a long bear marketIm going long here with a tight stop loss. Thinking it´s time for a reversal. I pointed out which levels im looking at.
OMXCOP:NOVO_BLong
by Mr_Anonymous_Investor
11
Possible buy signal forming after inverse head and shoulders?NSIS (Novonesis) has formed an Inverse Head and Shoulders (IHS) formation from August 20 to November 6 this year. The IHS is a reversal formation. NSIS broke out of a falling trend on September 30. The question now is whether we will get a buy signal from a significant breakout above the neckline — i.e., more than 3% with increased volume. We haven’t seen that yet. Such a move would also represent a clear breakout above the resistance at 415. Price momentum indicators, including RSI 21, are pointing upwards, and the stock has moved above the red cloud in the Ichimoku indicator. In the forward projection, Leading Span A is crossing above Leading Span B. There was also an almost perfect bullish engulfing signal on November 6. From a fundamental perspective, analysts are generally positive on NSIS. NSIS is the result of a merger between Chr. Hansen and Novozymes. In short, they are market leaders in industrial applications of enzymes and bacterial cultures. Disclaimer: I took a position in NSIS when it broke out of the falling trend, also based on fundamentals and the megatrends that Novonesis is exposed to. Note: Always do your own research and assessment before buying or selling stocks.
OMXCOP:NSIS_B
by scorpiris
Updated
Play (continued): Reversal caused by positive newsTriggers: 1) Positive news - Better than expected orders Analysis/Observations: 1) In a channel trending up 2) Slightly higher volume in channel 3) In between control points 4) Channel at 200 between March and August 2026 Portfolio: 1) Entered at 113.5 in July 2025
OMXCOP:VWS
by sixfur
Safe play for the next five years?Using the historical data on the log proves the lifetime trend for this stock. I believe this is a good buy for the long run.
OMXCOP:NOVO_BLong
by mrmostchill
$ORSTEDOrsted has been in a persistent downtrend since its peak, without ever breaking the pattern. Technical analysis has long warned investors to stay away from the stock. The company has now filed for a $9 billion restructuring plan, driven by its oversized offshore wind projects. The plan is backed both by the Danish state (which owns 50%) and external investors. Shareholders of all sizes have been devastated.
OMXCOP:ORSTEDShort
by StockTradingTips
33
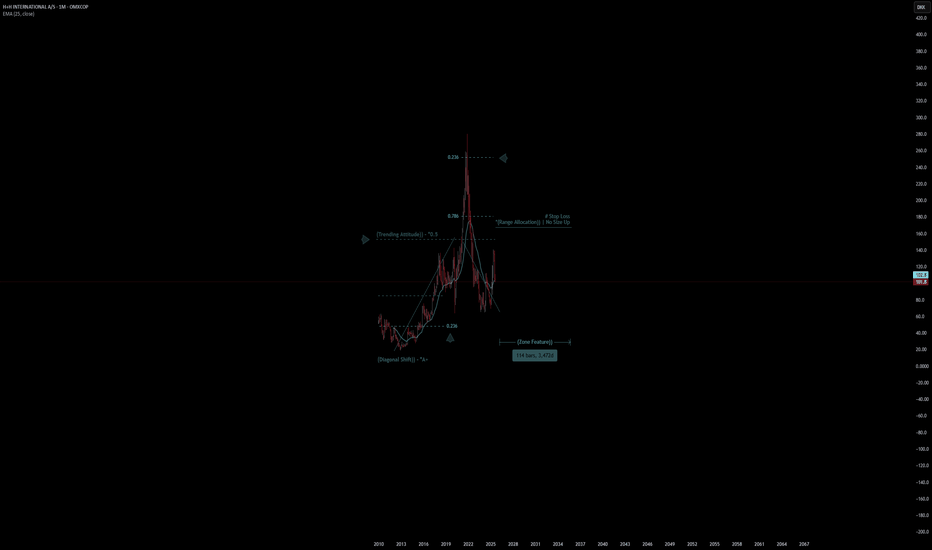
H+H International A/S | Chart & Forecast SummaryKey Indicators On Trade Set Up In General 1. Push Set Up 2. Range Set Up 3. Break & Retest Set Up Notes On Session # H+H International A/S - Double Formation * (Trending Attitude)) - *0.5 - *Retest & Entry - *25EMA | Subdivision 1 * (Range Allocation)) | No Size Up - *Retest Area | Completed Survey * 95bars, 2893d | Date Range Method - *(Downtrend Argument)) - Triple Formation * (P1)) / (P2)) & (P3)) | Subdivision 2 * Monthly Time Frame | Trend Settings Condition | Subdivision 3 - (Hypothesis On Entry Bias)) | Regular Settings * Stop Loss Feature Varies Regarding To Main Entry And Can Occur Unevenly - Position On A 1.5RR * Stop Loss At 180.00 DKK * Entry At 125.00 DKK * Take Profit At 45.00 DKK * (Downtrend Argument)) & No Pattern Confirmation - Continuation Pattern | Not Valid - Reversal Pattern | Not Valid * Ongoing Entry & (Neutral Area)) Active Sessions On Relevant Range & Elemented Probabilities; European-Session(Upwards) - East Coast-Session(Downwards) - Asian-Session(Ranging) Conclusion | Trade Plan Execution & Risk Management On Demand; Overall Consensus | Sell
OMXCOP:HHShort
by UnknownUnicorn87383881
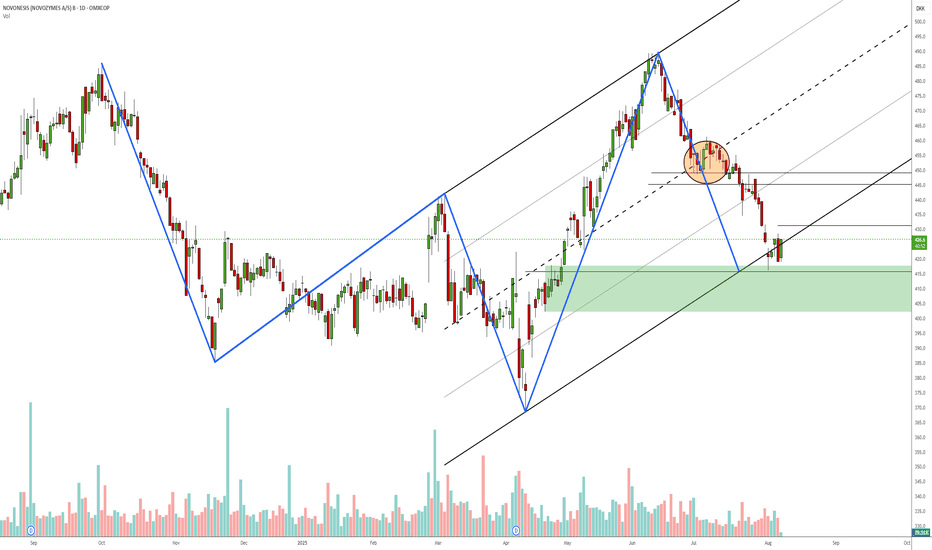
Novonesis daily reversal?Measured move / 3-point channel to test of failed symmetry zone. Might take 1/3 off around 445 depending on PA. I might add to the position if the bearish ab=cd at 431 fails and I'll be looking to take the loss if it drops below 400. Haven't used harmonic patterns for a long time, but this does resemble a 5-0 pattern if I'm not mistaken?
OMXCOP:NSIS_BLong
by BaliShag
NovoNordisk, LT dirt cheap | GLP-1 a misunderstood growth marketNovo Nordisk stock has lost quite some weight since the release of Eli lilly's drug Zepbound and Mounjaro and since the rise of compounded, or generic copycat GLP-1 alternatives. The growth of the company has slown down a bit, but the overall GLP-1 market growth is still impressive and misunderstood. Both Lilly and NVO have become some of the cheapest PEG stocks in the markets and compettitors, of which most known, Hims en hers health also took a slice of growth of this market by telehealth GLP-1 descriptions. The copycat descriptions could be dangerous due to unvalidated low quality GLP-1 or agonist GLP-1 substances. Therefore a lot of law suits have been initiated by NVO. Where Oral Wegovy still has to be FDA approved withinin ~4, 7 months in USA, the company also has new medication approvals awaiting in the pipeline, medications like Cagrisema. (Phase 3 clinical trials, approval in late 2025 or early 2026) Amycretin - a unimolecular long-acting GLP-1 and amylin receptor agonist. Where investors have already praised Lilly for the better drug, GLP-1 demand is surging harder than production for both companies. Where Wegovy and Ozempic are approved by The FDA to sell, many costs for the patients themselfs aren't covered by the health insurance yet. Wegovy or Zepbound isn't covered for mainstream when prescribed by your physician yet. it's only covered for severe obisty for example. Therefore penetration rates of the drug aren't very high yet and will get higher where it will be coverd for more people. Also due to the high cost many copycat GLP-1 agonist market have arisen. There is some improvement in cost coverage for these types of medicine Which will boost the revenue due to prescribtion sales. Next these facts, there are still new markets for GLP-1 to be approved like in india and Japan where worldwide demand is much greather than production capacity. Both Lilly and NVO are expanding fast. Many new production volume is created and Needed!, NVO is expanding production sites in brazil and china. I'm exited for the earnings today. NVO has had many dumps before but has proven to be a up only company. The profits of the company have doubled from $7B to >$14B since Wegovy FDA approval. from the top shares have dumped 70% where there is still >10% growth. Since the FDA approval (june 2021), other markets excluded the share is just +40% up. The stock is much cheaper now with double the profits and revenue, and still >10% growth. Let's see what happens with earnings. Good luck.
OMXCOP:NOVO_B
by Asset_Sniper
22
If you want to buy NOVO.....A follower asked for my opinion on this stock which he said many are shorting this and asks if he should be a contrarian instead. I do not own this stock and has no intention to at this moment but just looking at the chart, here's my 2cents : 1) price has fallen by 70+% from the peak from June 2024 (more than 12 months of bearish moves) 2) price is still in the downward channel and no reversal pattern is in sight 3) How will Donald Trump's tariffs hit these pharma companies down the road remain a mystery. Prefer to let the dust settles first, ie. you may not catch at the lowest price but at least if the trend is up , you have participated in it. 4) Time Horizon - are you investing for long term ? If yes, then further fall in prices may be a good opportunity to average down. 5) Economic Moat - how intense is the competition in the obesity drugs market ? How are the other competitors doing ? Is Novo market shares being encroached ? if yes, what are its strategies to counter that ? Reading some of the analysts' comments on this stock, it seems like short term prices may not recover as fast as many disappointed investors wanted. Further selling pressure may persists, creating more fear in the market. It may takes several years for the prices to recover to its glorious days so patience is really needed if you want to invest in it. 6) Substitutes - Are there better healthcare companies that you can choose to invest in compared to NOVO ? Consider your investing objectives, capital allocation, timeline, risk/reward, etc No rush.....
OMXCOP:NOVO_B
by dchua1969
Novo Nordisk, generational buying opportunity? Novo Nordisk is currently experiencing one of the largest drawdowns in its history, primarily triggered by a downward revision of guidance for FY25 and FY26. Focusing strictly on technical analysis: For the first time, the monthly 200 EMA is serving as a key support level for Novo Nordisk - an area the stock has never approached in its previous history. The long-term trendline, originating in 1989 and successfully tested three times since 1995, remains intact and is being approached once again. Both support levels - the monthly 200 EMA and the long-term trendline from 1989 - are now converging in the same price area. In addition, the latest twelve months (LTM) P/E has compressed to 13.8x, representing its lowest multiple in over two decades. In the context of a highly valued broader market, Novo Nordisk is now trading at what can be considered a fair level from a purely technical perspective.
OMXCOP:NOVO_BLong
by PhilippBE
66
$NOVO_B updated channelNovo Nordisk has had a tough time over the past 13 months, with its stock falling significantly. The main reason is growing investor concern that the explosive growth in sales of Wegovy and Ozempic may be slowing down, especially as competition heats up — particularly from Eli Lilly. Just a few days ago, Novo cut its full-year growth forecast, which confirmed some of those market worries. At the same time, they announced a leadership change. Current CEO Lars Fruergaard Jørgensen is stepping down, and from August 7, Mike Doustdar will take over. He’s been with Novo since 1992 and has led the company’s international operations with great success. He’s also completed executive education at Harvard, and he’s widely seen as a strong, action-oriented leader with global experience. Looking at the chart the price has almost always swayed up and down within this tunnel. Occationally falling to the trendline bellow. Now we are at the trendline below - Meaning we are at an absolute panic state. One og the biggest pharma companies in the world - who in a matter of 5 years will bring a weight loss pill to this world - is ready for a new start. Still somewhat of a falling knife - so be careful. But keep an eye out for a speedy return upwards. NYSE:LLY on the other hand has a bit of the same trend BUT… price has hit the top of the channel…
OMXCOP:NOVO_BLong
by FourApplesADay
1122334455667788991010111112121313141415151616171718181919202021212222
…999999

Made by humans

Select market data provided by ICE Data Services. Select reference data provided by FactSet. Copyright © 2026 FactSet Research Systems Inc.Copyright © 2026, American Bankers Association. CUSIP Database provided by FactSet Research Systems Inc. All rights reserved. SEC filings and other documents provided by Quartr.© 2026 TradingView, Inc.

More than a product
  • Supercharts
Screeners
  • Stocks
  • ETFs
  • Bonds
  • Crypto coins
  • CEX pairs
  • DEX pairs
  • Pine
Heatmaps
  • Stocks
  • ETFs
  • Crypto coins
Calendars
  • Economic
  • Earnings
  • Dividends
  • IPOs
More products
  • News Flow
  • Portfolios
  • Fundamental Graphs
  • Yield Curves
  • Options
  • Macro Maps
  • Pine Script®
Apps
  • Mobile
  • Desktop
Community
  • Social network
  • Wall of Love
  • Refer a friend
  • House Rules
  • Moderators
Ideas
  • Trading
  • Education
  • Editors' picks
Pine Script
  • Indicators & strategies
  • Wizards
  • Freelancers
  • Paid Spaces
Tools & subscriptions
  • Features
  • Pricing
  • Market data
  • Gift plans
Trading
  • Overview
  • Brokers
  • Brokers comparison
  • The Leap
Special offers
  • CME Group futures
  • Eurex futures
  • US stocks bundle
About company
  • Who we are
  • Space mission
  • Blog
  • Help Center
  • Careers
  • Media kit
Merch
  • TradingView store
  • Tarot cards for traders
  • The C63 TradeTime
Policies & security
  • Terms of Use
  • Disclaimer
  • Privacy Policy
  • Cookies Policy
  • Accessibility Statement
  • Security tips
  • Bug Bounty program
  • Status page
Business solutions
  • Widgets
  • Charting libraries
  • Lightweight Charts™
  • Advanced Charts
  • Trading Platform
Growth opportunities
  • Advertising
  • Brokerage integration
  • Partner program
  • Education program
Community
  • Social network
  • Wall of Love
  • Refer a friend
  • House Rules
  • Moderators
Ideas
  • Trading
  • Education
  • Editors' picks
Pine Script
  • Indicators & strategies
  • Wizards
  • Freelancers
  • Paid Spaces
Business solutions
  • Widgets
  • Charting libraries
  • Lightweight Charts™
  • Advanced Charts
  • Trading Platform
Growth opportunities
  • Advertising
  • Brokerage integration
  • Partner program
  • Education program
Look FirstLook First