• Products
  • Community
  • Markets
  • Brokers
  • More
Get started
  • Markets
  • /Denmark
  • /Stocks
  • /Ideas
$NOVO_B updated channelNovo Nordisk has had a tough time over the past 13 months, with its stock falling significantly. The main reason is growing investor concern that the explosive growth in sales of Wegovy and Ozempic may be slowing down, especially as competition heats up — particularly from Eli Lilly. Just a few days ago, Novo cut its full-year growth forecast, which confirmed some of those market worries. At the same time, they announced a leadership change. Current CEO Lars Fruergaard Jørgensen is stepping dow
OMXCOP:NOVO_BLong
by FourApplesADay
NOVO potential enter zoneThe stock is trading inside a major monthly “BUY ZONE” (DKK 280–325), which aligns with historical Fair Value Gaps (FVGs) from 2015–2018. A Higher Low (HL) structure has formed, and as long as it holds, the long-term bullish structure remains valid. Multiple FVGs have now been retested, suggesting a potential accumulation phase.
OMXCOP:NOVO_BLong
by nesconfenix
1
$NOVO_BNovo Nordisk has had a tough time over the past 13 months, with its stock falling significantly. The main reason is growing investor concern that the explosive growth in sales of Wegovy and Ozempic may be slowing down, especially as competition heats up — particularly from Eli Lilly. Just a few days ago, Novo cut its full-year growth forecast, which confirmed some of those market worries. At the same time, they announced a leadership change. Current CEO Lars Fruergaard Jørgensen is stepping dow
OMXCOP:NOVO_BLong
by FourApplesADay
1
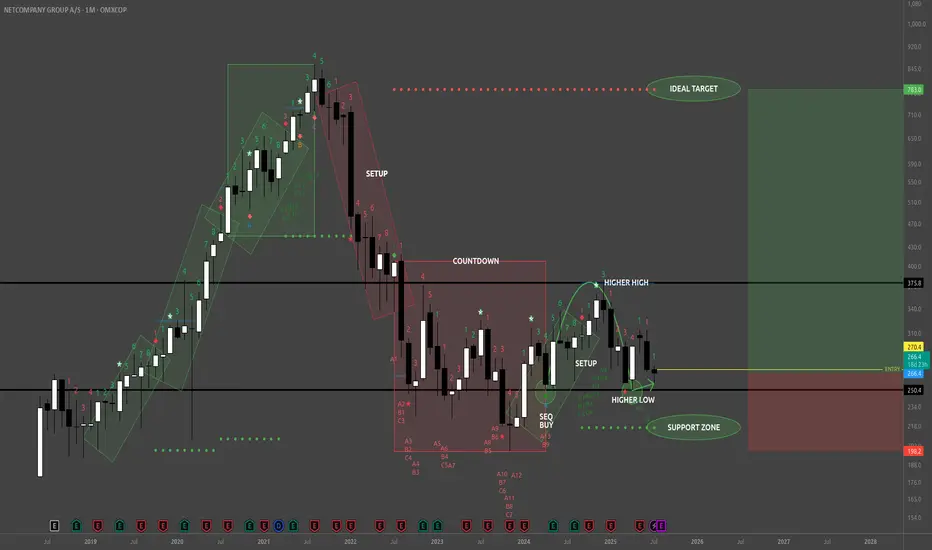
NETC - BuyReading the NETC Monthly chart from the left to right look at that remarkably strong bullish trend (green rotated rectangles) which spanned 3 consecutive TD 1-9 Setups. That's 9 strong months of uptrend culminating in the beginning of the bearish trend with a TD Sequential 13 Sell signal at the apex, a Bearish Engulfing Pattern, and a large Doji immediately preceding the TD 1-9 Setup (red rotated rectangle) which exhausted the downward momentum, and dissipated the downward momentum with the TD S
OMXCOP:NETCLong
by zerocashcool
Updated
DSV – Potential reversal after break down from uptrend DSV was in a rising trend but formed a small head-and-shoulders formation (HS), which led to a negative breakout. In the following three months, the price development can be interpreted either as a rectangular consolidation (REC) or a short-term downtrend. The price then dropped sharply to a pointed V-shaped bottom on April 9, followed by a strong rebound. Volume increases and falls in a V-shape – the development resembles a final rally, although such a rally typically follows a longer calm upt
OMXCOP:DSV
by scorpiris
NOVO expected to reach ATH during 2026Based on EW count and general knowledge about the company, it is expected that Novo will get back to the top (approx x2 from here) during 2026. Lets see
OMXCOP:NOVO_BLong
by jespergarm
1
Novo Nordisk: Massive buying opportunityNovo has been struggling big time, december and march hit especially hard. American institutions have held large positions in Novo, and this was felt when they had to sell off due to risk management with the looming tariffs. However, the sheer devaluation & importance of their export, is going to create a massive wave following a risk-on environment, which i firmly believe is coming. One of the few large EU based firms worth investing heavy in.
OMXCOP:NOVO_BLong
by RuinedNarrative
1
Genmab 4h longZone + 1st measured move PB. Could potentially go all the way up to the expanding triangle top?
OMXCOP:GMABLong
by BaliShag
Updated
2
Novo 1h longShould get up and at least break the neckline from the bigger SHS/IHS. Stop below zone or lower trendline.
OMXCOP:NOVO_BLong
by BaliShag
Updated
Novo Nordisk Stock Chart Fibonacci Analysis 050925Trading Idea 1) Find a FIBO slingshot 2) Check FIBO 61.80% level 3) Entry Point > 411/61.80% Chart time frame: D A) 15 min(1W-3M) B) 1 hr(3M-6M) C) 4 hr(6M-1year) D) 1 day(1-3years) Stock progress: A A) Keep rising over 61.80% resistance B) 61.80% resistance C) 61.80% support D) Hit the bottom E) Hit the top Stocks rise as they rise from support and fall from resistance. Our goal is to find a low support point and enter. It can be referred to as buying at the pullback point. The pullback p
OMXCOP:NOVO_B
by fibonacci6180
Novo Nordisk's The recent drop in Novo Nordisk's stock price is attributed to several factors. A key issue is the company’s struggle to meet the surging demand for its weight-loss drugs, such as Wegovy. Although demand remains strong, investors are concerned about Novo Nordisk's ability to scale up production and deliveries, which is creating downward pressure on the stock. Additionally, some recent financial results failed to meet Wall Street expectations. Despite revenue growth in key product categories, ov
OMXCOP:NOVO_BLong
by SimeonNikolaev-invest
Updated
NVO absolutely sweet levelThis downturn is attributed to disappointing clinical trial results for some of its drugs and concerns over potential tariffs affecting Denmark. Additionally, competition from Eli Lilly's successful weight-loss drug trials has impacted investor confidence. ​ Despite these challenges, analysts note that Novo Nordisk maintains strong fundamentals and a positive long-term outlook, particularly in its core areas of diabetes and obesity treatments.
OMXCOP:NOVO_BLong
by TMEW
Looking kind of LongAfter a really red day for Maersk it reached the main lower trendline and right away bounced back up. I will first see if the price respects the lower main trend and the be looking for a good Long position for the coming days until it reaches the upper trendline on the lower timeline. So far so good.. share you thoughts!
OMXCOP:MAERSK_BLong
by Bluekelds
Updated
Maersk keeps following trend-line, potential short position.Right after the latest Ex-day for dividends it breached the lower trend-line, but worked its way back to it. Yesterday it hit the roof of the upper trend-line and MACD switched to bearish. I will be looking for a short position and expecting a low price around 11200 DK. Share your thoughts, maybe I am missing something big?
OMXCOP:MAERSK_BShort
by Bluekelds
Updated
Short-term idea for upcoming days after Ex-day of DevidendsI will be looking for the passing of the short-term trendline for a short-position tomorrow on Ex-day. My MACD-signal has flipped and yesterday ended right before a potential breakout or Head and Shoulders. Downward trend were confirmed March 14th and has been respected three times already. If continued we could expect price down to 11500 DKK. This is my first printed "idea" on TradingView and in general, take this with a pinch of salt. Please share your thoughts and counter-ideas if any!
OMXCOP:MAERSK_BShort
by Bluekelds
Updated
1
A.P. Møller – Mærsk A/S Bullish Sentiment OMXCOP:MAERSK_A is approaching a major supply zone around 12,800–13,200 DKK, which has previously acted as strong resistance. The stock has been forming higher lows, respecting a long-term ascending trendline, indicating overall bullish structure unless that trendline is broken. In the short term, a W-pattern is forming, indicating bullish momentum towards the supply zone. However, there is a risk of forming a Head and Shoulders pattern, which would be bearish if confirmed. It is also importa
OMXCOP:MAERSK_ALong
by Gxbee
1
BAVARIAN NORDIC BAVA LARGE ASCENDING TRIANGLE FORMATIONHello Traders, Here is my chart idea for Bavarian Nordic. This idea is solely based on me looking at the chart formation and no research has been done into the companies financials, potential upcoming vaccines or anything like that. The price has been going sideways inside a large ascending triangle for about 22 years now and price movement still looks to be corrective waves not impulsive waves. It looks like the price wants to come down to the bottom trendline and bounce from there. This woul
OMXCOP:BAVA
by WickHunter
Gubra bullish from hereEW and trendlines indicates further increase from here.
OMXCOP:GUBRA
by jespergarm
DFDS bearish target hit -> bottom?As shown on an older chart, this was the target for the down trend.. Symmetry + ab=cd reached at channel low and a zone. 54% to the first upside target! Let's go. SL might be too optimistic, but I'm willing to try a few times. Would be f'ing epic :D /edit.. There's a minor first target at gap close at 130
OMXCOP:DFDSLong
by BaliShag
NOVO buyAny break below 810 is a buy. Novo has a lot of upside still left
OMXCOP:NOVO_BLong
by shiftpark
Updated
5
Solar.eu searching for the bottomAnalyzing RSI divergence, EW Solar.eu seems to be nearing the bottom. Healthy economy. The stock is expected to bottom at around 250 this summer. Then it should be good buy
OMXCOP:SOLAR_B
by jespergarm
Novo is going to 480. Wait for it!OMXCOP:NOVO_B Is declining to 480. I think that will be a good price to buy. It has a lot of bad news ahead. But this bad news is not that bad. So see you at 480!
OMXCOP:NOVO_B
by sadegh3783
Updated
1
Last chance for DNORD at this lvl - 4hI have nothing below, so if this doesn't hold I'd suggest it'll continue to at least 175 DKK. I don't trade harmonic patterns any more and haven't got a clue on their win rate these days, but it is a nice bat pattern too ;) Haven't got too much trust in this lvl, but I thought I'd share it since there's a decent drop to the next area of interest.
OMXCOP:DNORDLong
by BaliShag
Vestas turning bullish Given strong divergence on RSI, correlation on wave extensions, high volume below and EW count the target for the earnings date 5. feb is about 90. From there Vestas is expected to turn bullish. Beware that current P/E is about 250 There is some correlation to the Ørsted count
OMXCOP:VWSLong
by jespergarm
12345678910111213141516171819202122
…999

Made by humans

Select market data provided by ICE Data Services. Select reference data provided by FactSet. Copyright © 2026 FactSet Research Systems Inc.Copyright © 2026, American Bankers Association. CUSIP Database provided by FactSet Research Systems Inc. All rights reserved. SEC filings and other documents provided by Quartr.© 2026 TradingView, Inc.

SOC 2 CompliantGDPR Compliant
More than a product
  • Supercharts
Screeners
  • Stocks
  • ETFs
  • Bonds
  • Crypto coins
  • CEX pairs
  • DEX pairs
  • Pine
Heatmaps
  • Stocks
  • ETFs
  • Crypto coins
Calendars
  • Economic
  • Earnings
  • Dividends
  • IPOs
More products
  • News Flow
  • Portfolios
  • Fundamental Graphs
  • Yield Curves
  • Options
  • Macro Maps
  • Pine Script®
  • MCP Server
Apps
  • Mobile
  • Desktop
Community
  • Social network
  • Wall of Love
  • Refer a friend
  • Creator program
  • House Rules
  • Moderators
Ideas
  • Trading
  • Education
  • Editors' picks
Pine Script
  • Indicators & strategies
  • Wizards
  • Freelancers
  • Marketplace
Tools & subscriptions
  • Features
  • Pricing
  • Market data
  • Gift plans
Trading
  • Overview
  • Brokers
  • Brokers comparison
  • The Leap
Special offers
  • CME Group futures
  • Eurex futures
  • US stocks bundle
About company
  • Who we are
  • Space mission
  • Blog
  • Help Center
  • Careers
  • Media kit
Merch
  • TradingView store
  • Tarot cards for traders
  • The C63 TradeTime
Policies & security
  • Terms of Use
  • Disclaimer
  • Privacy Policy
  • Cookies Policy
  • Accessibility Statement
  • Trust Center
  • Security tips
  • Bug Bounty program
  • Status page
Business solutions
  • Widgets
  • Charting libraries
  • Lightweight Charts™
  • Advanced Charts
  • Trading Platform
Growth opportunities
  • Advertising
  • Brokerage integration
  • Partner program
  • Education program
Community
  • Social network
  • Wall of Love
  • Refer a friend
  • Creator program
  • House Rules
  • Moderators
Ideas
  • Trading
  • Education
  • Editors' picks
Pine Script
  • Indicators & strategies
  • Wizards
  • Freelancers
  • Marketplace
Business solutions
  • Widgets
  • Charting libraries
  • Lightweight Charts™
  • Advanced Charts
  • Trading Platform
Growth opportunities
  • Advertising
  • Brokerage integration
  • Partner program
  • Education program
Look FirstLook First