 LongLong



 Long

Vestas Bottoming OutProbably looking at a stabilization here at 200sma, october correction, fib level 0.5 from march low and a strong psychological 1000kr share price as resistance. expecting some sideways action for a while


C


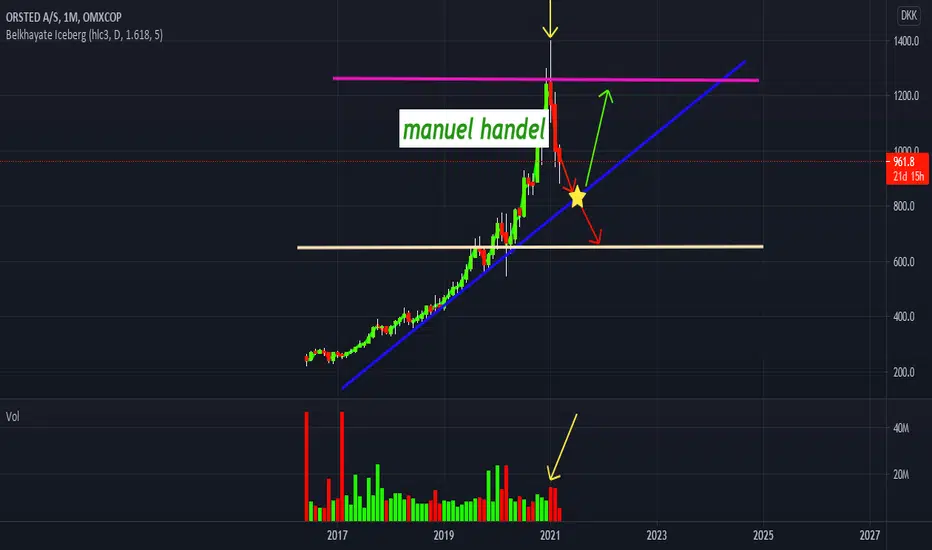
ORSTED down This monthTænke This month i think ORSTED Down volum up down+ VWAP . Jeg bruger ikke Jeg bruker ikke stop loss for ikke å vise papirene mine til handelsalgoritmene
Short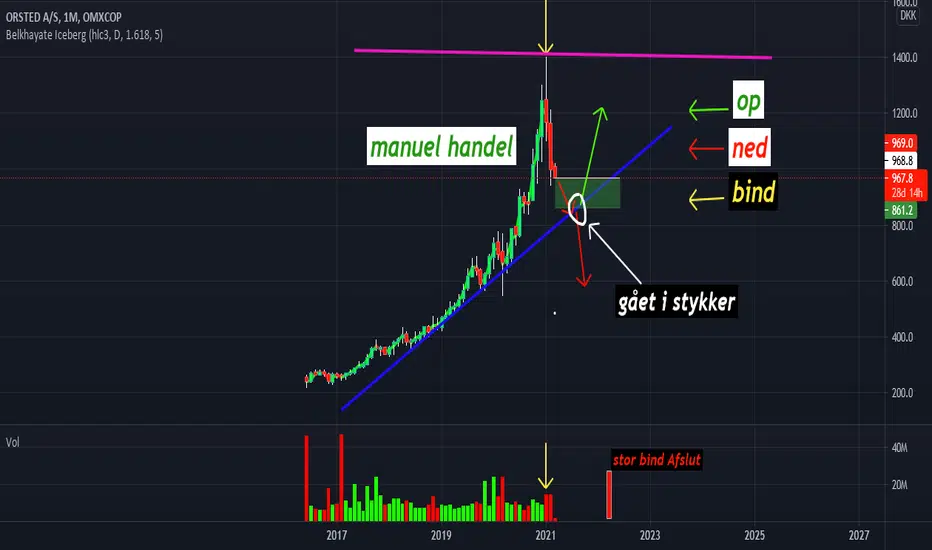
Orsted double divergence + 200 MA supportPretty simple stuff
Seems like a hidden bullish (continuation) divergence have played out, though it failed so far.
However, a regular divergence is also playing out atm, and could be supported by strong support on the Daily 200 SMA
Dividend registration day is today the 2nd of march, and will be paid out the 4th of march.
Long
VWS | Correction complete?Hi all,
my previous chart on Vestas Wind Systems didn't quite go to plan. The stock price has just been ladderring down since it's 8th of January ATHs @1605 DKK, and I've gladly been picking up more shares on the cyclical troughs.
Now VWS is really looking for a turnaround. Some positives:
- We are finally sitting at a very strong support range @~1160 DKK, which is our first real support after this crashed through 1286 DKK;
- Price is approaching our long-term uptrend support, which hasn't f
Long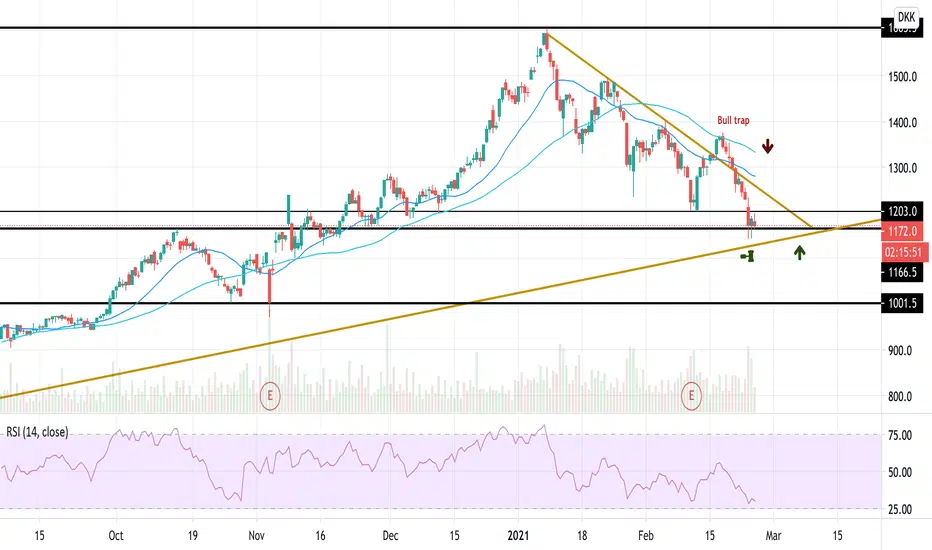
Reversal in?Huge wick/Hammer + Volume spike off of the 200 day SMA today - Could this indicate the short term bottom for Orsted?
Long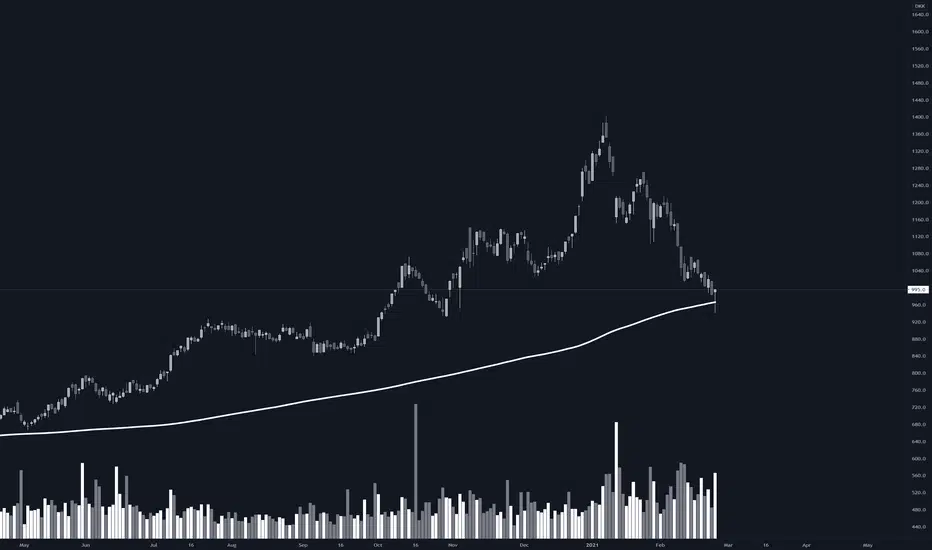
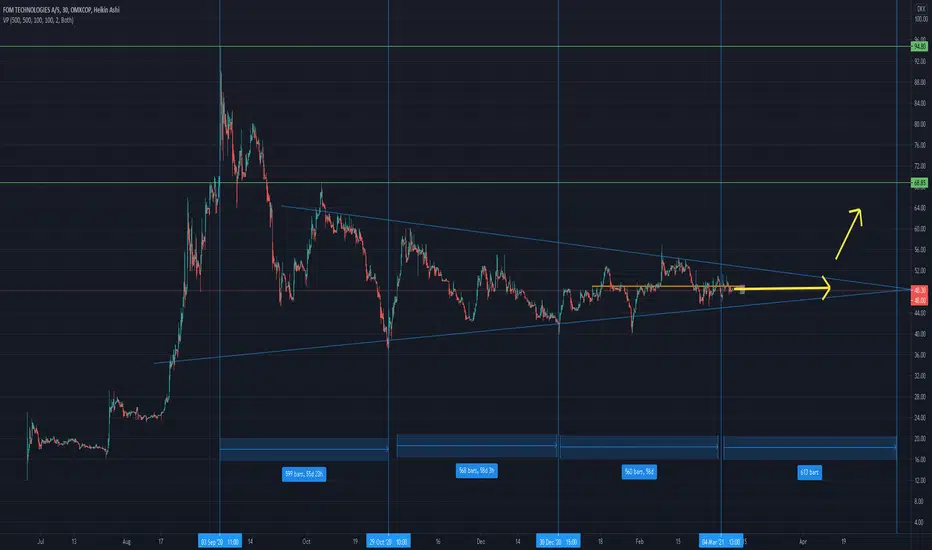
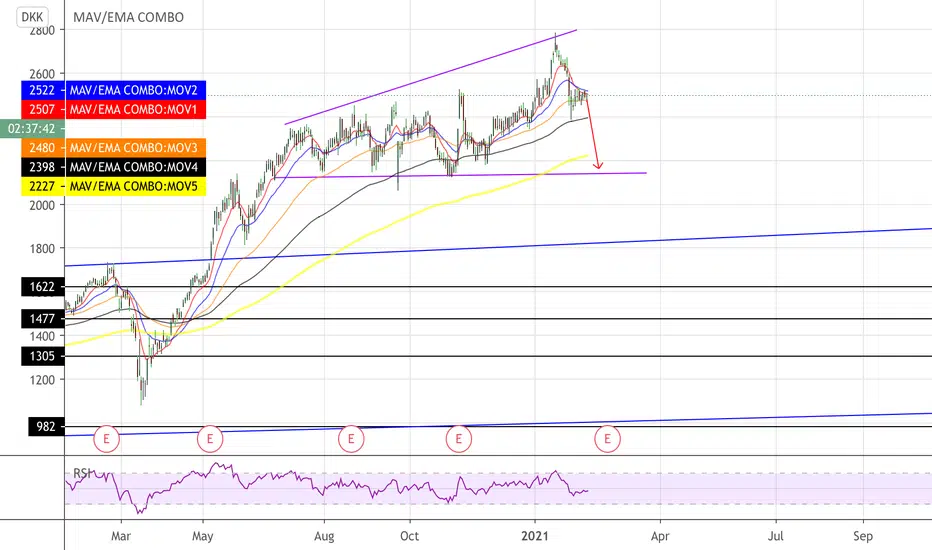
Symmetrical triangle DBA uptrend is ongoing and could result in a significant increase. The prime reason for our investment into DB is for the underlying value at 187,5 DKK.
The bank is trading at a low P/E for any C25 companies and as a bank it is as well trading beyond it's closest peers.
With a P/E at under 0,6 the company trades under bookvalue.
DISCLAIMER:
NB Holdings owns and trades this stock
This cannot be seen as financial advice.
 Long

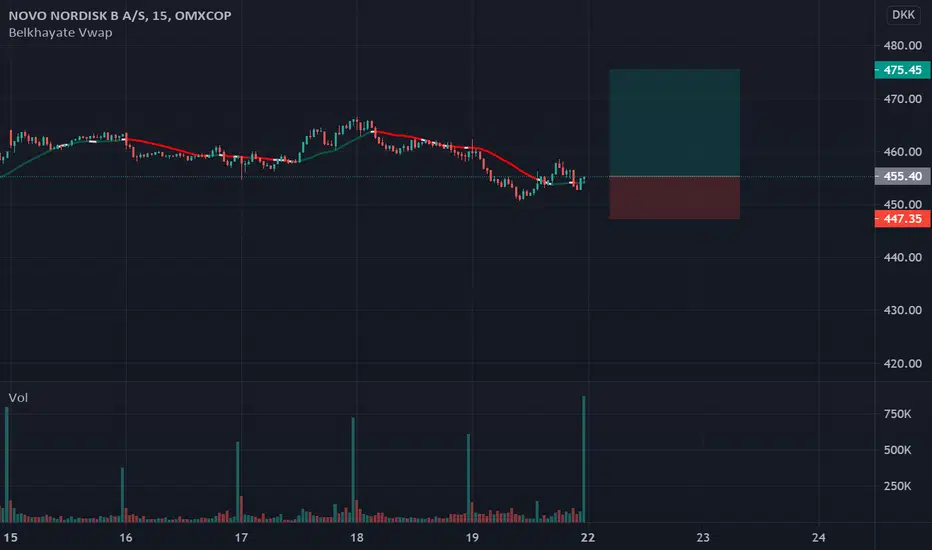
A wild guess. Its hard to to realize whats the future will bring for Vestas. For sure it will eventually hit 2000DKK but the question is when. Its not impossible to see it fall to 1000DKK due to high correction. before moving higher up. This setup is based on the Elliot waves that im not so into. and it have started correction up. This prediction is a mix of optimitic and pessimistic.
 Long
 Long

Orsted possible V-bottomSince my last update, Orsted has been sitting just under the Support at the High Volume Node, and also been shaping what seems to be a double bottom on the 4-hour chart. On a bit longer term it also shaped a bearflag/bearpennant, which should be rejected due to higher time frame trend such a's long term EMA's & RSI.
Currently a hammer-candle is present on the 4-hour chart, with its lower wick touching the excact bottom in the double bottom. Due to the extra consolidation time since last update,
Long
We have seen 30 pct. correction in ØRSTED - Now way oversoldThis seems to be matter of short time before investors run for ØRSTED again - ESG-funds have massive money-inflows to invest. ØRSTED is one og the best pue play ESG companies.
Long
Time for an upswingTRYG A/S
Trickerkode: Tryg
er ved at blive spændende, både FA og teknisk, dog kunne den tekniske del godt bruge lidt flere positive tegn.
Men mon ikke den holde sig til din range kanal!?
Synes i hvertfald det er er god risk/reward i forhold til dette swing som er vist på chartet.
Open trade til kurs 177-179
Take profit til kurs 205-208 ( max gain 17 % )
Stop loss til kurs 171-172 ( max loss 3,30 % )
Risk / reward Ratio: 5,12
Tryg A/S er en god stabil dansk aktie, der hele tiden har fingeren på
Long
Orsted bounce or inevitable beartrendSeems like it's make or break time - a lower low would establish a beartrend since the uptrend would be broken.
A bounce off of the high volume area would continue the uptrend.
Bear time if the price drops below 1025.5 in my opinion
Long
 Short
 Short

ORSTED: BUYThe price has corrected 25% from ATH and it is equal to the correction it went through in the March crash. A solid company that missed earnings. A buy for me for the long-term.
Long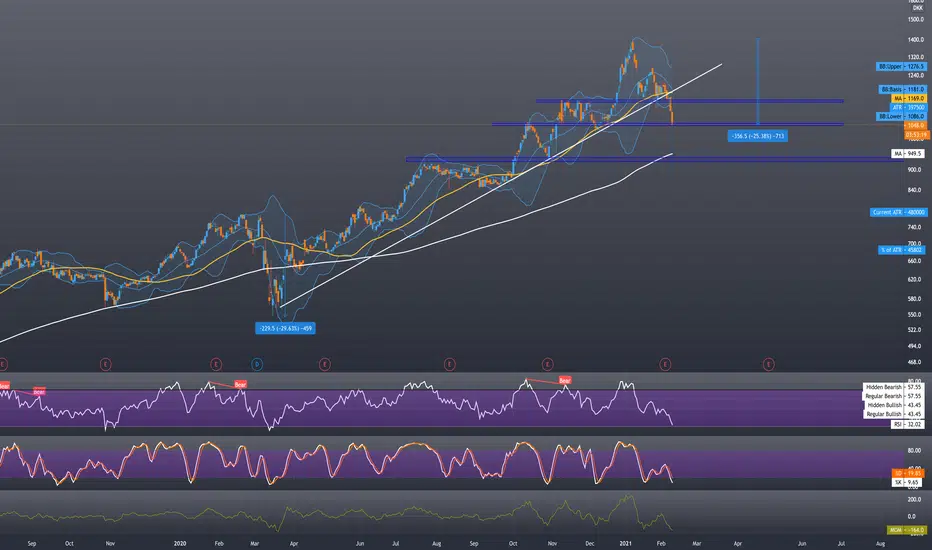
Orsted AnalysisNormally I would look for a buy close to the uptrend. In this situation the support between 1072 DKK and 1056 DKK seems solid enough to enter the trade a but more aggressively. I have a by order at 1064.5 DKK.
Long