NEIMETH This is a bullish recovery candidate, but not yet a confirmed breakout. Price is sitting at ₦8.55, around the 61.8% retracement area, after a prolonged correction from roughly ₦14.85.
Key levels
Level Price Role
Current ₦8.55 Accumulation area
61.8% Fib ₦8.80 Immediate resistance/pivot
78.6% Fib ₦7.25 Major support
50% Fib ₦9.95 First major confirmation
38.2% Fib ₦11.05 Secondary resistance
Previous high ₦14.85 Major structural target
Fib extension ₦17.15 Expansion target
Structure
The major move from around ₦5.25 → ₦14.85 has undergone a deep correction.
What's notable is that despite several attempts lower, price has repeatedly found demand around roughly ₦7.80–₦8.30. That suggests the selling pressure is becoming less effective.
But there's still an important issue: the descending trendline hasn't been decisively broken.
So I'd classify the present structure as:
Deep correction → potential base formation → awaiting bullish confirmation.
The first thing I want to see is a clean recovery through ₦8.80, followed by ₦9.95.
₦9.95 is particularly important
A sustained break above ₦9.95 would do considerably more for the setup than simply bouncing from ₦8.
It would mean price has:
reclaimed the 50% retracement + broken back into the upper half of the range + likely cleared the descending structure.
Then the progression becomes:
₦9.95 → ₦11.05 → ₦14.85
Above ₦14.85, the previous correction becomes much less relevant because NEIMETH would be making a significant structural breakout.
That exposes your ₦17.10–₦17.15 extension.
Signal-style map
NEIMETH
Current: ₦8.55
Accumulation region: ₦7.25–₦8.80
TP1: ₦9.95
TP2: ₦11.05
TP3: ₦14.85
Extended TP: ₦17.15
From ₦8.55, that's approximately +16.4%, +29.2%, +73.7%, and +100.6%, respectively.
Risk level
₦7.25 is the important line in the sand.
A brief wick beneath it isn't necessarily fatal, but sustained acceptance below ₦7.25 would weaken the accumulation thesis substantially and increase the possibility of retracing toward the ₦5.25 origin.
Verdict
Bias: 🟢 Bullish Watch / Potential Re-Accumulation
I'd rate this below FTN Cocoa at this exact moment because NEIMETH still has more overhead structure to clear.
However, if NEIMETH breaks ₦9.95–₦10.00 convincingly, the setup becomes significantly stronger. At that point, ₦11.05 becomes the next hurdle, and a return to ₦14.85 becomes technically credible.
Your ₦17.10 target is therefore reasonable as an extension target — but it should come after a confirmed ₦14.85 breakout, rather than being treated as the immediate target from ₦8.55.  Long
Long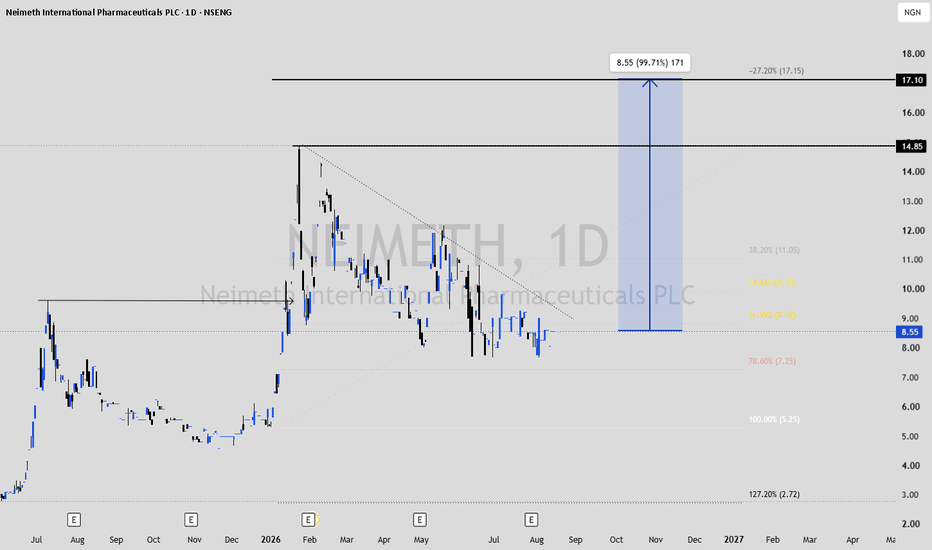
FTN COCOA BUYS This setup is constructive, and compared with Oando, FTN Cocoa appears further along in trying to establish a bullish continuation structure.
Current price on your chart is ₦8.80, sitting just above the 50% retracement at ₦8.45.
Key levels
Zone Price Interpretation
Current ₦8.80 Price attempting to recover
50% Fib ₦8.45 Immediate pivot/support
61.8% ₦7.65 Stronger support
71% ₦6.95 Bullish thesis defence zone
30% ₦9.90 First major resistance
Previous high ₦12.00–₦12.05 Major breakout level
Extension 1 ₦14.00 Primary upside target
Extension 2 ₦16.45 Larger extension
What I see structurally
The important development is the compression following the explosive move into ₦12.
Instead of completely unwinding that rally, FTN has spent several months consolidating predominantly between roughly ₦7 and ₦10.
Your descending resistance line and rising support structure are now converging. That creates a compression / re-accumulation thesis.
The recent rejection around ₦8.00 is particularly interesting because it occurred above the 61.8% retracement.
For me, ₦8.45 is now the immediate pivot.
If FTN can hold above that area and start producing daily closes above approximately ₦9.00–₦9.20, I'd become considerably more interested in the bullish continuation.
The critical confirmation is ₦9.90
This is where I'd distinguish between potential and confirmation.
A clean break and hold above ₦9.90 would:
clear the 30% retracement;
break the upper portion of the compression;
expose the previous ₦12 high;
substantially strengthen the continuation thesis.
Then ₦12 becomes the big test.
A confirmed breakout above ₦12 would put FTN into expansion territory, making ₦14.00 a technically reasonable first extension and ₦16.45 the larger objective.
My technical map
Accumulation / support: ₦7.65–₦8.45
Current: ₦8.80
TP1: ₦9.90
TP2: ₦12.00
TP3: ₦14.00
Extended target: ₦16.45
From ₦8.80, those correspond to approximately +12.5%, +36.4%, +59.1%, and +86.9%, respectively.
Invalidation
The level I would watch closely is ₦6.95.
A sustained breakdown beneath the 71% retracement would materially weaken this particular bullish structure. At that point, the possibility of a much deeper retracement toward the ₦4.90 origin has to be reconsidered.
So I wouldn't frame FTN as simply “₦8.80 → ₦14.” The cleaner thesis is:
Hold ₦7.65–₦8.45 → reclaim ₦9.90 → attack ₦12 → breakout → ₦14 → potentially ₦16.45.
Bias: 🟢 Bullish / Re-accumulation candidate
The ₦12 breakout is the event that converts this from a recovery setup into a much stronger long-term continuation setup.  Long
Long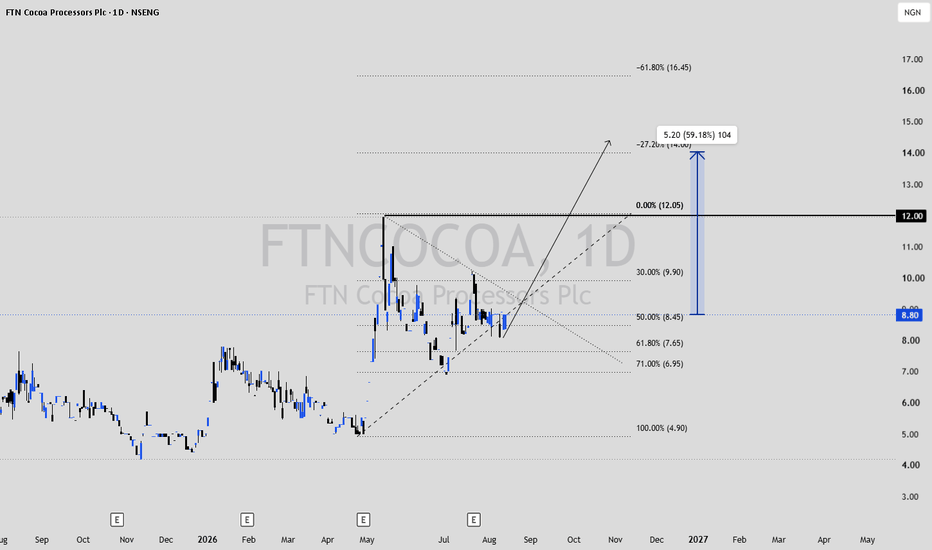
OANDO BUYS This is an interesting monthly structure. Oando is currently around ₦35.10, almost exactly at the 61.8% Fibonacci retracement at ₦35.00.
Your chart suggests the larger bullish expansion may not necessarily be over, but the correction may still need one final leg lower before the next major markup phase.
Key levels from the chart
Level Price Significance
Current Price ₦35.10 Sitting directly at 61.8%
61.8% Fib ₦35.00 Immediate support
71% Fib ₦27.60 Major accumulation / potential C-wave completion
50% Fib ₦44.50 First recovery barrier
30% Fib ₦60.65 Major resistance
Previous high ₦84.80 Structural breakout level
Major Target ₦100.20–₦106.70 First extension region
Extended Target ₦134.60 Long-term bullish extension
The ABC structure is the important part
I can see why you've labelled this A-B-C.
The initial decline from the ₦80+ region forms A, followed by the recovery toward roughly ₦55–₦60 as B. Price is now declining again, potentially developing the final C leg.
That makes ₦27.60–₦35.00 particularly important.
I wouldn't treat ₦35 as an automatic bottom. Your projected path toward approximately ₦27–₦30 actually makes technical sense if C still needs completion.
If price reaches that area and produces a convincing monthly reversal, the risk/reward changes considerably.
Bullish roadmap
The sequence I'd want to see is:
₦35 → potentially ₦27.60 → reversal → ₦44.50 → ₦60.65 → ₦84.80 → ₦100+ → ₦134.60
The real confirmation isn't simply bouncing from ₦35. A recovery through ₦44.50, followed eventually by ₦60.65, would provide much stronger evidence that the corrective structure has finished.
Above ₦84.80, we'd be dealing with a completely different technical situation: price discovery / bullish expansion becomes the dominant thesis.
Signal-style summary
OANDO PLC
Market Phase: Major Correction / Potential Re-Accumulation
Current Price: ₦35.10
Preferred Accumulation Region: ₦27.60–₦35.00
TP1: ₦44.50
TP2: ₦60.65
TP3: ₦84.80
Extended Target: ₦100.20–₦106.70
Long-Term Extension: ₦134.60
Technical Bias: 🟢 Bullish long term, but short-term downside risk remains while the proposed C-wave is incomplete.
One thing I particularly like about this chart is the asymmetry: around ₦28–₦35, the chart is contemplating a potential long-term move back toward ₦85–₦100+, rather than chasing Oando after such a move has already happened. The trade-off is that confirmation is currently weak, so the accumulation thesis and the confirmed bullish thesis should be treated separately.  Long
Long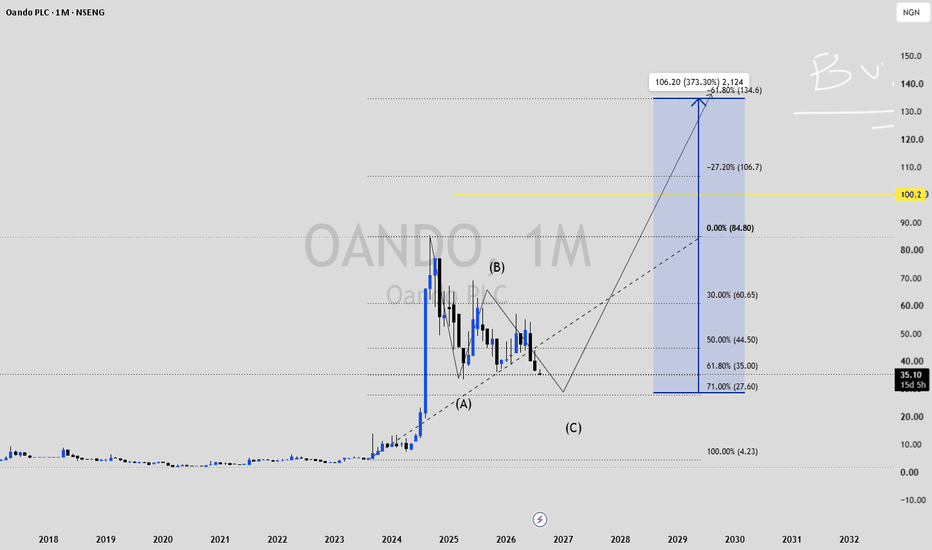
 Long
Long
 Long
Long
 Long
Long
GTCO (NGX) Stock AnalysisNSENG:GTCO (NGX) Stock Analysis
GTCO on the Nigerian Stock Exchange experienced an unprecedented rally, reaching as high as the ₦157 price zone. Like many other stocks on the exchange, it has since undergone a significant pullback, retracing more than 50% of that upward move.
At the moment, the stock is trading just above the 50% Fibonacci retracement level. Based on my chart analysis, I have also identified a supporting trendline.
From my perspective, I will begin dollar-cost averaging (DCA) into GTCO from around the ₦115 per share zone. Rather than making a single entry, I plan to build my position gradually through multiple purchases as the market develops.
To manage risk conservatively, I will place my stop-loss just below the 61.8% Fibonacci retracement level, which is around ₦108 per share. If the stock breaks below ₦108–₦105, I will accept the loss and exit the position.
From a medium- to long-term perspective, I remain bullish on the stock. If the current support holds, I expect GTCO to resume its upward trend.
My price targets are:
First target: ₦138 per share
Second target: ₦145 per share
As always, this is my personal market analysis based on technical analysis and risk management principles. It is not financial advice, and every investor should conduct their own research before making investment decisions.
 Long
Long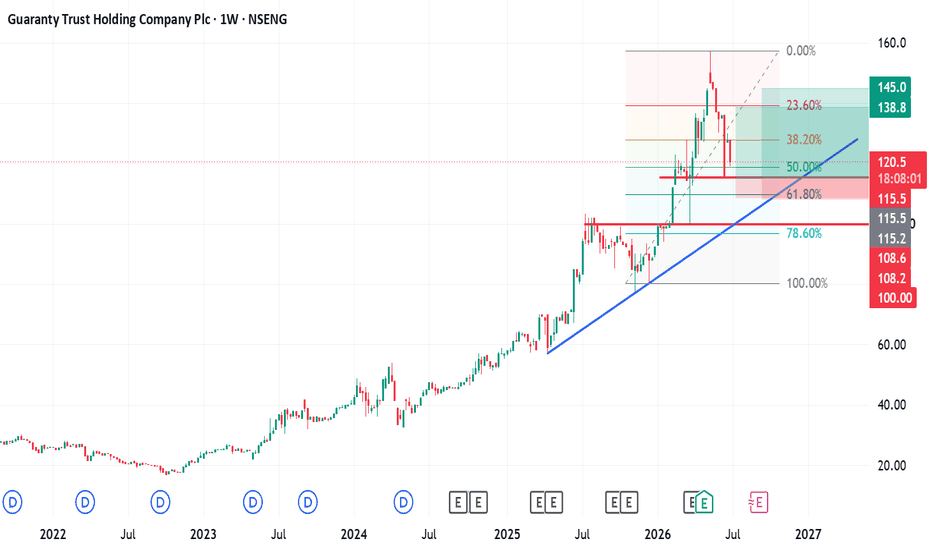
Zenith Bank Shares Pull Back to Key Fibonacci SupportLooking at NSENG:ZENITHBANK stock on the Nigerian Stock Exchange, a lot has been happening lately. The stock rallied to a high of ₦137 per share, which marked its all-time high, before pulling back. It has now retraced to around the 50% Fibonacci retracement level, which is approximately ₦100 per share.
Technically, I believe the stock is likely to resume its upward movement from this level if the underlying fundamentals remain favorable. On my chart, the ascending trendline also converges around the ₦100 price zone**, creating a strong area of technical confluence.
Based on this analysis, I plan to begin building my position using a dollar-cost averaging (DCA) strategy. I will start buying from around ₦100 per share. If the stock declines further, I will continue buying to average my entry price.
However, if the price falls to around ₦90 per share, I am likely to exit the position and accept a loss. For now, I'll continue monitoring how the market develops from here.
 Long
Long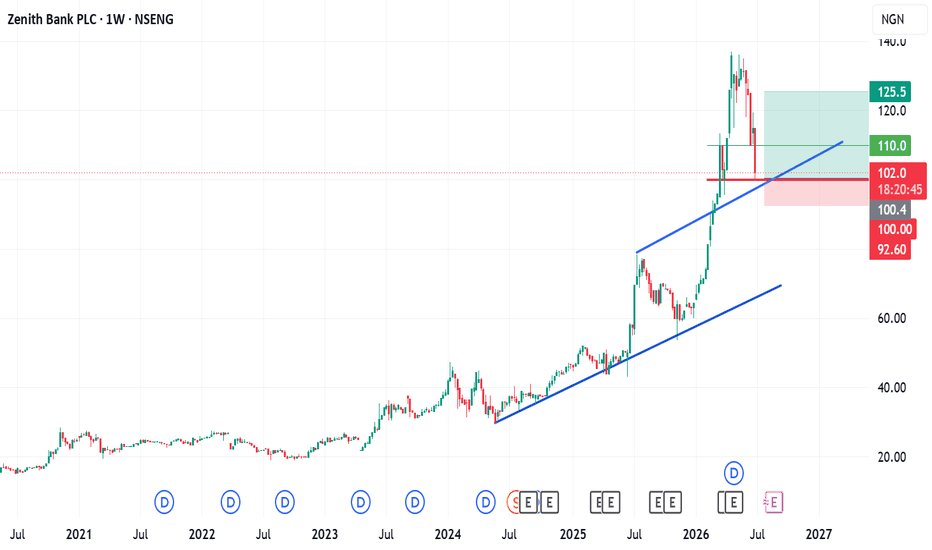
 Long
Long
 Long
Long
 Long
Long
 Long
Long
Long 
 Long
Long
 Long
Long
DANGOTE SUGAR - THE THIRD CALL IS ALREADY RUNNING.NSENG:DANGSUGAR
— How Dangote Sugar went from ₦72.50 to ₦95.30 in 9 days, why it could still have 106% left to give, and what sugar has to do with the food on every Nigerian's plate.
Let me tell you what happens when a pattern keeps working.
December 21, 2025 — I posted DANGCEM at ₦610. It ran to ₦1,100 (+93.4%).
Same night — I posted ZENITHBANK at ₦63.30. It ran to ₦136.9. +116%. Made banking history. Twice.
Both calls timestamped. Both public. Both documented.
Then on April 28, 2026, I published a third chart.
DANGSUGAR. ₦72.50.
Nine days later — ₦95.30. First target already cleared. Three more ahead. Final take-profit: ₦150.0.
That is a potential +106.9% from the published entry. And this one is still live.
BUT BEFORE THE CHART — UNDERSTAND WHAT THIS COMPANY IS.
Dangote Sugar Refinery Plc was founded in 1999 and listed on the Nigerian Exchange in 2007. It is Nigeria's largest sugar refinery. And I want you to think about what that actually means.
Sugar is invisible. That's what makes it powerful.
You don't think about sugar when you tear open a sachet of Lipton. You don't think about it when you crack open a Coca-Cola, take a malaria tablet, bite into a Rich Tea biscuit, or stir your Milo. But it's there. In every single one of those products. And in Nigeria — Africa's most populous nation, with over 220 million people — the sugar in most of those products passes through one company.
This one.
Dangote Sugar doesn't just sell to consumers. It sells Vitamin A-fortified sugar for direct household consumption. It sells unfortified industrial sugar to pharmaceuticals, food manufacturers, and beverage companies. Its supply chain touches millions of Nigerians every day — most of whom have never heard of a DANGSUGAR ticker symbol.
That invisible ubiquity is not a weakness. It is a moat.
And when a company with that kind of structural demand position in a growing economy shows up on a monthly chart looking compressed, with a long-term ascending trendline intact and a horizontal demand zone holding — you pay attention.
I paid attention. On April 28, 2026 at 13:12 UTC+1.
"...a live projection on DANGOTE SUGAR REFINERY PLC published April 28, 2026, targeting Mariya Aliko Dangote's commercial mandate directly..."
THE SETUP — SAME FRAMEWORK. SAME SIGNALS.
The DANGSUGAR monthly chart was reading from a familiar page.
1. A long-term ascending trendline dating back to 2015–2016. Years of price memory confirming the structural bull bias. Despite periods of volatility and pullback, this trendline had never been decisively broken. That is not a coincidence. That is the market telling you where the floor is.
2. A thick horizontal support zone around ₦30. Not one test. Not two. Multiple defences of this level across different market conditions. When a price level survives that many attacks without breaking, it earns respect — and it earns the designation "demand zone."
3. A monthly candle in April 2026 beginning to respond off the confluence of both levels simultaneously.
The spring was loaded. I drew four targets: ₦84.80 — ₦105.4 — ₦130.3 — ₦150.0.
Published. Timestamped. April 28, 2026.
NINE DAYS. HERE'S WHAT HAPPENED.
Some calls take months to develop. This one moved fast.
Target 1 at ₦84.80 was cleared within days of the publication. Then on May 7, 2026, DANGSUGAR closed at ₦95.30 — a 4.3% single-session gain.
From ₦72.50 to ₦95.30 in nine calendar days.
That is +31.4%.
Let me contextualize that:
DANGSUGAR's four-week gain around this period was 47%. That ranked it 11th best performer on the entire NGX. Year-to-date from ₦60 at the start of 2026: +58.8%. Over the past 12 months: +167.29%.
This is not a quiet stock having a quiet year.
And we are still nowhere near the final target.
TP2 at ₦105.4 is approximately 10.6% away from current price. TP3 at ₦130.3 is 36.8% away. The final take-profit at ₦150.0 is +106.9% from the entry.
The monthly chart gives this thesis time. And the structure says: use it.
THE NUMBERS BEHIND THE STOCK
Here's what makes DANGSUGAR more than just a momentum play:
The fundamentals are turning.
In 2025, revenue hit ₦829.21 billion — up 24.56% year-on-year. In Q1 2026, net income came in at ₦19.17 billion. The quarter before that? Net losses of -₦53.51 billion.
That is a turnaround. Real. Measurable. In the numbers.
When a company with a dominant market position in an essential commodity — sugar — goes from losing ₦53 billion in a quarter to making ₦19 billion the very next quarter, the market takes notice. And the chart was already seeing it before the report was filed.
That is what price action can do. It reads the underlying flow of capital before the headlines confirm it.
3,181 employees. 12.1 billion shares outstanding. Market cap now above ₦1.15 trillion and rising. Nigeria's number one sugar refinery, repricing in real time as its earnings story turns the corner.
And the chart is still pointing up.
THE BIGGER PICTURE — THREE CALLS. ONE EMPIRE. ONE FRAMEWORK.
Step back and look at what this actually is.
DANGCEM — Africa's largest cement producer. Called at ₦610. Now at ₦1,180. After smashing our initial ₦1,100 target, the stock continues to climb, currently trending at ₦1,180 (+93.4%).
ZENITHBANK — Nigeria's most historic banking milestone. Called at ₦63.30. ATH ₦136.9. +116%.
DANGSUGAR — Nigeria's largest sugar refinery. Called at ₦72.50. Already ₦95.30 in 9 days. Four targets. Final: ₦150.0.
One builds the continent. One finances it. One feeds it.
Three pillars of Nigeria's economic architecture. Three separate chart structures. Three separate publications. Three separate timestamps. One consistent price action methodology — trendline, demand zone, confluence, patience.
Not a prediction machine. A pattern recognition system. Trained over six to seven years. Applied to the right assets at the right moments. Documented publicly before the fact, not after it.
That is the work.
WHO IS MAKING THESE CALLS
I am Alexander Raphael.
I bring a unique dual lens to the financial world. As a Prosthetics and Orthotics Technologist, I understand that optimal performance depends on structural health—a principle that applies equally to the markets. I leverage my clinical background in biomechanics to analyze Equity Markets, identifying the underlying 'structural' indicators that signal growth or strain before they become visible on the surface.
Markets work exactly the same way. Six to seven years of studying that structure — combined with direct NGX-listed company exposure, investor and regulatory communication, and a documented financial communication portfolio — is what produced three public calls on three different assets that all delivered.
CEO of Forex Cruisers. Founder of Xela University. Teaching others to read the same structures. Documenting the process in public, in real time.
This is not for show. This is what accountability looks like.
WHERE DANGSUGAR GOES FROM HERE
Current price: ₦95.30.
TP2: ₦105.4 (~10.6% away).
TP3: ₦130.3 (~36.8% away).
Final TP: ₦150.0 (+57.4% from current, +106.9% from entry).
The monthly candle structure is bullish. The demand zone is confirmed. The trendline is intact. The fundamentals are improving. The momentum is real.
This thesis has legs.
And the receipts are already on TradingView — timestamped April 28, 2026, under alexraphael00.
ACCOUNTABILITY NOTE
Original chart: TradingView | @ alexraphael00 | Apr 28, 2026
Live update: May 8–12, 2026
Ticker: DANGSUGAR · Exchange: NSENG (NGX) · Timeframe: Monthly
Published. Timestamped. Publicly verifiable. Not a backtest.
⚠️ Disclaimer: This is not financial advice. All analysis reflects personal technical views. This is an active, live call — market conditions can change. Past performance does not guarantee future results. Do your own research always.
Alex Raphael
CEO — Forex Cruisers | Xela University
Chart: TradingView | NSENG:DANGSUGAR Ticker: DANGSUGAR | NGX  Long
Long
 Long
Long
DANGCEM — Almost at my ₦1,100 target. Here's the Full Story.DANGOTE CEMENT
This is a documentation of a call I published on this exact
chart on December 21, 2025. At that time, NSENG:DANGCEM was trading at ₦610.
Today — May 9, 2026 — it is at ₦1,088.
The final target was ₦1,100. We are twelve naira from it.
This update is not a "I told you so." It is accountability.
A documented technical analysis, revisited in real time, for
anyone who wants to study how this kind of setup reads and
why it played out the way it did.
──────────────────────────────
THE ORIGINAL THESIS (December 21, 2025)
Structure observed on the Monthly chart:
1. Long-term ascending trendline (2016 — present)
Price had pulled back into this trendline for the fourth
time in nine years. Each prior touch produced a bullish
reversal. The structure had earned its credibility.
2. Horizontal demand zone (~₦300)
A multi-year horizontal floor that had been defended
consistently. Not broken. Not even tested convincingly.
A level the market had repeatedly treated as sacred.
3. Confluence
Both the trendline and the horizontal demand zone
converged at the same area simultaneously. Price was
sitting in the middle of this compression.
That is where high-probability setups are born.
Published targets:
TP1: ₦763 — Previous structural high
TP2: ₦900 — Key resistance zone
TP3: ₦1,100 — Final take-profit
──────────────────────────────
WHAT THIS STOCK ACTUALLY IS
DANGCEM is Dangote Cement Plc — Africa's largest cement
producer, operating across Nigeria, Cameroon, Ethiopia,
Ghana, Senegal, South Africa, Tanzania, and Zambia.
Aliko Dangote holds ~86% of this company. His total net
worth has climbed to $34 billion in 2026, with DANGCEM's
rally contributing billions in stake value.
When you trade this chart, you are not just trading a ticker.
You are positioning against the most significant industrial
wealth creation story on the African continent right now.
That context matters. It informs why the structure holds.
Why demand is consistent. Why this stock does not behave
like a speculative small-cap. It has fundamental weight
behind every technical level.
──────────────────────────────
TRADE RECORD — TARGET BY TARGET
Entry Zone: ₦610 | Dec 21, 2025 | PUBLISHED
TP1: ₦763 | Q1 2026 | CLEARED ✅
TP2: ₦900 | Apr 27, 2026 — Actual: ₦907.5 | CLEARED ✅
TP3: ₦1,100 | PENDING — Current: ₦1,088 | 98.9% reached
ROI from entry zone: +78.4%
Timeframe: ~5 months
Structural invalidations: Zero
──────────────────────────────
CURRENT STRUCTURE (May 9, 2026)
Price: ₦1,088
High: ₦1,088
Distance to Final TP: ₦12
The monthly candle remains bullish. No signs of structural
reversal at this level. The momentum that carried this stock
through TP1 and TP2 without hesitation is still in place.
The final target is within reach.
──────────────────────────────
LOOKING AHEAD
Dangote's Vision 2030 targets $100 billion in group revenues
and $200 billion in total market capitalization. A Pan-African
Refinery IPO — valued at up to $50 billion — is in discussion.
The macro story behind this asset is not slowing down.
Watch the monthly structure. Watch the trendline.
The long view on DANGCEM is still firmly bullish.
──────────────────────────────
ACCOUNTABILITY
Both charts (Dec 21, 2025 / May 09, 2026)
are timestamped and published under: @alexraphael00 on TradingView.
This is a live, verifiable analysis track record — not a backtest.
⚠️ Disclaimer: Educational and informational only. Not financial
advice. All analysis reflects personal technical views. Past
performance is not indicative of future results. Conduct your
own due diligence before any investment decision.
──────────────────────────────
Published by: alexraphael00
Forex Cruisers | CEO & Founder
Xela University | Lead Instructor
Exchange: NSENG | Ticker: NSENG:DANGCEM | Timeframe: 1M (Monthly) Long 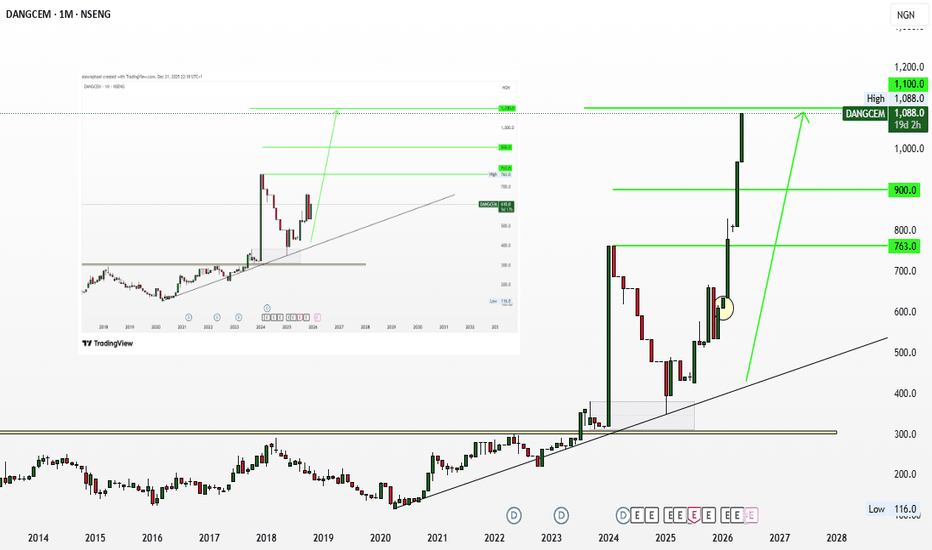
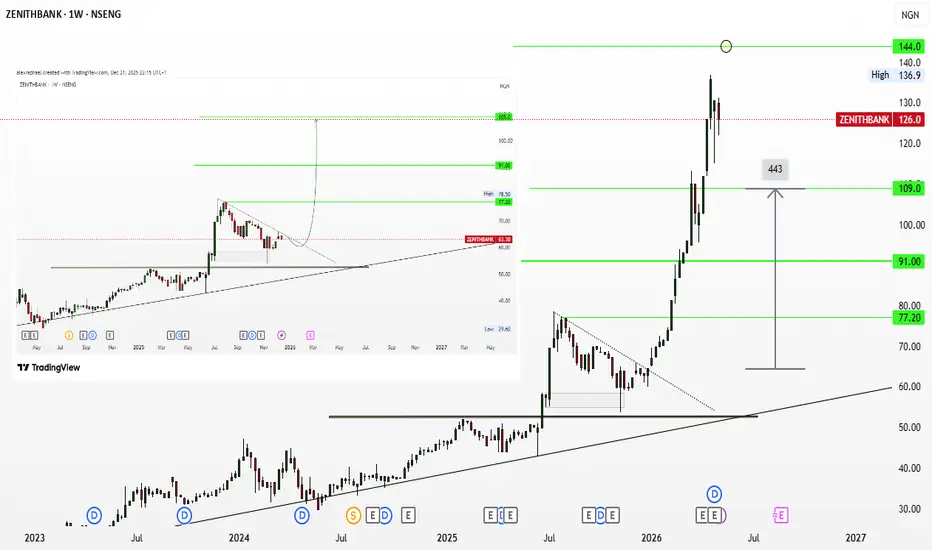
I SET 3 TARGETS ON ZENITHBANK. THE STOCK HIT ALL AND KEPT GOINGNSENG:ZENITHBANK
—How a weekly chart posted at 10pm on a December Tuesday
predicted one of Nigeria's most historic financial moments —
and what ₦63.30 looked like through the right pair of eyes.
Here is something they don't teach you in finance school:
Sometimes the market doesn't just prove you right.
Sometimes it proves you right, overshoots your final target,
breaks an all-time high, makes banking history, and then
looks back at you like it's asking for new targets.
That is exactly what ZENITHBANK did between December 2025
and April 2026.
And I have the timestamps to prove it.
───────────────────────────────────────────────────────────────
SAME TUESDAY NIGHT. SAME CHART SESSION.
───────────────────────────────────────────────────────────────
On December 21, 2025, at approximately 22:15 UTC+1, I was on
TradingView. I had already published a monthly analysis on
Dangote Cement. Then I pulled up the ZENITHBANK weekly chart.
The stock was at ₦63.30.
To most eyes, it looked fragile. It had spiked earlier in
the year, then pulled back hard, forming a descending wedge —
lower highs, lower lows, narrowing structure. The kind of
chart that makes people nervous.
To a trained price action eye, a descending wedge on a weekly
chart, sitting above a long-term ascending trendline and a
thick horizontal demand zone, is not weakness.
It is a spring being loaded.
I drew three horizontal levels — ₦77.20, ₦91.00, ₦109.00.
Published the chart. Went to sleep.
Three months later, the stock had cleared all three targets,
broken its all-time high twice, crossed ₦100 per share for
only the second time in Nigerian banking history, and helped
Zenith Bank become the first bank in Nigeria to ever hit a
₦5 trillion market capitalization.
But let's start from the beginning.
───────────────────────────────────────────────────────────────────
FIRST, YOU NEED TO UNDERSTAND WHAT ZENITH BANK ACTUALLY IS.
───────────────────────────────────────────────────────────────────
Jim Ovia founded Zenith Bank on May 30, 1990 with a
shareholders' fund of just ₦20 million.
Read that again. Twenty million naira.
Today, Zenith Bank reports over ₦1 trillion in annual profit.
Its revenue is ₦2.32 trillion. It has over 400 branches across
Nigeria. Offices in the United Kingdom, UAE, Ghana, Sierra Leone,
The Gambia, and Côte d'Ivoire. More than 10,000 employees.
Nigeria's number one bank by Tier-1 capital — for the
16th consecutive year.
And in 2026, under CEO Adaora Umeoji, OON, it became the first
Nigerian bank in history to cross a ₦5 trillion market cap.
The woman didn't just inherit an institution.
She accelerated it.
So when I say I was looking at ZENITHBANK at ₦63.30 in
December 2025 and seeing a loaded spring — understand that
I wasn't just seeing a trading opportunity. I was seeing
one of Africa's most disciplined financial institutions
sitting at a technically compelling entry, with the full
weight of its fundamentals about to push through every
resistance level on the chart.
That's not a hunch. That's confluence.
─────────────────────────────────────────────────────────────
THE TECHNICAL CASE — WHAT THE WEEKLY CHART SHOWED
─────────────────────────────────────────────────────────────
Three things were happening simultaneously on the ZENITHBANK
weekly chart in December 2025:
1. A Descending Wedge
The stock had been printing lower highs and lower lows
within a narrowing range. The wedge was tightening.
In price action, this pattern — when formed after a
bullish impulse and sitting above strong support — is a
high-probability continuation setup, not a reversal.
It is the market pausing before it runs.
2. A Long-Term Ascending Trendline
A rising trendline from the broader bull structure had
been intact for months. Despite the wedge-down correction,
the trendline had not broken. Price was respecting it.
That matters enormously. A trendline that survives a
pullback is not weak — it is confirmed.
3. A Thick Horizontal Demand Zone
Beneath the wedge sat a strong horizontal support level
that had acted as a floor multiple times. The market
kept returning here and finding buyers. That is what
demand looks like — consistent defense.
When a descending wedge, an ascending trendline, and a
horizontal demand zone all converge in the same area at
the same time, the structural message is clear:
The path of least resistance is upward.
My three targets were not guesses. They were the next
logical supply zones where I expected resistance — the
levels where previous sellers had shown up before, and
where price would need to absorb selling before continuing.
₦77.20. ₦91.00. ₦109.00.
Published. Timestamped. Posted to TradingView at 22:15 on
December 21, 2025, under the handle alexraphael00.
─────────────────────────────────────────────────────────────
WHAT HAPPENED NEXT — FASTER THAN ANYONE EXPECTED
─────────────────────────────────────────────────────────────
The breakout came in Q1 2026. And when it came, it did not
arrive politely.
₦77.20 — barely a pause. Cleared.
₦91.00 — cleared before most people had time to adjust.
These are two of the three levels I had mapped in December.
Both gone before the first quarter of the year was out.
Then March 17, 2026 happened.
ZENITHBANK printed a new all-time high of ₦113.30.
163 million shares traded in a single session — a volume
record that reflected the force of institutional demand
meeting retail FOMO meeting momentum.
Let me put that in context:
The ₦109 final target I had mapped in December was not
reached. It was obliterated. The stock went straight through
it and kept going.
On that same day, Zenith Bank briefly overtook GTCO to
become Nigeria's most capitalised bank, with a valuation
of ₦4.58 trillion versus GTCO's ₦4.32 trillion.
And it became only the second Nigerian bank in history
to trade above ₦100 per share.
At that point, I had to draw new targets.
Because the chart had outrun the original thesis —
in the best possible way.
─────────────────────────────────────────────────────────────
THE SECOND ACT — AND A DATE WITH BANKING HISTORY
─────────────────────────────────────────────────────────────
After consolidation, ZENITHBANK moved again.
On April 24, 2026, it printed a new all-time high of ₦136.9.
By April 27 — the date of my second chart update — it was
trading at ₦125.6, with the weekly candle still showing
bullish intent and a new extended target of ₦144.00 in place.
The market capitalisation by this point had crossed
₦5 trillion — a milestone no Nigerian bank had ever
reached before.
The first. In history.
From ₦2.54 trillion at the end of December 2025 to
₦5.15 trillion and climbing. Market cap essentially
doubled while the original call was still live.
And from the ₦63.30 entry published on December 21?
+116.3% return. In under four months.
─────────────────────────────────────────────────────────────
THE PART THAT HITS DIFFERENT
─────────────────────────────────────────────────────────────
When Zenith Bank's market cap crosses ₦5 trillion, that is
not just a number on Bloomberg's screen.
It is 10,397 employees — real people — working at an
institution whose equity value just doubled. Their pension
plans, their stock options, their job security: all
underpinned by a company whose market has reaffirmed
its worth at the highest level in its 35-year history.
It is the 400+ branches across Nigeria where Nigerians
access credit, save, transact, build businesses, pay school
fees, receive remittances from the diaspora.
It is the London branch serving African businesses navigating
the UK-Africa corridor. The upcoming Manchester office.
The planned Ivory Coast expansion. A Nigerian bank going
global — and the weekly chart in December was already
sketching the trajectory.
When the share price of ZENITHBANK rises, it is not
detached from the lives of Nigerians. It is a reflection
of one of Africa's most important financial institutions
expanding its reach, strengthening its balance sheet,
and continuing the 35-year compounding story Jim Ovia
started with ₦20 million in 1990.
The stock going up IS the story.
The people are the story.
The chart just tells you when to pay attention.
─────────────────────────────────────────────────────────────
WHAT THIS PROVES — AND WHO MADE THE CALL
─────────────────────────────────────────────────────────────
On the same Tuesday night in December 2025, I published
two calls:
DANGCEM at ₦610 → now ₦1,088. +78.4%.
ZENITHBANK at ₦63.30 → all-time high of ₦136.9. +116%.
Both timestamped. Both public. Both verified.
Two blue-chip Nigerian equities. Two price action setups.
One Tuesday night. One analyst.
I am Alex Raphael. A Prosthetics and Orthotics
Technologist. CEO of Forex Cruisers. Founder of Xela
University. Six to seven years studying financial markets,
with direct NGX-listed company exposure, investor and
regulatory communication, and a documented track record
in financial reporting.
I did not pick these stocks randomly. I read their structure.
I identified the confluence. I published the call before
it happened, not after.
That is what this is:
Not hindsight. Not luck. Not noise.
Craft. Documented. In public. For anyone to verify.
─────────────────────────────────────────────────────────────
WHERE ZENITHBANK GOES FROM HERE
─────────────────────────────────────────────────────────────
The extended target of ₦144.00 is next.
Beyond that, Zenith Bank's trajectory is underpinned by:
→ Planned full listing on the London Stock Exchange by 2027
(already present via GDRs since 2013)
→ New Manchester branch — UK-Africa corridor expansion
→ Ivory Coast branch in progress — deepening pan-African reach
→ 16th consecutive year as Nigeria's #1 bank by Tier-1 capital
→ ₦1 trillion annual profit base compounding forward
→ CEO Adaora Umeoji's strategic clarity driving investor confidence
The structure, the fundamentals, and the vision all point
in the same direction.
The chart agrees.
─────────────────────────────────────────────────────────────
ACCOUNTABILITY NOTE
─────────────────────────────────────────────────────────────
This entire analysis — from the original December 2025 call
to this documentation — is publicly verifiable:
→ Original chart: TradingView & YouTube | Dec 21, 2025
Ticker: ZENITHBANK · Exchange: NSENG (NGX) · Timeframe: 1W (Weekly)
Not a backtest. Not a reconstruction.
Timestamped. Published. Confirmed by the market.
⚠️ Disclaimer: This is not financial advice. All analysis
reflects personal technical views. Past performance does
not guarantee future results. Do your own research.
─────
Alex Raphael | @alexraphael00
CEO — Forex Cruisers | Xela University
Chart: TradingView | Ticker: ZENITHBANK | NGX Long 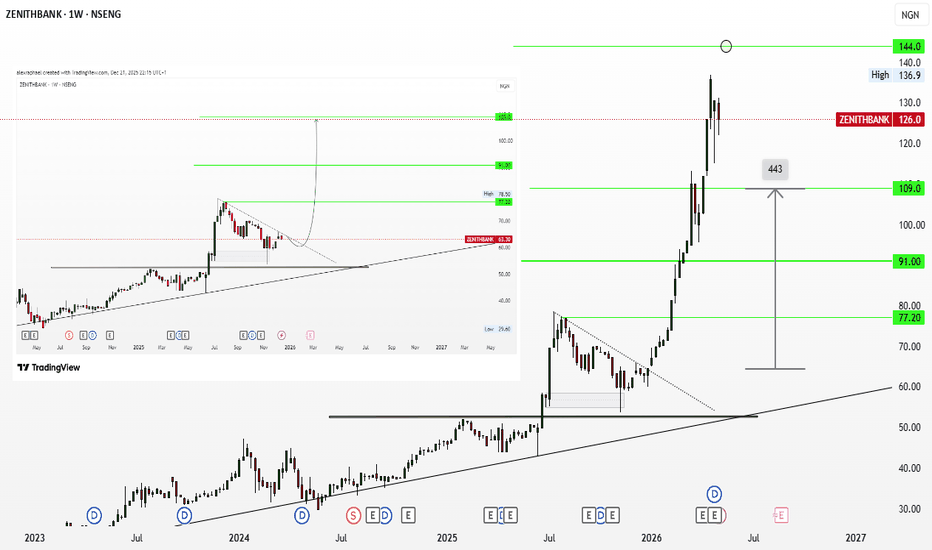
 Long
Long