• Products
  • Community
  • Markets
  • Brokers
  • More
Get started
  • Markets
  • /Nigeria
  • /Stocks
  • /Ideas
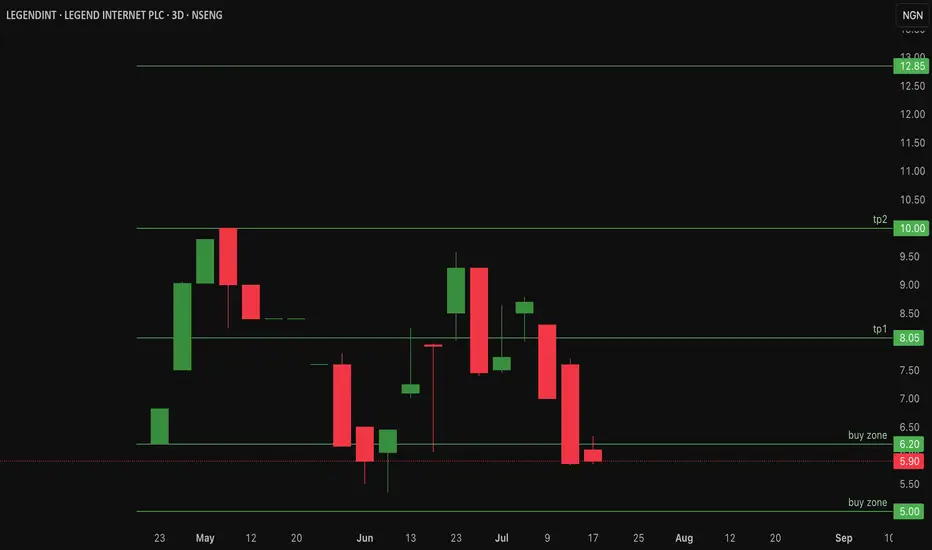
$legendint Could LegendInt be undervalued? - 40% RetracementLegend Internet Plc on the Nigerian Stock Exchange (NGX) was listed on April 24, 2025, under ticker LEGENDINT. The company offers fiber-to-the-home (FTTH) services in Abuja and digital products like LegendMail and MailPay. IPO price: ₦5.64 per share, closed first trading day at ₦6.20. Previously NSENG:LEGENDINT has reached an all time high of 10naira/share and has currently retraced over 40% Current price: 5.90 As a newly listed small-cap, it faces low visibility and high volatility, contributing to weak investor demand and price devaluation. It would be interesting to see what the future holds for #legendint. Upside resistance at 8naira and 10naira per share Buy zone range is between 5 -6.2naira/share Price action looks like an inverse cup and handle pattern - Not a bullish pattern! Invalidation for this Legend Idea is under 5naira per share!
NSENG:LEGENDINTLong
by Ifiok-Trades
Updated
22
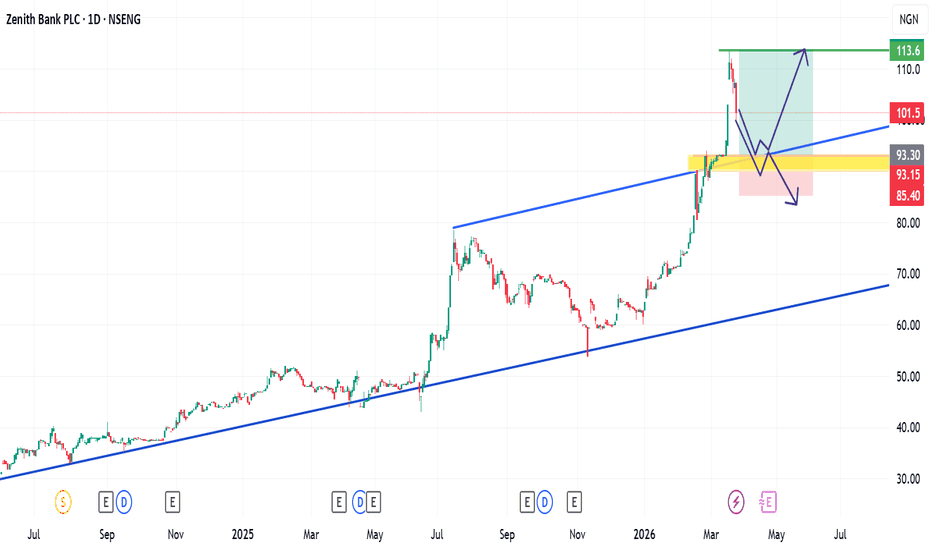
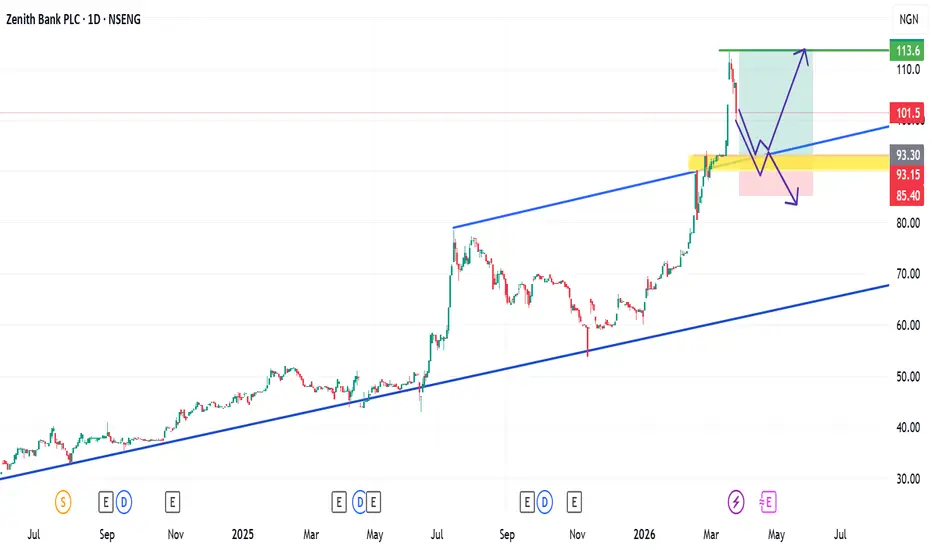
ZENITHBANK: Approaching An Ascending Channel.ZENITHBANK: Approaching An Ascending Channel. Zenith Bank PLC has recently exhibited significant bullish momentum on the Nigerian Stock Exchange (NGX). Following a substantial rally that peaked on March 17, 2026, the price reached a new all-time high of approximately 113.30 Naira per share. Since reaching this milestone, the asset has entered a corrective phase, characterized by a technical pullback. Technical Outlook and Key Levels Current chart patterns suggest the stock is trading within a well-defined ascending channel. We are monitoring the following scenarios: Primary Support Zone: There is a strong possibility of the price retracing toward the 90.00 – 93.00 Naira range. This area is critical as it aligns with the lower boundary (support line) of the ascending channel. A successful bounce from this zone would confirm the continuation of the long-term uptrend. Bearish Alternative: Should the 90.00 Naira support level fail to hold, it may signal a deeper correction. In such a case, the price could break below the channel structure, necessitating a reassessment of the current bullish bias. Traders should keep a close eye on volume and price action near these key support levels to determine the next major move for ZENITHBANK. Disclaimer: The information provided in this analysis is for educational and informational purposes only and does not constitute financial or investment advice. Trading in the stock market involves risk, and past performance is not indicative of future results. Always conduct your own research or consult with a qualified financial advisor before making investment decisions.
NSENG:ZENITHBANKLong
by ForexClinik
GTCO Analysis: Key Support Levels and Long-Term OutlookGuaranty Trust Holding Company (GTCO) recently experienced a significant technical correction. After reaching a 52-week peak near the 127.50 Naira mark earlier this month, the stock faced a sharp "flash" pullback. On March 24, the price tested the 100 Naira psychological zone, a move that has captured the attention of many technical and value-oriented investors. Technical View. From a technical perspective, the 100 Naira level serves as a critical area of interest. This zone represents not only a psychological round number but also a historical support level where buying pressure has previously emerged. As a mid-to-long-term investor, my outlook remains optimistic regarding the asset's underlying performance. However, patience is key. The current strategy revolves around price action at the 100 Naira level: Entry Strategy: If the price stabilizes or returns to the 100 Naira zone, I plan to initiate positions using a dollar-cost averaging (DCA) approach to mitigate short-term volatility. Price Target: My primary objective for this setup is a return to the 130 Naira range, aligning with the previous peak and projected long-term growth. Summary. The recent pullback offers a potential opportunity for those looking to build a position in a leading financial institution at a more favourable valuation. Monitoring the 100 Naira support will be essential in confirming the strength of the next bullish leg.
NSENG:GTCOLong
by ForexClinik
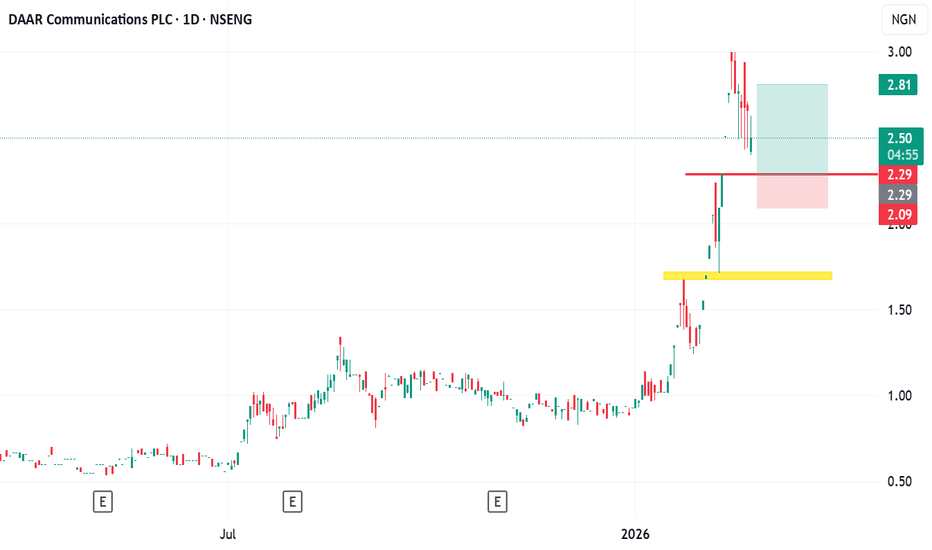
My View for DAAR Communication StockDAARCOMM has experienced a notable correction, declining approximately 11.3% to 16.5% from its recent 52-week peak of 3.00 NGN. After a period of aggressive bullish momentum, the price action is currently showing signs of a healthy retracement. Technical Reasoning The primary thesis for this outlook is based on a price gap created during the recent impulsive move upward. In technical analysis, these gaps often act as magnets for price; the "gap fill" serves as a retest of previous liquidity before the primary trend can potentially resume. Currently, the stock is searching for a stable support floor. A pull-back toward the 2.30 NGN level aligns with historical structure and psychological support, offering a more favorable entry for those observing the long-term trend. Trade Setup (Hypothetical) Entry Zone: 2.30 NGN (Waiting for price stability at this level) Take Profit (TP): 2.80 NGN – 3.00 NGN Stop Loss (SL): 2.00 NGN Risk-to-Reward Ratio (RR): 1:1.67 (Adjusted based on standard market structure) Compliance & Disclaimer. This post is for educational and informational purposes only and does not constitute investment advice. Trading stocks involves significant risk. This analysis is not intended for any specific investment objectives or financial situations and is not limited to qualified investors. Always conduct your own due diligence before entering any market position.
NSENG:DAARCOMMLong
by ForexClinik
Updated
$Conoil Conoil price currently devalued - Over 45% Retracement!NSENG:CONOIL Conoil PLC is a leading downstream energy company in Nigeria, active in marketing refined petroleum products, lubricants and LPG. Latest data shows: Revenue (TTM) of ~ ₦286.2 billion, net income ~ ₦1.65 billion, P/E approximately 88.7×. The main risk: margins are under pressure, cost of sales rising, and recent performance has disappointed in short-term horizon. Conoil main strength: strong brand, wide distribution network, and established business in Nigeria’s energy sector. After a strong parabolic rally, CONOIL is now in a corrective phase of about 45%. I’m preparing to accumulate gradually—not all at once—as price approaches long-term value areas. The Plan: Dollar-cost averaging (DCA) slowly into weakness, targeting the 200 EMA as my final support zone. This approach reduces risk and smooths my entry cost over time. Buy Zones: ₦230–₦200: Light entries (early DCA) ₦180–₦160: Moderate accumulation ₦160–₦145: Heavy accumulation (near 200 EMA) Each tranche increases exposure as price nears fair value. Why the 200 EMA? The 200 EMA often acts as the “fair value” line—after strong trends, price tends to return here before establishing a new base. It’s where patient money usually steps back in. Planned Targets After Reversal: TP1 → ₦314: Retest of structural resistance TP2/TP3 → ₦403 / ₦501: Full cycle recovery / momentum expansion. Once the trend turns, these are the resistance zones I’ll be watching. Risk Management: Idea invalidation if weekly candle closes below ₦145, that’s a break of structure. I’ll pause or sell off accumulation until price stabilises or forms a clear base. Not Financial Advice!!
NSENG:CONOILLong
by Ifiok-Trades
Updated
55
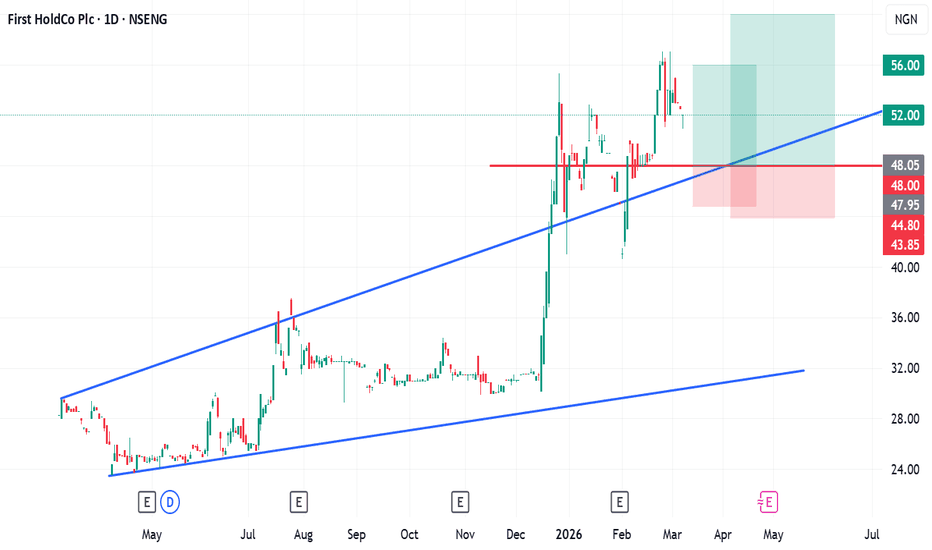
First Bank Holdings: Trade Setup and Market OutlookNSENG:FIRSTHOLDCO has recently experienced notable price volatility on the Nigerian Exchange. Earlier in February, the stock pulled back significantly to around ₦40.50 after the company announced measures to clean up parts of its balance sheet by addressing legacy bad debts. Following this development, positive market sentiment supported by strong public communication from the company’s chairman, Femi Otedola, helped drive a recovery in the share price. From a conservative, mid- to long-term trading perspective, I am currently monitoring the stock for a potential pullback to establish positions at more favorable levels. Planned Trade Setup Entry Strategy I am considering two separate entries, both around ₦48, if the price retraces to that level. Trade 1 Entry: ₦48 Stop Loss: ₦44.80 Take Profit: ₦56 Trade 2 Entry: ₦48 Stop Loss: ₦44 Take Profit: ₦60 This approach allows for risk management through staggered targets, while still maintaining exposure to a potential upward move. Market Considerations There is always the possibility that the stock may not retrace to the ₦48 level. If the current momentum continues, the price could move higher without offering this pullback opportunity. However, if the retracement occurs, it could present an opportunity to accumulate shares at a discount to recent highs. Key Factors to Watch Market sentiment toward Nigerian banking stocks Future earnings reports from FBN Holdings Balance sheet improvements following the debt clean-up Broader macroeconomic conditions affecting the Nigerian financial sector Overall, this setup reflects a risk-managed strategy aimed at capturing potential upside while limiting downside exposure. What are your thoughts on NSENG:FIRSTHOLDCO Holdings at current levels? Do you expect further upside, or a deeper pullback before the next move higher?
NSENG:FIRSTHOLDCOLong
by ForexClinik
Nigerian Breweries on the Weekly ChartAnalyzing Nigerian Breweries (NB) on the weekly timeframe reveals a market structure currently in a bullish recovery phase. A key feature of this chart is the long-term horizontal level (indicated in yellow on the chart), which has historically functioned as a significant support zone. After a period where price action dipped below this level, the stock has recently reclaimed it. From a technical perspective, transforming a previous breakdown back into a support base is often interpreted as a constructive signal for long-term price stability. Potential Entry Scenarios. Based on the current chart structure and long-term technical outlook, there are three primary approaches to consider: 1. Aggressive Accumulation: An entry near the ₦80 level. This targets a recovery to ₦100, assuming the immediate support holds. 2. Current Momentum Play: An entry at the current market price (approximately ₦82). This scenario looks for a continuation of the recent trend toward a secondary target of ₦120. 3. Conservative Wait: A patient approach involves waiting for a deeper retracement toward the ₦70 zone. This provides a higher potential margin if the price eventually rallies back to the ₦120 mark. Strategic Outlook. These scenarios suggest potential margins ranging between 25% and 65%, depending on the execution point. However, it is important to note that this setup is consistent with a long-term holding strategy rather than a short-term trade. Technical recoveries of this scale typically require significant time to materialize as the market adjusts to the company's broader recovery.
NSENG:NBLong
by ForexClinik
ETERNA: Breaking All-Time Highs Amid Global Energy ShiftsETERNA has exhibited significant bullish momentum recently on the Nigerian Exchange (NGX), recently clearing its previous all-time high of ₦41.90. This price action is occurring alongside heightened geopolitical activity in the Middle East, specifically regarding the Strait of Hormuz. Given that approximately 20% of the world’s oil supply moves through this corridor, any perceived risk of disruption typically drives volatility and speculative interest in energy-related equities globally. Technical Analysis and Market Structure. From a technical perspective, a clean break above a major psychological and historical level like ₦41.90 suggests strong buying conviction. However, as a mid- to long-term observer, I prefer looking for high-probability entry points during corrective phases rather than chasing vertical price movements. The stock is currently supported by a well-defined ascending trendline. As long as the price remains above this structure, the long-term bullish outlook is preserved. Key Execution Levels. Based on the current framework, I am monitoring the following areas for potential repositioning: Zone A (Retest Support): ₦35.50 — Aiming for a primary target near ₦50.00. Zone B (Trendline Confluence): ₦32.00 — Aiming for a target near ₦42.00. These levels represent areas where historical price action and trendline support converge, offering a more balanced risk-to-reward ratio compared to current market prices. Risk Factors to Monitor. Participants should keep a close eye on the following variables that could impact the trade thesis: 1. Global Energy News: Any de-escalation in the Strait of Hormuz could lead to a rapid cooling of the "geopolitical premium" currently baked into oil stocks. 2. Local Liquidity: Volume on the NGX remains a critical factor for ensuring smooth entries and exits. What is your outlook on the energy sector? If you are tracking ETERNA or similar energy stocks, I would be interested to see your charts or thoughts in the comments below.
NSENG:ETERNALong
by ForexClinik
#Sunuassur Sunu Assurance Nigeria Plc at over -60% Discount #SUNUASSUR **Sunu Assurances Nigeria Plc (Weekly W1) — Sunu Assurance Nigeria Plc at over 60% Discount. Sunu Assurances reached an all time high ATH at about 11.65 naira per share and has currently retraced. It has spent several months in post-rally consolidation after its explosive markup phase that pushed price toward 11.65. Price is now trading deep within a defined accumulation range, making this a structure-driven swing opportunity if demand continues to hold. Current price: ₦4.58 / share Technical Outlook Instead of collapsing, price has spent months compressing inside a horizontal range, suggesting large players may be quietly absorbing supply. The weekly structure now shows: Range-bound consolidation between ₦3.9 and ₦6.50 — typically a precursor to expansion. This type of structure often resolves with impulsive moves up once liquidity builds sufficiently. Key Technical Levels My Preferred Buy Zones** ₦3.12 – ₦4.60 → Primary accumulation zone ₦4.60 – ₦6.50 → Secondary accumulation zone Resistances / Targets ₦10.35 → TP1 (Previous distribution high) ₦15.05 → TP2 (Assuming Full range expansion continues) A clean breakout above ₦6.50 would signal the start of a new breakout phase. Market Structure Logic The current structure resembles a classic accumulation box: 1. Strong markup phase 2. Sharp correction 3. Multi-month sideways consolidation 4. Liquidity building before next trend This compression phase typically **precedes trend continuation if support holds**. Invalidation: Weekly close below ₦3.12 would break the accumulation structure and invalidate the bullish thesis. Summary SUNUASSUR is currently building a base after its previous rally. Holding the ₦3.12-6.50 support zone keeps the bullish structure intact and opens the path toward ₦10+ and potentially ₦15 on expansion. ***This is not financial advice. Always manage your risk. This is a level-based setup, not a blind buy.***
NSENG:SUNUASSURLong
by Ifiok-Trades
22
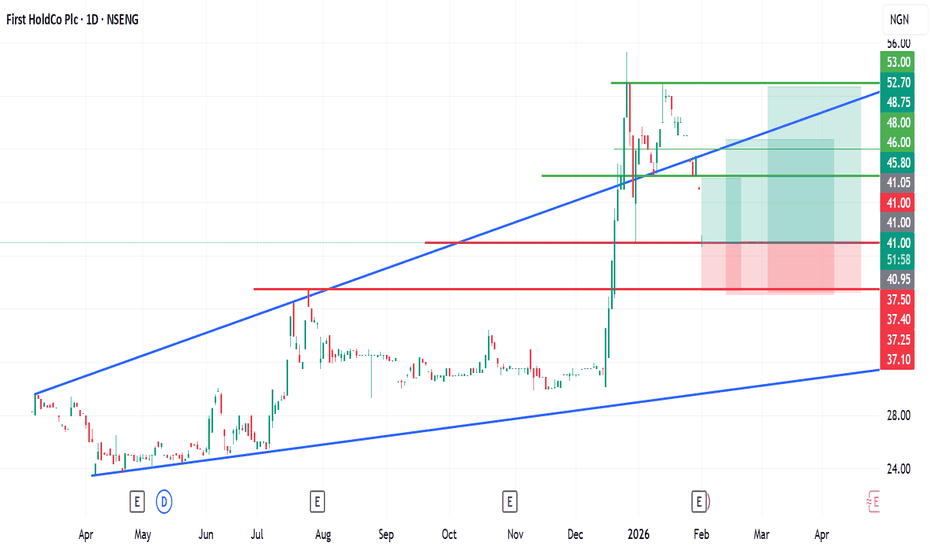
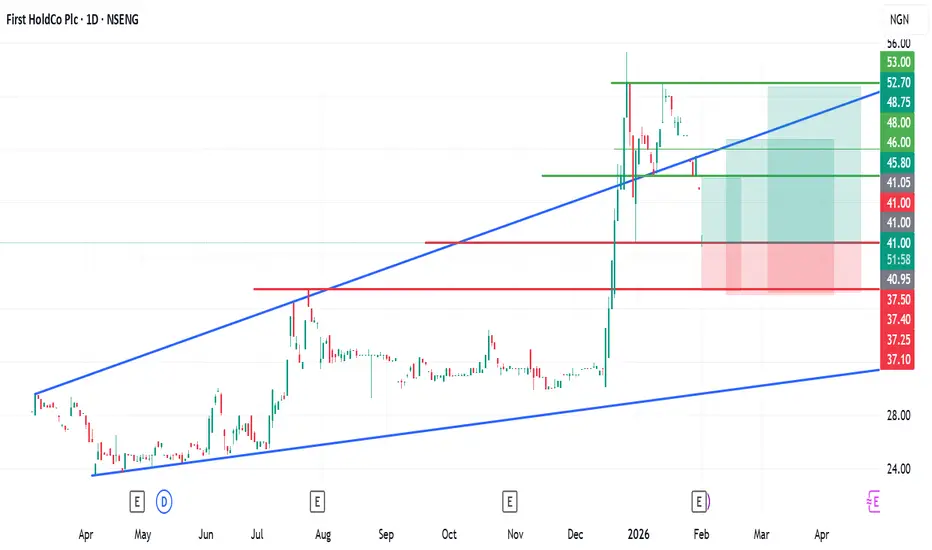
FBNH Outlook: Post-Selloff Recovery OpportunityFollowing a robust performance in 2025 where FBN Holdings ( NSENG:FIRSTHOLDCO ) reached a peak of approximately 55 Naira, the stock has recently undergone a significant price correction. This move was accelerated by a massive sell-off following the bank’s decision to write off approximately 748 billion Naira in legacy non-performing loans, a strategic "house-cleaning" aimed at long-term stability. Technical Analysis and Chart Patterns The current chart setup shows the stock trading within a widening wedge formed by two ascending trend lines. While the price recently broke below the upper boundary, it is now approaching a critical psychological and technical support level near the 41 Naira mark. This area aligns with the support zone for the 31st December 2025 sell-off. Fundamental Drivers. The recent profit dip, attributed to the one-time hit from debt provisioning, appears to be a "short-term pain for long-term gain" scenario. Investor confidence remains anchored by strong board-level leadership (which includes Femi Otedola) and the bank’s significant interest income, which is healthy enough to absorb these impairments. As the market prices in a "cleaner" balance sheet for 2026, a reversal from current lows becomes a high-probability technical setup. Proposed Trade Levels Entry Zone: 41.00 NGN Target 1: 46.00 NGN Target 2: 49.00 NGN Target 3: 53.00 NGN This setup is best suited for a medium-to-long-term holding period. Disclaimer: This analysis is for educational purposes only and does not constitute investment advice. Trading involves significant risk. Always conduct your own due diligence before entering any position.
NSENG:FIRSTHOLDCOLong
by ForexClinik
Updated
ELLAHLAKES: What Next After Capital Raise SetbackELLAHLAKES: Analyzing the Retest After Capital Raise Setback. The recent price action for ELLAHLAKES has encountered significant resistance following the rally that began in November 2025. During that bullish phase, the asset reached a peak near N18.5, coming close to its all-time high of N19.5. However, recent fundamental developments suggest a shift in momentum that traders should monitor closely. Fundamental Context: The Failed Public Offering The company’s outlook has faced a notable setback following the news that its attempt to raise N235 billion via a public offering was unsuccessful. The offer, which was priced at N12.50 per share, failed to meet the minimum subscription threshold required by the SEC. This capital setback is a critical fundamental factor. It suggests a "valuation friction" between the company's expectations and current investor appetite, likely leading to a period of reduced liquidity and cautious sentiment. Technical Outlook and Key Zones. From a technical perspective, the inability to break the all-time high, combined with this fundamental "bad news," increases the probability of a deeper retracement. Primary Targets: We are looking for a potential retest of the N10 and N8 support zones. Momentum: These levels represent historical areas of interest where the stock may need to consolidate and find new buying pressure before attempting another move higher. The highlighted entries on the chart remain the primary areas where support is expected to hold. Traders should watch for stabilising price action at these lower levels rather than chasing the previous rally. Disclaimer: This analysis is for educational and informational purposes only. It does not constitute an investment.
NSENG:ELLAHLAKESLong
by ForexClinik
TRANSCORP TRADE PLAN TO 80Find attached the analysis for TRANSCORP , a breakout . expected target 80 Tradehubng
NSENG:TRANSCORP
by Tradehubng
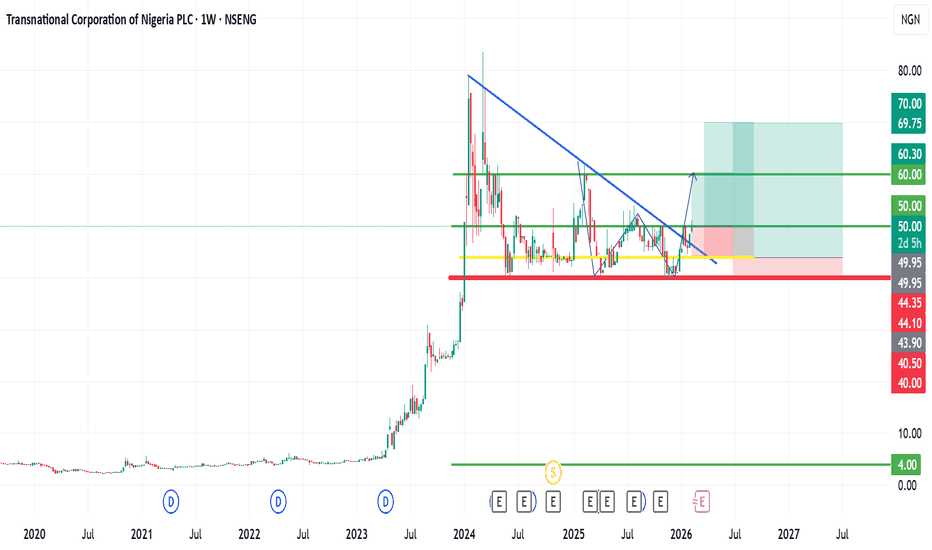
TRANSCORP; Technical Analysis and Market Structure ReviewMarket Overview and Structural Shift Transnational Corporation PLC. NSENG:TRANSCORP recently exited a prolonged consolidation phase. Between November and December 2025, price action remained stable within the ₦40 horizontal range. This period of accumulation has now transitioned into a momentum-driven phase. From a technical perspective, the price has successfully breached a descending trendline that originated from its previous all-time high. This breakout is significant because it suggests a shift in market structure from a bearish/corrective bias to a potential bullish continuation. Key Chart Patterns: The W-Formation A prominent W-pattern (Double Bottom) is currently visible on the weekly timeframe. This classic reversal structure indicates that the ₦40 level has been firmly established as a "floor" where demand consistently absorbs supply. Breakout Confirmation: The recent move above the trendline serves as the first confirmation. Current Sentiment: Price action is currently consolidating near the ₦50 psychological level, which now acts as a short-term pivot point. Potential Scenarios and Key Levels: Technical indicators suggest that if current momentum persists, the following price zones may be relevant for market participants: 1. Immediate Resistance: A sustained close above ₦50 could validate the next leg of the trend, with a technical projection toward the ₦60 and ₦70 supply zones. 2. Support/Retest Zone: In the event of a market-wide correction, the ₦43–₦45 region remains a high-interest area. This zone represents previous resistance that may now act as support (Role Reversal). Analysis Summary; The short- to medium-term outlook for TRANSCORP appears technically constructive following the trendline breakout. However, the sustainability of this move will likely depend on volume confirmation and broader market catalysts over the coming quarter. Disclaimer: This analysis is for educational and informational purposes only. It does not constitute financial advice or investment recommendations. Trading involves significant risk, and individuals should conduct their own research or consult with a qualified professional before making any financial decisions. This content is not intended for any specific class of investor.
NSENG:TRANSCORPLong
by ForexClinik
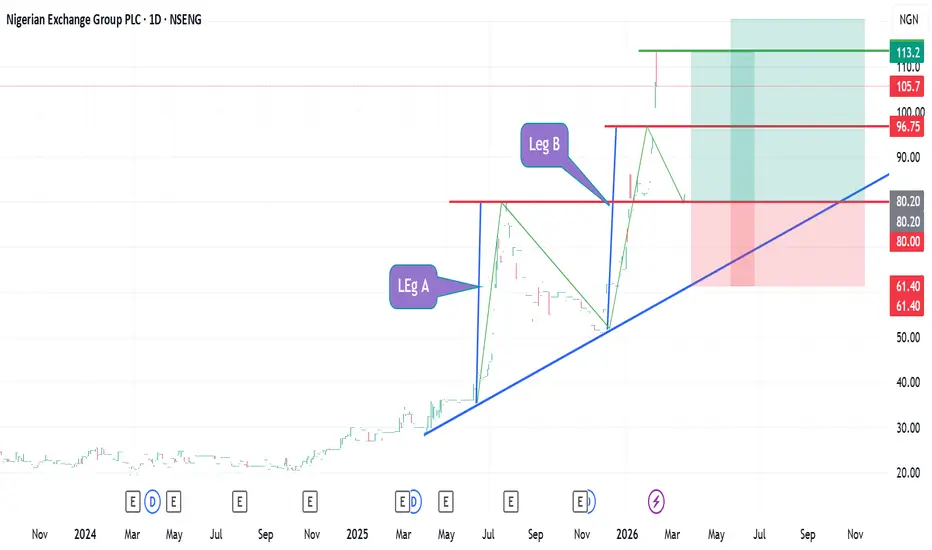
Market Analysis and Forecast: NGXGROUPNGXGROUP has recorded significant upward momentum in recent months, reflecting the broader positive sentiment and performance across the Nigerian Exchange. This growth highlights improving investor participation and confidence within the market. From a technical perspective, the current chart structure suggests that the upward legs, commonly referenced as leg A and leg B, have shown comparable length and strength. This symmetry often signals a maturing bullish cycle. At this stage, NGXGROUP appears to be entering overbought territory, and the price action indicates that a corrective move is increasingly possible. A retracement toward the ₦100 zone remains a probable scenario. This level may provide a more balanced entry point, allowing investors to begin accumulating gradually through a dollar-cost averaging approach. Should the market experience a deeper correction, the ₦80 region represents a strong demand zone where long-term buyers may find renewed value. Market conditions continue to reward disciplined and patient investors, and waiting for price action to align with key support levels may offer a more strategic opportunity to accumulate. This was previous publication
NSENG:NGXGROUPLong
by ForexClinik
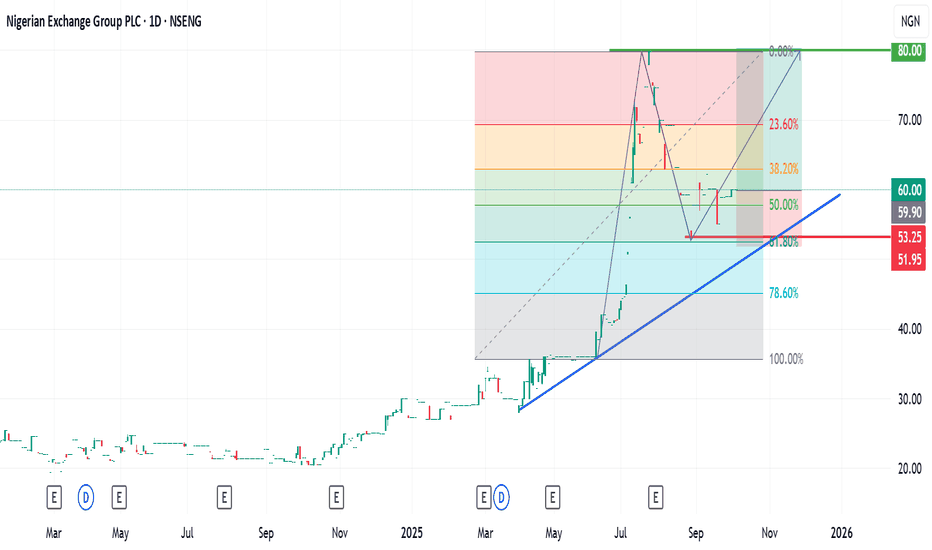
The Nigerian Exchange Group (NGXGROUPThe Nigerian Exchange Group (NGXGROUP) is the company that owns and operates the Nigerian Exchange (NGX), where other companies’ stocks are traded. Because of this role, NGXGROUP’s performance is partly linked to the overall health of the Nigerian stock market. When trading activity is high, more companies list their shares, and investor confidence is strong, NGXGROUP often benefits — so its stock price tends to rise when the broader market is doing well. However, NGXGROUP is not just another listed company; it operates as a business that earns revenue from transaction fees, data services, and market operations. This means its stock may not always move exactly in line with the general market. At times, internal company decisions, management performance, or regulatory issues can cause its price to move differently from other Nigerian stocks. Overall, NGXGROUP’s share price shows a positive but not perfect correlation with the rest of the market. It tends to move in the same direction as the Nigerian Exchange Index but with less intensity — meaning it rises and falls with the market but not as sharply. Historical data shows it has even outperformed the market in certain periods, suggesting both market-driven and company-specific factors influence its performance. TECHNICAL VIEW: This asset retraced to FIB 61.8%, which is a critical level. If all things are equal, the push-up that has started should continue from here. MY buy: N60 TP: N80 trade with care
NSENG:NGXGROUPLong
by ForexClinik
Updated
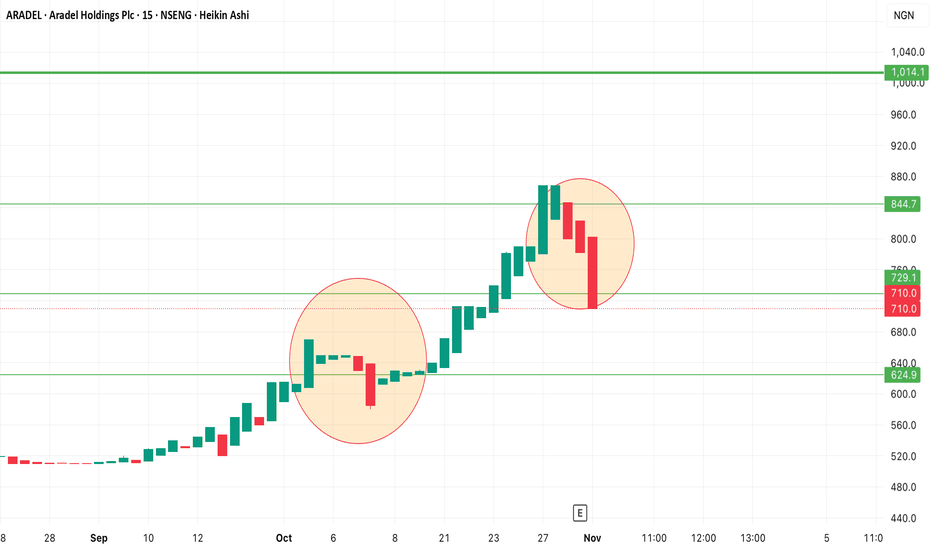
Will $Aradel Aradel Fractal Setup Repeat? Down -18% from ATHARADEL’s Fractal Setup — Will History Repeat? Is Aradel ( NSENG:ARADEL ) moving in repeating fractals? — a pattern of strong rallies, quick pauses, sharp pullbacks, and steep recoveries. Each dip in this sequence has so far created the foundation for the next rally leg, showing how market psychology often mirrors itself on the chart. Current price: 710naira/share --- The First Fractal The first major pattern appeared when price rallied from **₦520 → ₦689 (+29%)**, followed by a mild correction of about –13%. That retracement found support around the moving average zone, after which the stock continued its steady climb — confirming strong buyer re-entry at lower levels. --- The Current Setup This latest fractal looks even more aggressive. Price surged from ₦580 → ₦869 (+49%) before pulling back sharply — already down roughly –18%. Currently, the ₦710 zone is acting as a short-term support level. If this area holds, it could mark the end of the correction and the start of the next bullish swing. The Fractal Projection If history rhymes once more, the next upward leg could target the **₦950–₦1,000** resistance range — a natural extension zone aligning with prior swing highs. However, a decisive breakdown below **₦624** would invalidate the fractal and signal a deeper retracement phase, possibly toward the longer-term trend support. Summary * Current support: ₦710 (key pivot) * Fractal invalidation: ₦624 * Next potential target: ₦950–₦1,000 * Trend bias: Bullish if ₦710 holds; neutral-to-bearish if ₦624 breaks. Fractals don’t predict price — they simply hint where institutional interest and historical rhythm may align. #ARADEL #NGX #NigerianStocks #PriceAction #FractalPattern #TechnicalAnalysis #InvestingNigeria
NSENG:ARADELLong
by Ifiok-Trades
Updated
Trade Packet | TANTALIZER NIGERIA PLC ❖ ❖ ❖ DO YOUR DUE DILIGENCE 🟦 TRADE PACKET — Tantalizers Plc (2H Chart) Patterns: Ascending Triangle (Expanding) + Ascending Channel + Symmetrical Triangle Indicators: Ripster EMA Clouds (5–200) Price: ₦4.05 🟩 BUY Zone ₦3.78 – ₦4.03 Confluence of triangle support + lower channel boundary EMA(72/89) cluster sits just below price, offering dynamic support Best R:R entry sits around ₦3.90 – ₦4.00 if price retests the triangle base 🟥 Stop‑Loss Zone ₦3.61 Below the expanding‑triangle support and EMA(180/200) Protects against breakdown from the symmetrical triangle apex 🟦 Exit / Take‑Profit Zone ₦4.60 – ₦4.75 Upper boundary of the ascending channel + measured move from triangle Trail stop once price clears ₦4.30, which is the key breakout confirmation level. ❖ ❖ ❖ DO YOUR DUE DILIGENCE
NSENG:TANTALIZER
by swayflowz
CONOILCONOIL financial metrics are screaming buys although the red flag is the volume which is very low compare to the other industries in this sector but still a good buy(risky thou)
NSENG:CONOILLong
by Showboi-fx
$ellahlakes Ellahlakes over-39% Retracement from 19.4naira/shareELLAH LAKES – Weekly Technical Outlook NSENG:ELLAHLAKES Ellahlakes over-39% Retracement from 19.4naira/share All time High Current price: 11.75naira per share Ellah Lakes has retraced from its all-time high of ₦19.4 to a current low around ₦11.74 — a healthy 39% correction from the peak. This type of retracement is typical of a market cooling off after a strong impulsive move, not a structural breakdown. Price is now retesting previous supports and a possible accumulation zones where fresh demand could emerge. Rebuy Zone btw ₦10.95– ₦12.70: This zone sits near the last major breakout level — a classic area for price to retest and confirm as support. If bulls defend this area, it could trigger the next impulsive leg higher. Rebuy Zone btw ₦8.90 – ₦10.95: A deeper liquidity level and structural base. Only comes into play if the retracement extends further, but it offers an excellent accumulation opportunity in a longer-term bullish context. **Targets:** TP1 remains ₦17.50, which coincides with previous resistance just below the all-time high. TP2 sits at ₦23.05 — a Fibonacci extension move if momentum resumes and buyers reclaim control. As long as price holds above ₦8.90 on the weekly timeframe, the broader bullish structure remains valid. Invalidation of this idea is Under 8.90naira per share. This is not financial Advice!! **Summary:** Ellah Lakes is undergoing a standard 35–40% retracement within a larger uptrend. The defined rebuy zones (₦12.70, ₦10.95, ₦8.90) represent sound areas to monitor for signs of reversal and accumulation before the next rally leg develops. Else further decline! NFA
NSENG:ELLAHLAKES
by Ifiok-Trades
Updated
22
$MULTIVERSE Multiverse over 60% retracement from All time HighNSENG:MULTIVERSE Multiverse Mining & Exploration Plc focuses on quarrying solid minerals (granite, zinc, tin, tantalite, barite, columbite, gold, etc.) in Nigeria, with operations in Ogun and Nasarawa State. Currently NSENG:MULTIVERSE has lost over 60% of its value from an all time high of 24.50/share and is in consolidation. Current price: 9.85naira/share Low risk Buy zone levels is between 6.8naira - 10naira/share Expecting #Multiverse to retest previous resistances at 17naira/share and 24naira/share if price attempts a recovery. 📈 Key Levels Breakout above ₦10.20 Breakout zone – key resistance turning into support if broken ₦17.1 TP1 – next major resistance (target) ₦24.5 TP2 – higher resistance / bull target Invalidation of this idea is a weekly close under 6.8naira/share
NSENG:MULTIVERSELong
by Ifiok-Trades
Updated
66
Trade Packet | LIVESTOCK FEEDS PLCNOT FINANCIAL ADVISORY 📘 TRADE PACKET — Livestock Feeds Plc (2H Chart) Patterns: Converging Triangle + Ascending Triangle (Contracting) Indicators: Ripster EMA Clouds (5–200) | Price: ₦6.65 🟩 BUY Zone • ₦6.10 – ₦6.40 • Triangle base + EMA(89/180) confluence • Entry near ₦6.25 offers best R:R with breakout potential 🟥 Stop‑Loss Zone • ₦5.90 • Below triangle support and EMA(200) • Protects against breakdown from apex compression 🟦 Exit / Take‑Profit Zone • ₦7.20 – ₦7.60 • Upper triangle resistance + measured move extension • Trail stop above ₦6.90 once price clears ₦7.10
NSENG:LIVESTOCKLong
by swayflowz
Fourth Quarter 2025 Nigerian share picks... Final Update!Q4 2025 TradingView: Nigerian Stock Picks Final Update: October - December 2025 Performance. This update tracks performance from the October 2025 picks (start of Q4) to the most recent prices, reflecting how the portfolio evolved into year-end. Strong Performers with Significant Gains VSPBONDETF:Up +50.2% The standout performer of Q4. Strong demand for fixed-income exposure drove aggressive upside momentum, making it the top gainer in the portfolio. ARADEL:Gained +37.9% Sustained bullish momentum in the energy space. Strong accumulation and trend continuation confirmed ARADEL as a core Q4 leader. DANGCEM:Up +16.0% Continued leadership in the cement sector, supported by infrastructure demand and steady institutional participation. MULTIVERSE:Gained +15.8% A strong recovery move, outperforming expectations and reclaiming lost ground from earlier weakness. Moderate or Mild Growth** VFDGROUP:Up +9.2% Consistent and orderly advance, reflecting stable fundamentals and improving sentiment. LEGENDINT:Gained +8.4% Gradual appreciation with improving investor interest and supportive volume structure. HMCALL:Up +7.1% A steady mover, maintaining stability and contributing positively to portfolio balance. Decliners TRANSPOWER:Down –2.2% Minor pullback after prior gains; consolidation rather than structural weakness. SUNUASSUR:Dropped –9.5% Underperformed due to lingering softness in insurance sector sentiment. CONOIL:Down –11.3% The weakest name in Q4, reflecting pressure in downstream oil stocks despite broader market strength. Overall Market Sentiment **Average portfolio change:+12.2% for Q4 2025** This reflects a clearly bullish Q4, driven primarily by energy, cement, and fixed-income ETF exposure. Gains comfortably outweighed losses, with leadership concentrated in ARADEL, VSPBONDETF, and DANGCEM. Trading Takeaway The Q4 2025 Nigerian stock portfolio delivered strong risk-adjusted performance, led by energy and defensive yield plays. While insurance and downstream oil lagged, the portfolio’s diversification allowed strong winners to dominate overall returns. Going forward, investors may consider: Profit protection on extended names like VSPBONDETF and ARADEL. *Accumulation on pullbacks in structurally sound stocks such as VFDGROUP, HMCALL, and SUNUASSUR. **Not Financial Advice (NFA)**
NSENG:LEGENDINT
by Ifiok-Trades
GTCO: Technical Outlook and Bullish Projection for 2026LSE:GTCO : Technical Outlook and Bullish Projection for 2026 The Guaranty Trust Holding Company (GTCO) has recently demonstrated a technical pullback toward a significant ascending trendline. This primary support structure has been developing since mid-April 2025, originating near the N57.5 level. This correction followed the stock reaching a notable all-time high (ATH) of approximately N103. Technical Analysis and Key Levels. Currently, the N89 level serves as a critical resistance zone. The price action at this junction will likely determine the medium-term trajectory. There are two primary scenarios to consider: 1. Resistance Confirmation: If the N89 zone holds as firm resistance, we may see a secondary retest of the ascending trendline. This would allow for further liquidity accumulation before a potential bullish continuation. 2. Support Stability: The primary ascending trendline remains the backbone of the current bullish thesis. A successful defence of this line suggests that the long-term upward momentum is still intact. Trade Setup and Risk Management. The following levels are identified based on current market structure and historical volatility: Entry Zone: N85.2 Target 1 (TP1): N103.2 (Previous ATH Resistance) Target 2 (TP2): N120.0 (Extended Projection) Stop Loss: N76.8 Risk-to-Reward (R:R) Profile: Scenario A (TP1): 1:2.14 Scenario B (TP2): 1:4.27 Disclaimer: This analysis is provided for educational and informational purposes only. It does not constitute investment advice, financial advice, or a recommendation to buy or sell any security. Trading involves significant risk of loss and is not suitable for all investors. Please conduct your own due diligence or consult with a licensed financial advisor before making any investment decisions.
NSENG:GTCOLong
by ForexClinik
22
1122334455667788991010
…999999

Made by humans

Select market data provided by ICE Data Services. Select reference data provided by FactSet. Copyright © 2026 FactSet Research Systems Inc.Copyright © 2026, American Bankers Association. CUSIP Database provided by FactSet Research Systems Inc. All rights reserved. SEC filings and other documents provided by Quartr.© 2026 TradingView, Inc.

More than a product
  • Supercharts
Screeners
  • Stocks
  • ETFs
  • Bonds
  • Crypto coins
  • CEX pairs
  • DEX pairs
  • Pine
Heatmaps
  • Stocks
  • ETFs
  • Crypto coins
Calendars
  • Economic
  • Earnings
  • Dividends
  • IPOs
More products
  • News Flow
  • Portfolios
  • Fundamental Graphs
  • Yield Curves
  • Options
  • Macro Maps
  • Pine Script®
Apps
  • Mobile
  • Desktop
Community
  • Social network
  • Wall of Love
  • Refer a friend
  • House Rules
  • Moderators
Ideas
  • Trading
  • Education
  • Editors' picks
Pine Script
  • Indicators & strategies
  • Wizards
  • Freelancers
  • Paid Spaces
Tools & subscriptions
  • Features
  • Pricing
  • Market data
  • Gift plans
Trading
  • Overview
  • Brokers
  • Brokers comparison
  • The Leap
Special offers
  • CME Group futures
  • Eurex futures
  • US stocks bundle
About company
  • Who we are
  • Space mission
  • Blog
  • Help Center
  • Careers
  • Media kit
Merch
  • TradingView store
  • Tarot cards for traders
  • The C63 TradeTime
Policies & security
  • Terms of Use
  • Disclaimer
  • Privacy Policy
  • Cookies Policy
  • Accessibility Statement
  • Security tips
  • Bug Bounty program
  • Status page
Business solutions
  • Widgets
  • Charting libraries
  • Lightweight Charts™
  • Advanced Charts
  • Trading Platform
Growth opportunities
  • Advertising
  • Brokerage integration
  • Partner program
  • Education program
Community
  • Social network
  • Wall of Love
  • Refer a friend
  • House Rules
  • Moderators
Ideas
  • Trading
  • Education
  • Editors' picks
Pine Script
  • Indicators & strategies
  • Wizards
  • Freelancers
  • Paid Spaces
Business solutions
  • Widgets
  • Charting libraries
  • Lightweight Charts™
  • Advanced Charts
  • Trading Platform
Growth opportunities
  • Advertising
  • Brokerage integration
  • Partner program
  • Education program
Look FirstLook First