Long
Long
Unilever Stock on NGX: Technical Analysis and ForecastUnilever stock on the NGX reached its all-time low of ₦10 around March 30, 2020, during the global market downturn. From March 2020 to November 4, 2024, it traded in a range between ₦10 and ₦20, consolidating within this zone.
On November 4, 2024, the stock broke out of the ₦10-₦20 range, signalling the start of a bullish rally that has since propelled the price upward.
Currently, the stock has completed a 50% retracement from its last highest point, a significant level often observed in technical analysis. Additionally, its present price is at the FIB 50 level, a key resistance zone that could determine the continuation or reversal of the upward trend.
Traders should closely monitor ₦40, as it represents a significant psychological and technical level to watch for further price action.
Forecast:
If the price breaks above FIB 50, it may continue its rally toward the ₦40 zone.
A rejection at FIB 50 could result in a pullback to test lower support levels.
 Long
Long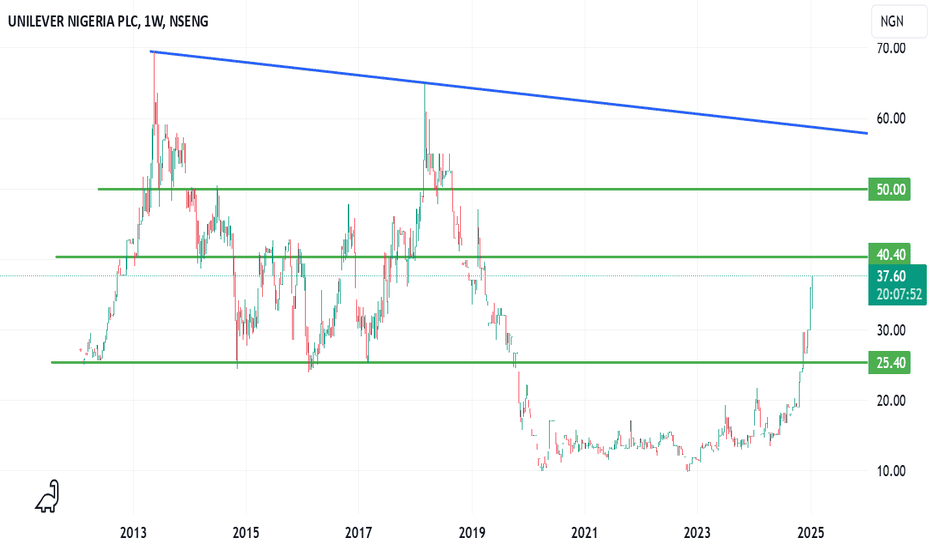
 Long
Long
 Long
Long
 Long
Long
 Long
Long
My Nigerian Share Picks for the first quarter of 2025In this video, I analyzed my share picks from September - the last quarter of 2024 and found by analysis an over 50% increment in portfolio. If you want to have my share picks for first quarter of 2025. Please visit tally.so
Breakdown for the last quarter of 2024; Average % Change: About +54.53% across 19 shares
Largest Gain: SUNUASS with +597.67%.
Largest Decline: DAARCOM with –11.27%.
Stocks with Notable Increases
SUNUASS (+597.67%) is an extreme outlier, far exceeding other gains.
Several others also showed strong growth, notably:
#UBA (+48.29%)
#STERLING (+47.06%)
#NEM (+44.74%)
CSE:ETI (+33.97%)
NSENG:ROYALEX (+30.77%)
$FTNCOCO (+30.43%)
Stocks with Moderate Increases
VITAFOAM (+36.57%), WEMABA (+40.31%), JAIZBANK (+38.89%), ACCESSC (+26.91%), FBNH (+27.73%), and UPDC (+23.85%) also contributed significantly to the overall positive trend.
Stocks with Declines
Only three recorded losses:
DAARCOM (–11.27%)
CHAMS (–5.85%)
NASCON (–8.82%)
The declines were relatively small compared to the large gains seen elsewhere. Overall, this set of shares leans strongly positive, with a few exceptions.
Short 
 Short
Short
Short 
FIDELITY: A CLEAR PATH FOR THIS CRUDE ECONOMYNigeria's economy has shown remarkable resilience in the second quarter of the year, defying expectations and paving the way for a promising outlook. Despite global challenges, the West African nation has made significant strides in key sectors, setting the stage for a robust performance in the remaining half of the year.
Under the leadership of Governor Cardoso, the CBN has implemented policies aimed at diversifying the economy, improving the business environment, and boosting investor confidence. These efforts have started to bear fruit, with notable gains in:
- Agriculture: Increased investment in the sector has led to enhanced productivity and exports.
- Infrastructure: Ongoing projects in transportation, energy, and telecommunications are expected to drive growth.
- Manufacturing: Improved policies have attracted foreign investment, boosting production and job creation.
With these positive developments, expectations are high that Cardoso's mandate will:
- Foster sustained economic growth
- Enhance Nigeria's global competitiveness
- Create jobs and improve living standards
As the economy continues to gain momentum, Nigeria is poised for a remarkable turnaround.  Long
Long
Long 
 Long
Long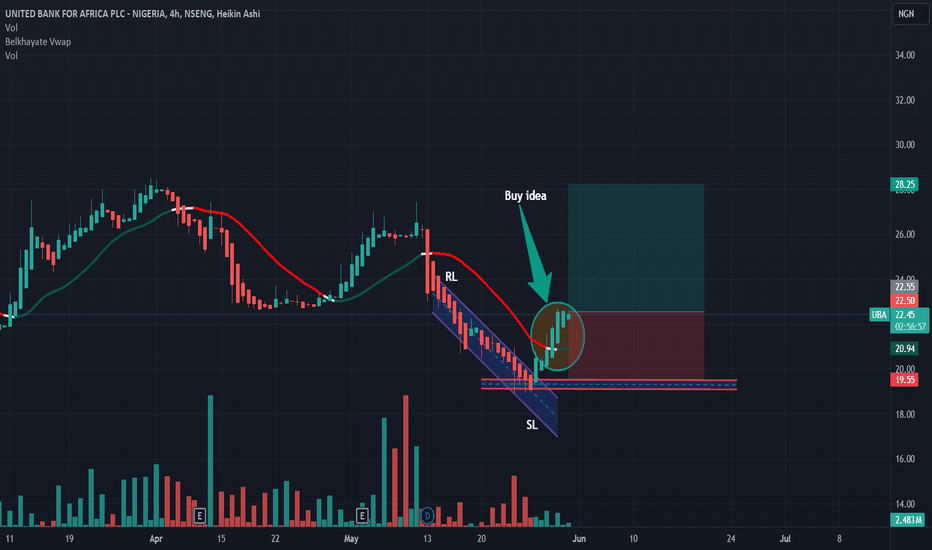
Long 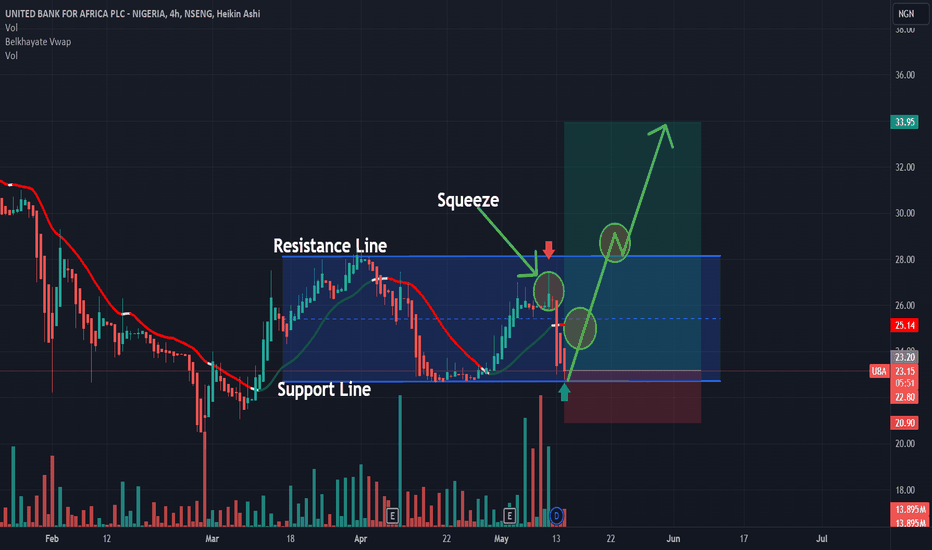
Short 
Nigerian Stock Market Analysis: Access Bank Technical Analysis Introduction
Nigerian Stock Market Analysis of Access Bank Technical Share Review. Access Bank stands as a beacon of opportunity, but how should investors interpret the current technical indicators? Let’s dive into the data and uncover the insights that could guide your next investment move.
Technical Indicators Overview
The technical indicators present a mixed picture, with oscillators signaling neutrality, moving averages suggesting a sell sentiment, and pivot points indicating potential support and resistance levels.
Moving Averages Analysis
Moving averages reflect a bearish sentiment, with both exponential and simple moving averages signaling a sell. This trend persists across various timeframes, from short-term to long-term, highlighting a consistent downward pressure on the stock price.
Pivot Points Analysis
Pivot points reveal critical price levels, with the classic, Fibonacci, Camarilla, Woodie, and DeMark pivot points indicating potential support and resistance zones for Access Bank shares. Understanding these levels can assist traders in setting entry and exit points. Overall, pivot point analysis aligns with the strong sell sentiment observed in other technical indicators.
MACD (Moving Average Convergence Divergence)
MACD is a trend-following momentum indicator that helps traders identify potential changes in the direction of a stock’s price movement. The blue line crosses below the orange line above the histogram, which signifies selling potential. The histogram also shows mild selling strength. This signal is oversold; traders should watch for potential trend reversals or buying opportunities. This is based on Nigerian Stock Market Analysis.
Support and Resistance Line
Support and resistance levels are areas on a stock chart where the price tends to find barriers to moving further in a particular direction. We have resistance at 25.80, 27.40 and 30.50, while support lines exist at 16.00 and 19.65. The price is about to break from 19.65 support back to 16.00.
Stochastic Oscillator
Traders use the stochastic oscillator to identify overbought and oversold conditions in the market. Access bank Shares are oversold (20%) on the daily chart for short-term to medium-term investors and heading toward oversold (20%) on the weekly chart for long-term investors or traders.
Recommendation Based on Market Oversold Signals
Despite the bearish technical indicators, it’s crucial to consider the broader market sentiment. The market appears oversold based on daily chart indicators, suggesting a potential reversal in the near future. Therefore, investors may view this as an opportunity to accumulate shares at a discounted price. Short-term and medium term investors can buy now at N19.30 or N16.00, take a profit at N25.80, and look further to take another profit at N30.00 based on market sentiment.
Conclusion
While technical analysis provides valuable insights, it’s essential to complement it with fundamental analysis and market sentiment. Access Bank’s stock presents an intriguing opportunity amidst the current market conditions. However, investors should exercise caution and conduct thorough research before making any investment decisions.
Remember, this analysis serves as a guide, not as financial advice. Always conduct your due diligence and consult with a financial advisor before executing any trades.
By offering a comprehensive analysis of Access Bank’s technical indicators and market conditions, this article aims to empower investors with the knowledge needed to navigate the Nigerian Stock Market effectively.  Long
Long
Access Bank Technical Analysis: On Nigerian Stock MarketIntroduction
Welcome to our in-depth technical analysis of Access Bank shares on the Nigerian Stock Market. In this analysis, we will examine various technical indicators, including RSI, MACD, moving averages, pivot points, and more, to provide valuable insights into Access Bank’s current market sentiment and potential investment opportunities.
Technical Indicators Overview: Access Bank’s technical indicators suggest a strong buy sentiment. The RSI (Relative Strength Index) stands at 60.413, indicating a buy signal, while the MACD (Moving Average Convergence Divergence) and CCI (Commodity Channel Index) also signal buy opportunities. However, the STOCH (Stochastic Oscillator) suggests a sell neutral, highlighting some conflicting signals in the short term.
Moving Averages Analysis: Access Bank’s moving averages analysis further supports a strong buy sentiment. The simple and exponential moving averages (MA) across different periods (5, 10, 20, 50, 100, and 200) all indicate buy signals. This suggests a positive trend in Access Bank’s stock price movement across various time frames.
Pivot Points Analysis: Pivot points analysis provides additional insights into potential support and resistance levels for Access Bank shares. The pivot points, including classic, Fibonacci, Camarilla, Woodie’s, and DeMark’s, suggest key price levels that traders and investors can use to make informed decisions. Overall, pivot points analysis aligns with the strong buy sentiment observed in other technical indicators.
MACD (Moving Average Convergence Divergence): MACD is a trend-following momentum indicator that helps traders identify potential changes in the direction of a stock’s price movement. The blue line crosses above the orange line below the histogram, which signifies buying potential. The histogram also shows good buying strength.
Support and Resistance Lines: Support and resistance levels are areas on a stock chart where the price tends to find barriers to moving further in a particular direction. We have resistance at 27.40 and 30.50, while support lines exist at 16.00 and 19.65
Stochastic Oscillator: Traders use the stochastic oscillator to identify overbought and oversold conditions in the market. Access bank Shares are overbought on the daily chart for short-term to medium-term investors.
Recommendation:
Based on the technical analysis conducted, Access Bank shares demonstrate a favorable outlook, with most indicators signaling a strong buy sentiment. Investors looking to capitalize on potential upward price movements may consider buying Access Bank shares. However, it’s essential to conduct thorough research and consider other factors, such as market trends and risk tolerance, before making investment decisions. Short-term and medium term investors can buy now and take a profit at N27.40 and look further to take another profit at N30.00 based on market sentiment.
Conclusion: In conclusion, Access Bank’s technical analysis reveals a positive market sentiment, with various indicators suggesting a strong buy recommendation. By leveraging technical insights such as RSI, MACD, moving averages, and pivot points, investors can make informed decisions and navigate the Nigerian stock market effectively. Please contact your broker for a final investment decision.
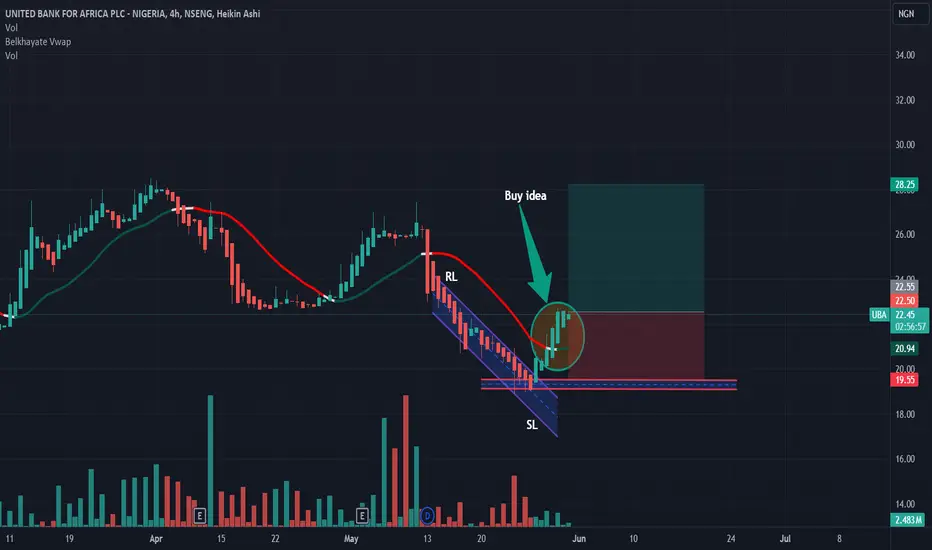
UBA Technical Analysis and Stock Review on Nigerian Stock MarketIn the dynamic world of stock trading, making informed decisions is crucial for investors seeking to maximize returns. Today, we delve into a comprehensive technical analysis of United Bank for Africa (UBA) shares. Providing insights into its performance on the Nigerian Stock Market and offering recommendations for potential investment opportunities.
Technical Indicators Overview: According to recent technical indicators. UBA shares are signaling a favorable outlook, with a majority indicating a “Buy” sentiment. The Relative Strength Index (RSI) stands at a neutral level, while the Stochastic Oscillator and Stochastic RSI reflect a neutral to overbought sentiment. The Williams %R, Commodity Channel Index (CCI), and Highs/Lows indicators suggest a bullish trend.
Moving Averages Analysis: Analyzing the moving averages. UBA shares exhibit a positive trend, with the majority of indicators signaling a “Buy.” The Simple and Exponential Moving Averages for various time periods, including MA5, MA10, MA20, MA100, and MA200, suggest favorable buying opportunities, albeit with some selling pressure observed in MA50.
Pivot Points Analysis: Pivot points further confirm a positive outlook for UBA shares, with both Classic and Fibonacci pivot points indicating potential support and resistance levels. These points serve as valuable reference markers for traders to assess price movements and strategize entry and exit points.
MACD (Moving Average Convergence Divergence): MACD is a trend-following momentum indicator that helps traders identify potential changes in the direction of a stock’s price movement. The blue line crosses above the orange line below the histogram, which signifies buying potential. The histogram also shows good buying strength.
Support and Resistance Lines: Support and resistance levels are areas on a stock chart where the price tends to find barriers to moving further in a particular direction. We have resistance at 26.55, 29.45, and 33.55, while support lines exist at 15.65, 19.50 and 22.20.
Stochastic Oscillator: Traders use the stochastic oscillator to identify overbought and oversold conditions in the market. UBA Shares are overbought on the daily chart for short-term investors.
Conclusion and Recommendation: Based on the technical analysis presented, UBA shares demonstrate strong potential for investment, supported by favorable indicators across various metrics. While some caution is warranted due to overbought signals in certain indicators, the overall sentiment remains bullish. Investors are encouraged to consider UBA shares as a viable addition to their portfolios. Leveraging current market conditions and technical indicators to make well-informed decisions. Short-term investors can wait and allow the price to come down to N22.20 and take a profit at N26.55. And further, looking for better opportunities, while medium- to long-term investors can buy now and take profit at N33.
for more information Long