LINK Price Climbs 4% as Whales Scoop Up $2.17M Worth of ChainlinChainlink (LINK) extended its weekly recovery on Wednesday, climbing more than 4% as investors returned to large-cap altcoins amid a broader crypto market rally. While Bitcoin and Ethereum provided the macro tailwind, LINK’s move appears to be backed by something stronger than market optimism. Fresh on-chain data shows record wallet growth, aggressive whale accumulation, and continued exchange outflows—three signals that often precede sustained upside when they align with improving technical structure.
Whale Buys $2.17 Million Worth of LINK
One of the biggest catalysts behind today’s price rally came from on-chain tracking platforms, which revealed that an anonymous whale accumulated approximately 273,793 LINK tokens, worth nearly $2.17 million, over the past two days at an average purchase price of around $7.94. The latest purchase reportedly occurred just minutes before the data surfaced, highlighting continued accumulation rather than a one-off transaction.
On-chain flows further strengthen the bullish narrative. LINK recorded more than $6.6 million in net exchange outflows over the last 24 hours and nearly $50 million during the past week, suggesting investors are steadily moving tokens off centralized exchanges into self-custody. Historically, declining exchange balances are viewed as a sign of reduced near-term selling pressure.
Chainlink Adoption Hits an All-Time High
Beyond whale activity, Chainlink’s network fundamentals continue to strengthen despite months of muted price action. According to on-chain data, the number of non-empty LINK wallets has surpassed 900,000 for the first time, setting a new all-time high. More than 20,000 new wallets have been added over the past month even as LINK traded near local lows.
The divergence between rising adoption and relatively subdued price performance suggests long-term investors have continued accumulating throughout the correction. Market analysts often view this type of accumulation phase as a constructive setup, particularly when network growth accelerates before price fully responds.
LINK Price Analysis: Can Bulls Push Toward $10?
LINK has staged a notable recovery after defending its long-term demand zone around $7.20-$7.40. The token has now reclaimed its short-term moving averages while breaking above a descending trendline that had capped price action since late May. Daily RSI has also climbed above 60, indicating strengthening bullish momentum without yet reaching overbought territory.
LINK price outlook
The next immediate resistance sits near $8.80-$9.00, where sellers previously rejected multiple recovery attempts. A decisive daily close above this region could accelerate buying momentum toward the psychological $10 level, followed by a stronger supply zone around $11.50-$12.00. However, failure to sustain above $8.20 may trigger a healthy retest of the breakout area before bulls attempt another move higher.
What’s Next for Chainlink?
Chainlink is increasingly showing signs that fundamentals are catching up with price action. Record wallet growth, multi-million-dollar whale purchases, and persistent exchange outflows suggest long-term conviction remains intact despite recent volatility. If broader crypto market sentiment stays supportive and LINK successfully clears the $9 resistance zone, the combination of improving technicals and strengthening on-chain metrics could pave the way for a larger recovery toward double-digit prices in the coming weeks.
3 rock cadeler swingGary saw the legendary "Three Rock Bottoms after a Right Ear Bunny Pullback" on his screen. It was a masterpiece—a technical signal so rare, it was whispered about in dark, caffeinated Discord servers.
The market paused, kissed the 200-day moving average like a trampoline, and violently slingshotted toward the moon.
Gary realized that bunny wasn't just hopping—it was launching a rocket.
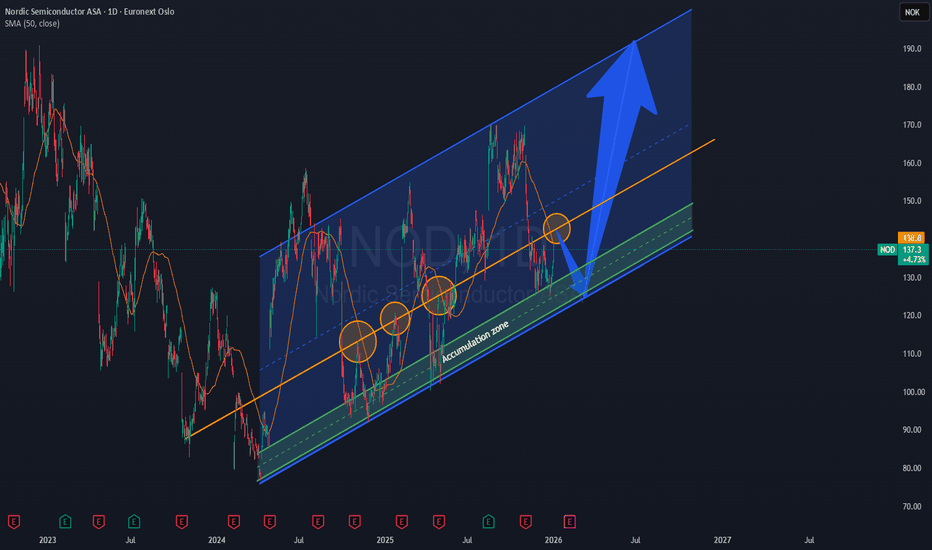
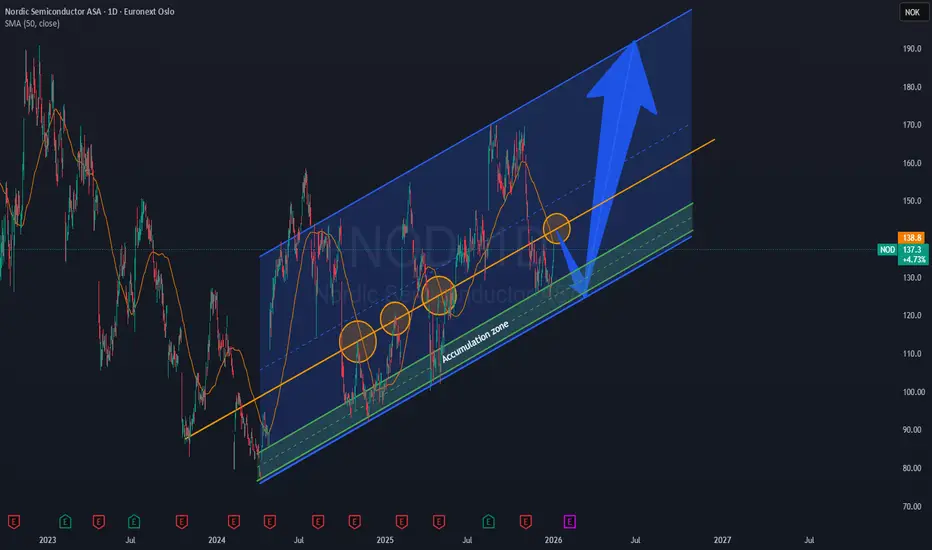
Rising Channel With Expected Pullback and VolatilityNordic Semiconductor is trading within a well-defined rising channel. As price approaches the orange resistance trendline, a pullback toward the lower boundary of the channel is expected. Historically, price tends to consolidate with elevated volatility around this rising resistance before making a decisive move. Such consolidation can build the foundation for a potential gap up and continuation higher within the channel. However, after a gap up, the focus shifts toward risk management, as price often forms a local top followed by a sharp pullback. This phase typically favors gradual profit-taking rather than aggressive new entries.
The FlareFoxCouple of monts ago we had the crazy bat pattern followed by the happy smily.
This makes way for the FlareFox pattern.
A rare market creature, the Flarefox appears only during strong uptrends.
Its fur is made of glowing green candlesticks, each one flickering upward like flames. The longer the candles, the brighter its tail burns.
Legend says:
“When the Flarefox runs uphill, resistance turns to dust.”
Traders who “spot” the Flarefox on charts believe it signals momentum, optimism, and continuation—but if its glow starts fading (candles shrinking), it may vanish just before a reversal.
KRAB - A joke that became a good investmentIm pushing the joke and found something that looks like a rly good investment.
Perfect text book example of accumulation after a downward move (down move not shown on the chart) and a reaccumulation at 0.5 at 11
additional evidences are the pick volume on early 2024 and re accumulation at 11 shown by blue arrows
we are targeting 17 for the next wave up, on 2026 and maybe further up to 21 then
cheers not financial advice
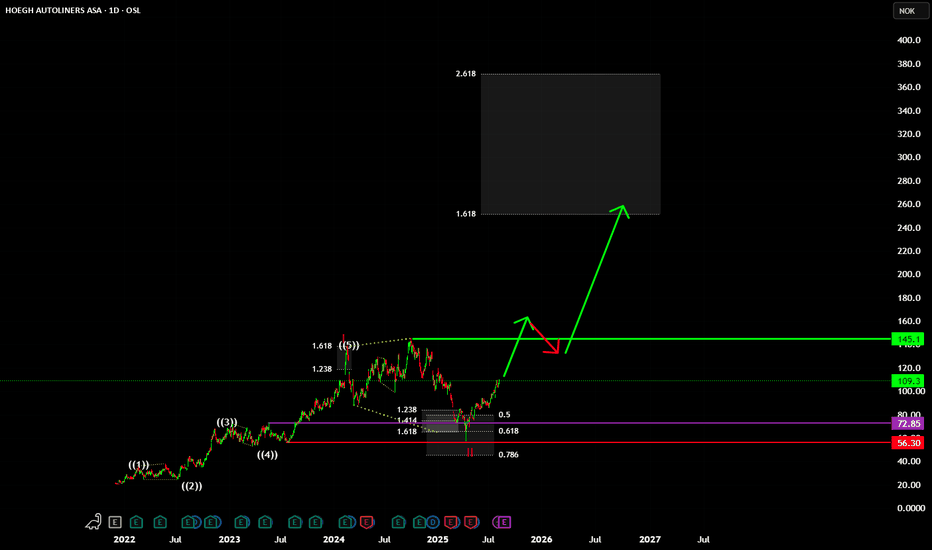
Hoegh autoliners - updateShort update (don´t have a lot of time to publish my ideas lately)
What happened since my last update
Since my last update, I bought the stock at 86.7 (25-11-17) and already sold half of it to be able to come out break-even in case the trade turned against me.
Analysis
The chart developed much better than I assumed and it seems to have created a bullish price action and we see now two 1-2 setups in a row. My expectation is that price will break the ATH and continue to reach about 180 NOK.
There is an alternative and that is a prolonged corrective pattern (WXY) if price is not breaking the ATH. This is possible because since the low in April 2025 someone could argue that we only see 3 waves up which could be a wave X.
Fundamental news
It seems that shipping rates have developed nicely and especially benefitted from the increased global selling of Chinese cars. As European car manufacturers are struggling this shift seems to have been a great decision and will continue with the present macro economic landscape.
oslo bullish divergence good to buybullish divergence and end of consolidation phase
good to buy
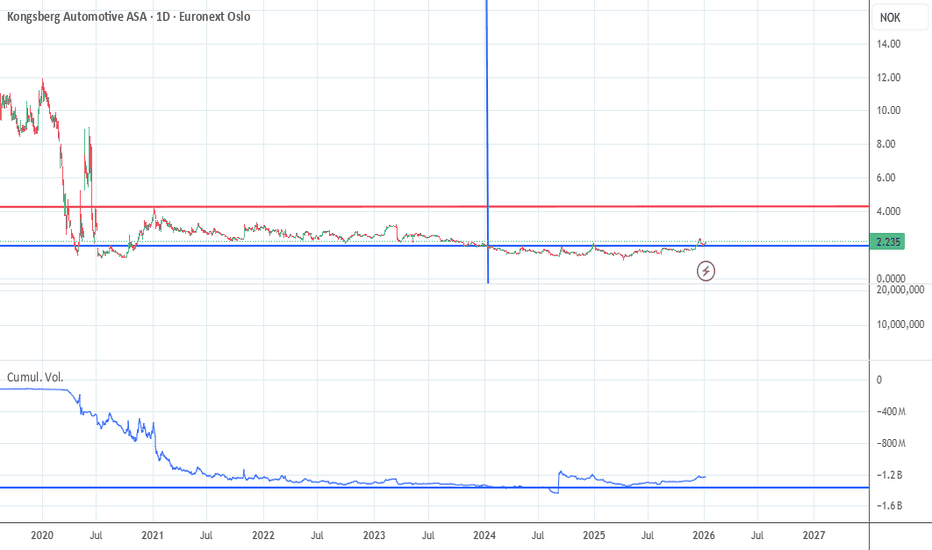
Kongsberg, March 31, 2024: Kongsberg Automotive (KA) has secured an extension of the air brake fittings (KA Raufoss ABC™ System) contract worth over EUR 58 million in estimated lifetime revenue.
The four-and-a-half-year contract, which starts in April 2025, is for the KA Raufoss ABC™ System. The lightweight, durable, and eco-friendly system from KA offers optimized safety, quick assembly, and global compatibility, designed to protect the brake system while reducing costs and environmental impact.
The extension was awarded by a leading manufacturer of trucks and buses for heavy transport applications. KA’s Raufoss plant in Norway will produce and supply the product.
“We are delighted to continue our partnership with this important global customer. It highlights the faith our partners have in our people and products," says David Redfearn, KA’s Chief Sales Officer, adding, “The KA Raufoss ABC™ System allows our customers to design their brake system most efficiently, reducing part numbers and total weight while ensuring the class leading performance benefits that our products provide.”
Exchange Euronext Oslo bullish divergence good to buy Exchange Euronext Oslo bullish divergence good to buy
Largest shareholders
# Name Shares % of top 20 % of total Account Type
1 ENI INTERNATIONAL BV 1 573 713 749 80.30 % 63.04 % PRIV
2 FOLKETRYGDFONDET 97 940 562 5.00 % 3.92 % PRIV
3 THE NORTHERN TRUST COMP, LONDON BR 35 532 270 1.81 % 1.42 % NOM
4 CLEARSTREAM BANKING S.A. 22 763 811 1.16 % 0.91 % NOM
5 VERDIPAPIRFONDET ALFRED BERG GAMBA 22 082 187 1.13 % 0.88 % PRIV
6 BNP PARIBAS 19 924 615 1.02 % 0.80 % NOM
7 GEVERAN TRADING COMPANY LTD 17 623 590 0.90 % 0.71 % PRIV
8 CITIBANK, N.A. 17 059 518 0.87 % 0.68 % NOM
9 JPMORGAN CHASE BANK, N.A., LONDON 16 082 634 0.82 % 0.64 % NOM
10 AVANZA BANK AB MEGLERKONTO 15 624 464 0.80 % 0.63 % MEG
11 VPF DNB AM NORSKE AKSJER 15 104 204 0.77 % 0.61 % PRIV
12 DEUTSCHE BANK AKTIENGESELLSCHAFT 14 300 000 0.73 % 0.57 % NOM
13 UBS SWITZERLAND AG 13 327 735 0.68 % 0.53 % NOM
14 MORGAN STANLEY & CO. LLC 12 827 053 0.65 % 0.51 % NOM
15 NORDNET BANK AB 11 799 687 0.60 % 0.47 % NOM
16 STATE STREET BANK AND TRUST COMP 11 590 803 0.59 % 0.46 % NOM
17 THE BANK OF NEW YORK MELLON 11 363 693 0.58 % 0.46 % NOM
18 JPMORGAN CHASE BANK, N.A., LONDON 10 853 703 0.55 % 0.43 % NOM
19 VERDIPAPIRFONDET ALFRED BERG NORGE 10 133 741 0.52 % 0.41 % PRIV
20 STATE STREET BANK AND TRUST COMP 10 072 706 0.51 % 0.40 % NOM
Total number owned by top 20 1 959 720 725 78.50 %
Total number of shares 2 496 406 246 100.00 %
HAUTO: TP NOK 141,- Generous dividends (+25%) [Pink: HOEGF]Some say Car-carrier (PCTC ) trade macro is challenging in, others claim this comes to pass late '26 or '27. All the while generous dividends are an insurance. Short term movements may meet resistance, must hold +100-ish, looking to medio jan 2025 for more upside.
Conensus TP : NOK 141
SUBCLooks to be continuing its downtrend 1st target 165, then possibly (depending on how it develops) lower to 130 (may or may not actually reach that level - could put a bottom before then).
At the moment to be treated as if price is heading to 2nd target of 130. Until a bottoming pattern emerges, and starts forming a new uptrend.
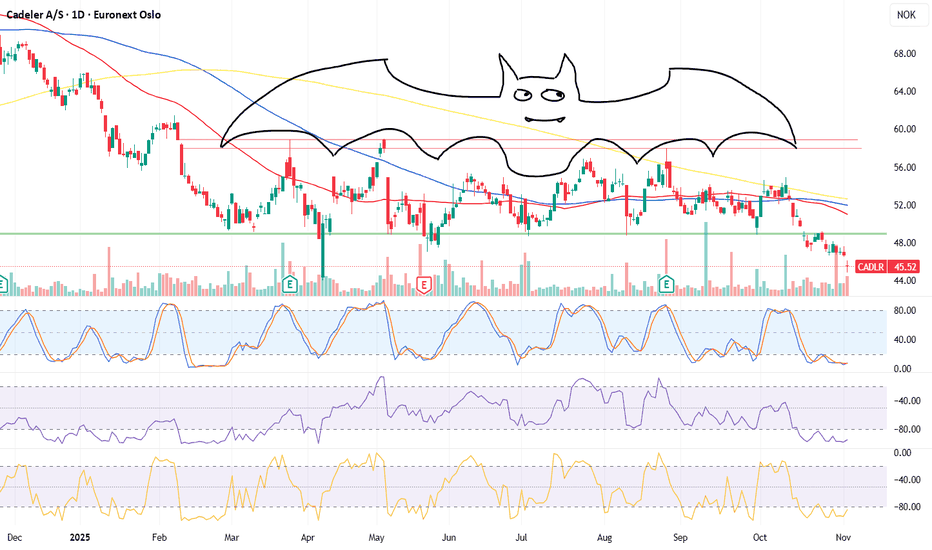
Phoenix incoming...My previous idea on Sep 9:
The veterans on the forum whispered, “That’s a bat pattern… the market’s telling us something.”
They spoke of it almost like folklore — a secret signal only revealed to those patient enough to wait for symmetry, for numbers to align just right. Some called it superstition, others called it science. But everyone leaned in closer, screens glowing in the dark, to see if the wings would complete.
Sure enough, on Halloween night the chart printed the rare Pumpkin Wick Doji — and right after, the stock dove like a vampire at happy hour.
...Since then, traders joke: beware the bat on Halloween — and never trust a Pumpkin Wick.
update Nov 4:
After the Halloween crash, the forums went quiet for a while — no one wanted to say it out loud, but the Bat had bitten deep. Charts were littered with red, portfolios drained like moonlit tides.
Then, one morning, someone noticed it.
A soft curve forming, elegant and patient — not a Bat this time, but something gentler. The veterans squinted and murmured, “Could it be… the Rising Phoenix Formation?”
Legend said it only appeared once the fear had burned itself out — when the last stop-loss had triggered, when even the boldest bulls had gone silent. Its wings weren’t jagged like the Bat’s, but smooth arcs of recovery, glowing faintly gold on the four-hour chart.
Newcomers laughed it off as cope. But the old timers leaned closer. They knew the story: the Phoenix comes from ashes, and the market loves nothing more than resurrection.
And sure enough, a week later, the first green candle broke through resistance like sunlight through storm clouds. Threads filled with celebration, memes, disbelief — and quiet awe.
Now, when the candles start to turn and hope flickers back, the traders whisper again:
“The Phoenix is forming.”
Nekkar at 10 Year High at 12 - Danske Bank with BUY rating at 18Nekkar weekly chart
Huge sell transaction in september 2024 has taken a long time to absorb, but the stock is finally presenting a bullish movement to the upside that could breach the 10 year high point at around 12 NOK.
Danske Bank recently published BUY recommendation with tp 18 NOK.
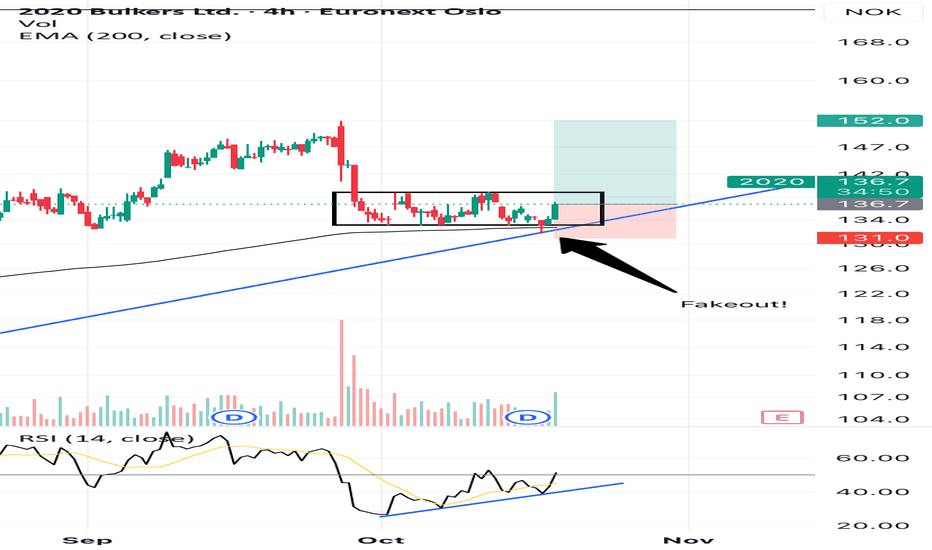
2020 LONG Price is consolidating within the retracement zone. A bullish divergence is also observed on the RSI. A long position will be considered after the 4H close with confirmation through increased volume. The target is set at the resistance level around 152, while the stop-loss is placed below the consolidation area.
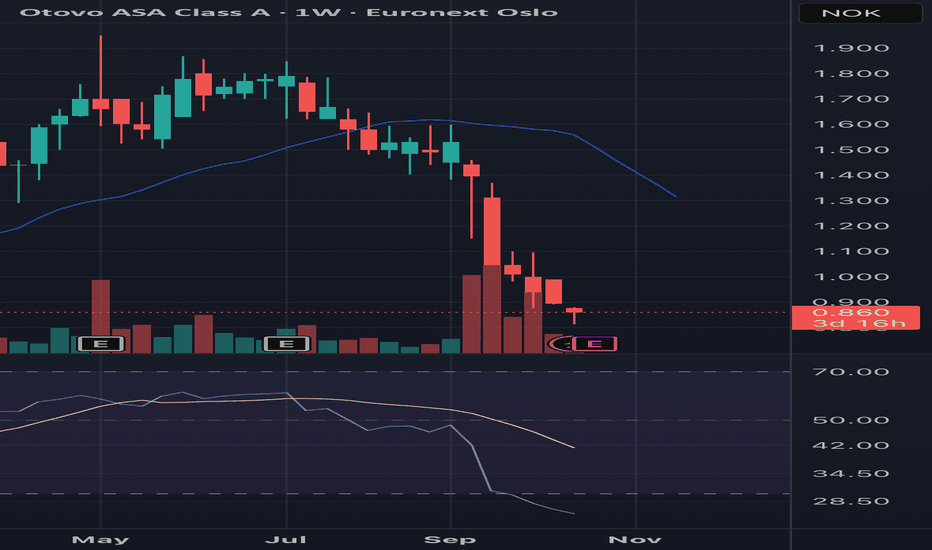
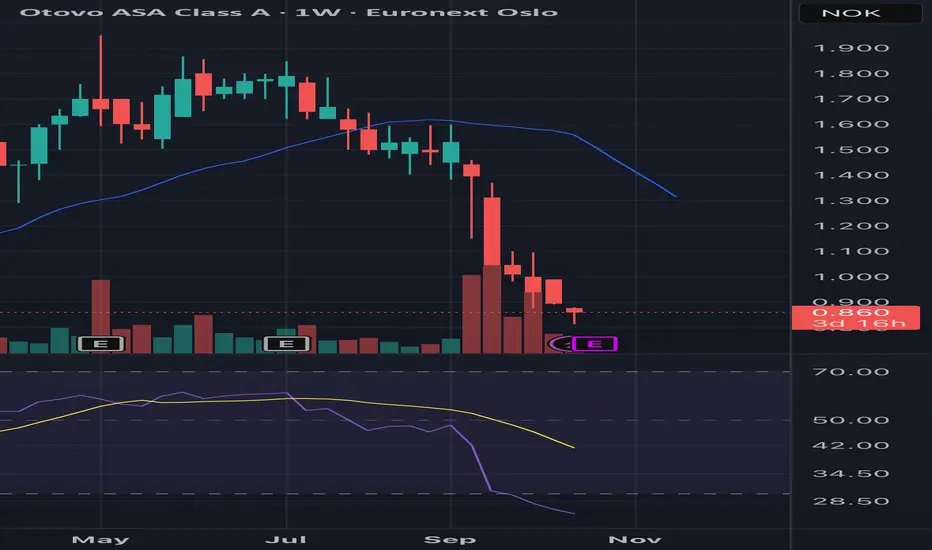
OTOVO Massive Layoffs + Exists Austrian MarketOtovo seems to have exited the Austrian market months after leaving Switzerland. The closure of two of its European markets signals a reversal in the company’s growth.
During 2025, Otovo implemented a suite of restructuring measures, portfolio assets sales, and market consolidation that brought their stock value to its Feb highest at 2.6Nok.
As of Oct 14, Otovo has lost over 65% of its market value, two key European
outlets, and close to 50% of its workforce.
Upcoming earnings call Oct 23 should reveal the unraveling of a turmoil year.
This Norwegian renewable darlin is tumbling down.
Nas seems to have some strong bullish momentum goingIve been watching this chart for long time and followed it, and i finally think I have the right bias for this one.
I believe we are waiting a lot of upside next few months.
Lets see how it plays out
Don't take this as financial advice and do your own research.
Stay safe
Norwegian Banking will always riseBanks today aquire more and more revenue as they reduce their workforce and steadily increase fees, as online automated services, AI chat takes over more and more. DnB gains the most no matter the world situation, as it can profit from the norwegian governments eternal spending from its oil income and sovereign wealth fund. And DNB is the largest bank in Norway getting the lions share in and of all of Norways combined economic activity.
The Bat Pattern The veterans on the forum whispered, “That’s a bat pattern… the market’s telling us something.”
They spoke of it almost like folklore — a secret signal only revealed to those patient enough to wait for symmetry, for numbers to align just right. Some called it superstition, others called it science. But everyone leaned in closer, screens glowing in the dark, to see if the wings would complete.
Sure enough, on Halloween night the chart printed the rare Pumpkin Wick Doji — and right after, the stock dove like a vampire at happy hour.
...Since then, traders joke: beware the bat on Halloween — and never trust a Pumpkin Wick.
MPCC - updateMPCC has also seen quite a rise of the share price and currently I´m convinced that this is not the end of the road and price will at least rich the upper channel line over the next years to complete the wave 3 (white count).
Currently, a leading diagonal started the rally and we have seen two 1-2 setups which is a very bullish sign. I´m looking for the price to take out the high indicated by the green line before it will need to pull back again. This pullback in the future will give us the chance to stock up on this company shares.
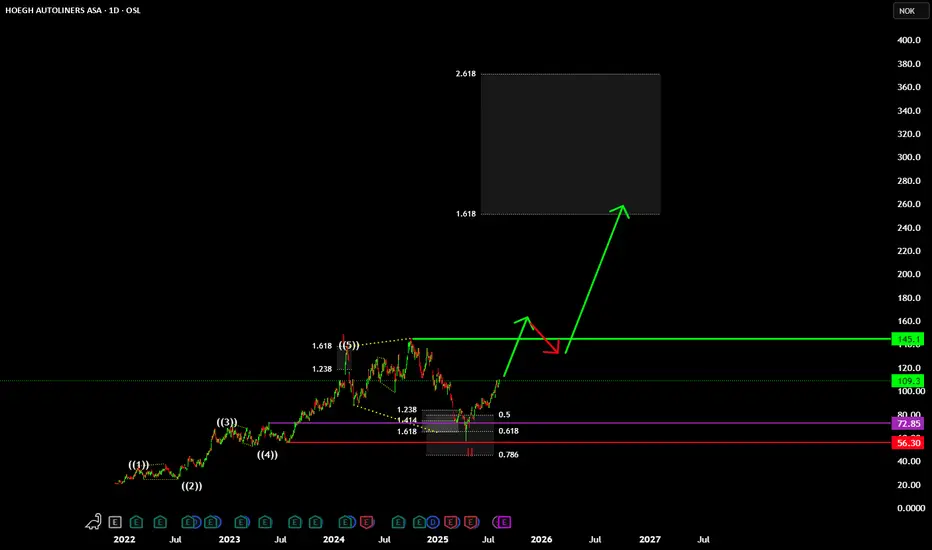
Hoegh Autoliner - updateThe development has been nothing short of being great since my last update on this Norwegian stock. The price fell more than I anticipated but nevertheless it followed my overall plan.
I remain extremely bullish on this company but it´s too early to give more precise price targets.
As of now we can assume that we will see price reach the 161% Fibonacci extension projected of the red 1-2 setup seen in the chart. This move will have several set-backs which I´m looking to use for additional buys.
Looks like the future is bright for the company ... as of now at least!