• Products
  • Community
  • Markets
  • Brokers
  • More
Get started
  • Markets
  • /Norway
  • /Stocks
  • /Ideas
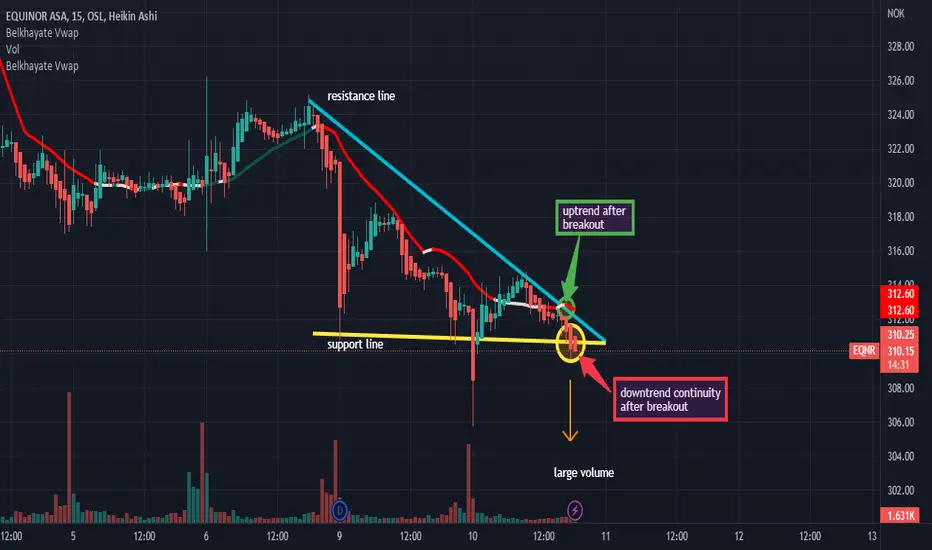
AnalysisAs you see on the chart we are in a downtrend so we will have a big probability of downtrend continuty after the breakout with force the support line by a big red candle with a large red volume. But, in other hand we could have a reversal trend (uptrend) after the breakout with force the vwap indicator and the resistance line by a big green candle with a large green volume. Thanks.
OSL:EQNR
by PAZINI19
1
Patient will pay of. in the next 25 days. NEL ASA Is an under-the-radar company - It was not the fast track company and I did a silly buy a year ago. But most likely you will hold your loss confidently if you know what's behind the scene. That's what I do. Now you have 15 days to analyze the company while it will retrace a little bit and take a position. Its cheap so think about that you gonna buy some expensive Jeans - 100$ Do not expect to fit the Jeans if you don't try them before (due diligence). Have fun -ElGatoTrade
OSL:NEL
by ElGatoTrade
Updated
Short medium termAccording to the current structure ,we first need to break the low before to start looking for a possible move up !
OSL:NELShort
by Centaurus_A
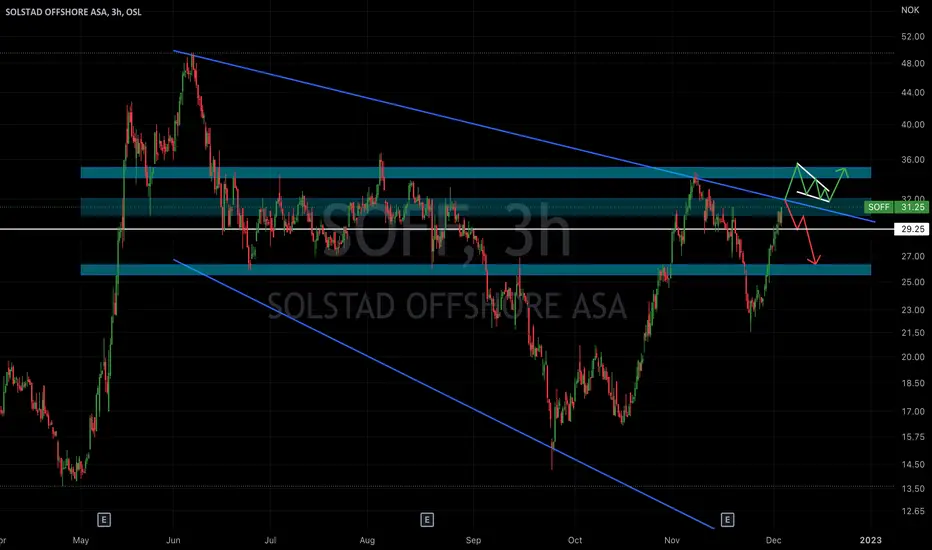
Solstad Offshore TrendSolstad Offshore Trend. Bull or bear? Decide yourself!
OSL:SOFF
by seriousSnow76925
Bakkafrost a Faroese fish farming company for salmonMany will probably change their positions in Norwegian fish farming companies to Bakkafrost after a bill on resource taxation. Most people were not aware that the political risk in the salmon industry was so great in Norway. Trend lines and pivot lines are determined by a longer time horizon than current charts in a year. Bakkafrost is located in a falling trend channel. It is seen by the chart and the long Moving Averages. From late September, the stock is in a short rising trend. It is su
OSL:BAKKA
by scorpiris
Bearish Divergence and Shooting StarYesterday Autostore was up 120% in 26 trading days. Q3 report on 10.th of November. I do not expect a very good report and price might dump to approx nkr 15. Stock is now very overbought with bearish divergence and shooting star pattern.
OSL:AUTOShort
by Zolly
Updated
Var Energi“Var Energi” went stock exchange listed in February. The stock is not in any long trend, no what best describes the price is a REC that the price fluctuates in. There is a double top that is to some extent supported by volume. Its width is 6 months. Immediately there is a break of 4%, but since the end of September the price has been hovering above and below the break line. The volume balance is negative both 1 and 3 months back. RSI 14 follows REC. The sum of Oscillators and Moving Averages sta
OSL:VAR
by scorpiris
recsi long play on the weekly timeframe.i see potential for a long posistion whit an upside of 20 - 25%. as we can see recsi is in an uptrend and has the 100ma and 200ma on the right side. we can also see price rejecting the 100ma and making the 100ma work as support. i would put my take profit at 22-24kr and stop loss at around 16,5 giving us a 1.77 risk/reward ratio.
RLong
by kasperessi
Norwegian pennystock Flex LNG (Natural gas transportation)Table of contents: § 1 About FLNG § 2 The market § 3 Why I am bullish § 4 The risks § 1 Flex LNG(FLNG) is a Norwegian company. They specialize in transporting liquid natural gas around the world for heat, cooking etc. They also create ships themselves, specially created within the CE regulations to ensure safe transport, as natural gas is highly flammable and explosive (who would have figured that one out...) Now, FLNG has done something that might be incredibly smart or it might be incredibl
FLong
by DonBboy
Updated
1
$SALM norwayLooks like 5 waves complete with ending diagonal in C of 5 of 5 .. Cannot find any news accompanying except supposedly successful CEO steps down after only few months
OSL:SALM
by raulmarcusbruno
$NEL - Egg of ColumbusThis is art and not trading advice. Please do your own due dilligence.
OSL:NEL
by MagicLevels
2
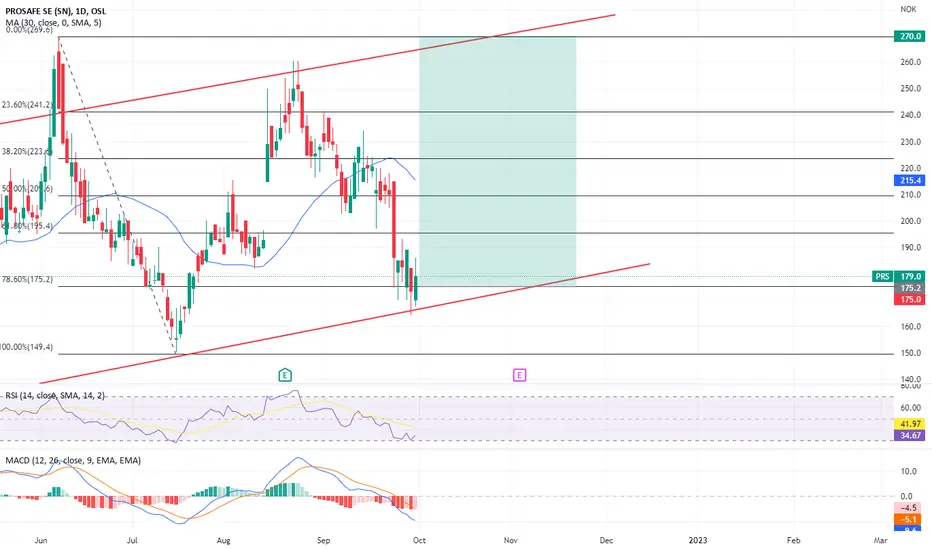
PRS LongMy prediction for Prosafe is long. The 4h MACD already shows us the turning point. Because of the OPEC+ production cut and SPR level we will see big gains altough the main market (DJI below 30 MA) is bearish.
OSL:PRSLong
by el2222
Yara is a stock many investors would love to own YARA is in a horizontal trend channel if you look a year + back. It is supported by the long averages. On the latter, the short averages are declining. The price has been between 393 and 500. In Friday's we had a marginal break down of 2.15% with slightly increased volume. Today, the stock is testing the floor of the trend. The stock is oversold in the short term, but not in the long term. Refers to RSI 7, 14 and 21. On volume balance OVB has been declining over the past 22 days. Oscill
OSL:YAR
by scorpiris
Hold the supply zone, or break a new lower low. Bounce on the lower side of RSI 50. EMA's looking bad Full YTD downtrend Wait for possible bounce in supply zone, or lower low, might happen.
OSL:ZAPShort
by DenAlmindeligeFar
1
NEL long ideaHello dear Traders, Here is my idea for #NEL Wait for daily close above the yellow trigger line (previous month high) to enter trade. We try to anticipate a 2-2 bullish reversal in the weekly chart Targets marked in the chart (black lines) Invalidation level marked with red line Good luck! ❤️Please feel free to ask any question in comments. I will try to answer all! Thank you. Please, support my work with like, thank you!❤️
OSL:NELLong
by Diplo_Trades
Potential bottom formation in Kahoot!Short Term We look to Buy at 17.60 (stop at 16.60) Price action looks to be forming a bottom. In line with the possible early stages of a reverse head & shoulders pattern and the strong rejection of dips, we look to set longs in anticipation of a swing higher. A break of 18.00 is needed to confirm follow-through bullish momentum. The preferred trade is to buy on dips. Our profit targets will be 19.60 and 21.00 Resistance: 18.00 / 20.00 / 28.64 Support: 16.75 / 15.00 / 12.50 Disclaimer
KLong
by Saxo
3
Norway NasaOnly for ballers. If you looking long term, this shares are the ones you retire for good. Incredible potential, infinite upside, is to buy now or get the f..k out from trading. Make your math, your chart, your analysis or whatever you want, this is it. This is the stock you been waiting all your life. This is my personal opinion, not an advice. Be smart, get a % from Norwegian taxpayers for life :)
OSL:NASLong
by DeFontain
3
Head & Shoulders pattern possibly playing outGolden Ocean had quite a run from lows in March 2020 to late May 2022 of +490%. Since then stock is down approx 40%. We now have this H&S pattern on weekly chart which signals a change in trend and also a possible Death Cross on daily chart in the making. Technicals are bearish and fundamentals are not looking great with Chinas economy slowing down and consuming less. Spot rates have nosedived and dry bulk sentiment is ‘worst it has been in many years’. Short positions are currently at 2,52%. C
GShort
by Zolly
Updated
2
Overbought FRO - Prepare for a pullback RSI oversold, Current price with a too big gap down to EMA20. ER around the corner. Looking for a pullback to one of the 3 support lines before a new more up.
OSL:FROLong
by DenAlmindeligeFar
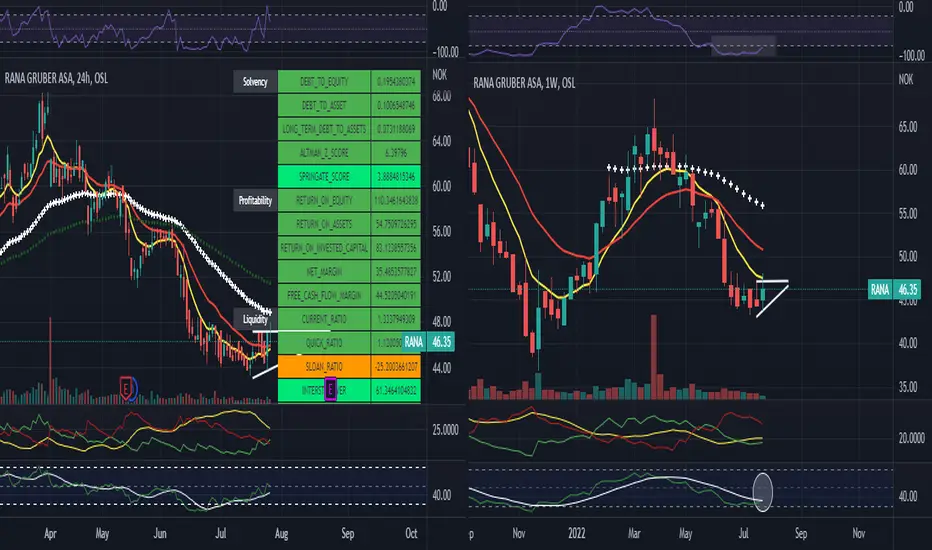
$RANA - Consolidation phase + Oversold Technical Analysis Oversold - William %R on 1Wk chart below -80% and there are reversal signs of a RSI bounce off the 1Wk 30 level. 1D chart showing consolidation phase happening within the wedge. We need to wait for the consolidation to finalise and 1D indicators to reset before we have a BUY or SELL signal. Price Target BUY side price target looking like NOK 48-56. Upside of 9%-27% Quality Screen EV/EBIT: 1.86 P/B: 4.68 ROIC: 83.12% with current ROCI at 70.84%
R
by subtlepapi
NOD decision timeNOD has reached a crucial area. The 0.618 fib, plenty of horizontal support and the 200MA coming up as well. What concerning are the huge amount of gaps below still all the way to NOK 66.40 (gray lines) AND the strong continuous downtrend we’ve been in lately. So bullish candles and break of the downtrend before touching NOD again.
OSL:NOD
by duco1
1
BWLPG reaching potential buying areaWaiting for test of the support area around the 0.5fib AND break of the downtrend (black arrow).
OSL:BWLPG
by duco1
GOGL at interesting levelGOGL is reaching strong support on the weekly chart. - horizontal support - 50MA weekly We could see the start of wave 4 from around this level. Now we need to wait for confirmation on lower timeframes.
G
by duco1
NEL ASA prepare for ER and watch ITM POWER ITM negatíve jelentés esetén a NEL lejtmenetben követni fogja az ITM Power-t. Ebben az esetben a NEL ASA vételét csak a jelentést megelőző 3 kereskedési nappal ajánlo. In case negative report NEL will follow ITM to the downside prior to 3D NEL ER report.
OSL:NEL
by ElGatoTrade
Updated
1234567891011121314151617181920212223242526272829303132333435
…999

Made by humans

Select market data provided by ICE Data Services. Select reference data provided by FactSet. Copyright © 2026 FactSet Research Systems Inc.Copyright © 2026, American Bankers Association. CUSIP Database provided by FactSet Research Systems Inc. All rights reserved. SEC filings and other documents provided by Quartr.© 2026 TradingView, Inc.

SOC 2 CompliantGDPR Compliant
More than a product
  • Supercharts
Screeners
  • Stocks
  • ETFs
  • Bonds
  • Crypto coins
  • CEX pairs
  • DEX pairs
  • Pine
Heatmaps
  • Stocks
  • ETFs
  • Crypto coins
Calendars
  • Economic
  • Earnings
  • Dividends
  • IPOs
More products
  • News Flow
  • Portfolios
  • Fundamental Graphs
  • Yield Curves
  • Options
  • Macro Maps
  • Pine Script®
  • MCP Server
Apps
  • Mobile
  • Desktop
Community
  • Social network
  • Wall of Love
  • Refer a friend
  • Creator program
  • House Rules
  • Moderators
Ideas
  • Trading
  • Education
  • Editors' picks
Pine Script
  • Indicators & strategies
  • Wizards
  • Freelancers
  • Marketplace
Tools & subscriptions
  • Features
  • Pricing
  • Market data
  • Gift plans
Trading
  • Overview
  • Brokers
  • Brokers comparison
  • The Leap
Special offers
  • CME Group futures
  • Eurex futures
  • US stocks bundle
About company
  • Who we are
  • Space mission
  • Blog
  • Help Center
  • Careers
  • Media kit
Merch
  • Tarot cards for traders
  • The C63 TradeTime
Policies & security
  • Terms of Use
  • Disclaimer
  • Privacy Policy
  • Cookies Policy
  • Accessibility Statement
  • Trust Center
  • Security tips
  • Bug Bounty program
  • Status page
Business solutions
  • Widgets
  • Charting libraries
  • Lightweight Charts™
  • Advanced Charts
  • Trading Platform
Growth opportunities
  • Advertising
  • Brokerage integration
  • Partner program
  • Education program
Community
  • Social network
  • Wall of Love
  • Refer a friend
  • Creator program
  • House Rules
  • Moderators
Ideas
  • Trading
  • Education
  • Editors' picks
Pine Script
  • Indicators & strategies
  • Wizards
  • Freelancers
  • Marketplace
Business solutions
  • Widgets
  • Charting libraries
  • Lightweight Charts™
  • Advanced Charts
  • Trading Platform
Growth opportunities
  • Advertising
  • Brokerage integration
  • Partner program
  • Education program
Look FirstLook First