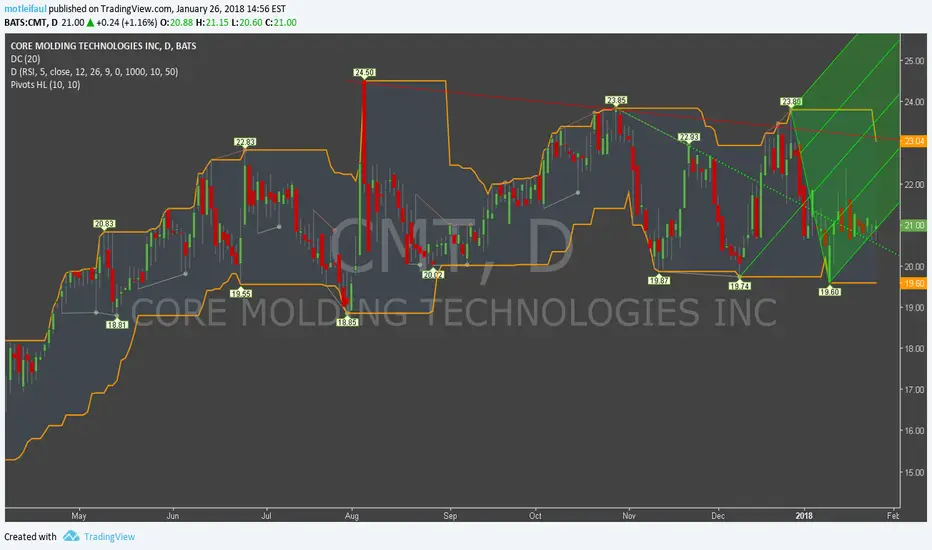
Momentum Stock: Core Molding TechnologiesCore Molding Technologies is a manufacturer of sheet molding compound (SMC) and molder of fiberglass reinforced plastics. The company's specialty lies in large-format moldings and offers a wide variety of fiberglass processes, including compression molding of SMC, glass mat thermoplastics (GMT), an
Core Molding Technologies Inc
No trades
No trades
Peers for comparison
0.82 USD
11.20 M USD
273.80 M USD
7.69 M
Last report date
Report period
EPS
Revenue
Earnings release details
Production sales rose 19.7% YoY, while tooling mix and Mexico startup costs weighed on margins. Capacity expansion is largely complete, with management expecting growth, cash generation, and returns to improve in 2027.
Company info
Sector
Industry
CEO
Eric L. Palomaki
Website
Headquarters
Columbus
Founded
1996
IPO date
Sep 16, 1988
ISIN
US2186831002
CUSIP
218683100
FIGI
BBG000F4PNF0
Identifiers
ISIN US2186831002
Core Molding Technologies, Inc. is an engineered materials company specializing in molded thermoplastic and thermoset structural products, principally in building products, utilities, transportation and powersports industries across North America. The company offers compression molding of sheet molding compound, resin transfer molding, liquid molding of dicyclopentadiene, spray-up and hand-lay-up, direct long-fiber thermoplastics and structural foam and structural web injection molding. The company was founded in 1996 and is headquartered in Columbus, OH.
CMT trading 97.2% below fair valueCore Molding Technologies, Inc., together with its subsidiaries, engages in the molding of thermoplastic and thermoset structural products. The company specializes in large-format moldings and offers a range of manufacturing processes that include compression molding of sheet molding compounds, bulk
See all ideas
Summarizing what the indicators are suggesting.
Neutral
Neutral
Neutral
An aggregate view of professional's ratings.
Neutral
Neutral
Neutral
Displays a symbol's price movements over previous years to identify recurring trends.
Frequently asked questions
Today, CMT trades at 22.18 USD.
For broader market analysis, dive into the technicals on the Core Molding Technologies Inc stock price chart and read the latest CMT news:
– Core Molding Technologies 3Q 2026: Revenue $90.24M, EPS $0.17— 10-Q Summary
– CMT: Growth accelerated as Mexico capacity came online, with broader benefits expected in 2027
– CMT: Production growth and Mexico expansion advanced as one-time costs pressured reported margins
For broader market analysis, dive into the technicals on the Core Molding Technologies Inc stock price chart and read the latest CMT news:
– Core Molding Technologies 3Q 2026: Revenue $90.24M, EPS $0.17— 10-Q Summary
– CMT: Growth accelerated as Mexico capacity came online, with broader benefits expected in 2027
– CMT: Production growth and Mexico expansion advanced as one-time costs pressured reported margins
Markets don't sleep, here's what's going on with CMT at the moment:
– Core Molding Technologies 3Q 2026: Revenue $90.24M, EPS $0.17— 10-Q Summary
– CMT: Growth accelerated as Mexico capacity came online, with broader benefits expected in 2027
– CMT: Production growth and Mexico expansion advanced as one-time costs pressured reported margins
See more updates in real-time with our News Flow.
– Core Molding Technologies 3Q 2026: Revenue $90.24M, EPS $0.17— 10-Q Summary
– CMT: Growth accelerated as Mexico capacity came online, with broader benefits expected in 2027
– CMT: Production growth and Mexico expansion advanced as one-time costs pressured reported margins
See more updates in real-time with our News Flow.
Core Molding Technologies Inc is scheduled to release its next earnings report on Mar 16, 2027.
Why it matters:
– Key event: Earnings often drive significant price moves
– Market expectations: Traders watch revenue, EPS, and guidance vs forecasts
– Volatility spike: Price swings can increase before and after the release
How to use it:
– Track upcoming reports in the Earnings Calendar
– Compare actual results with analyst estimates
– Monitor price reaction and volume on Supercharts
Why it matters:
– Key event: Earnings often drive significant price moves
– Market expectations: Traders watch revenue, EPS, and guidance vs forecasts
– Volatility spike: Price swings can increase before and after the release
How to use it:
– Track upcoming reports in the Earnings Calendar
– Compare actual results with analyst estimates
– Monitor price reaction and volume on Supercharts
CMT stock is 4.83% volatile and has beta coefficient of 0.64.
What it means:
– Volatility: Shows how much the price fluctuates over time
– Beta > 1: More volatile than the market
– Beta < 1: Less volatile, more stable
Important to know:
– Volatility can increase during earnings, news events, or market stress
– Large-cap stocks like CMT are typically less volatile than smaller companies
Track every detail on Core Molding Technologies Inc stock chart and check out the list of the most volatile stocks — is Core Molding Technologies Inc there?
What it means:
– Volatility: Shows how much the price fluctuates over time
– Beta > 1: More volatile than the market
– Beta < 1: Less volatile, more stable
Important to know:
– Volatility can increase during earnings, news events, or market stress
– Large-cap stocks like CMT are typically less volatile than smaller companies
Track every detail on Core Molding Technologies Inc stock chart and check out the list of the most volatile stocks — is Core Molding Technologies Inc there?
To understand the CMT stock performance, it's worth checking price changes for various periods to get the full picture:
– 1 day — +3.28%
– 1 week — −0.71%
– 1 month — −3.87%
CMT all-time low was 0.31 USD (May 5, 1994), and its highest price is 30.09 USD (Oct 2, 2023). Find more dynamics in the Stock Heatmap and on the Core Molding Technologies Inc stock chart.
– 1 day — +3.28%
– 1 week — −0.71%
– 1 month — −3.87%
CMT all-time low was 0.31 USD (May 5, 1994), and its highest price is 30.09 USD (Oct 2, 2023). Find more dynamics in the Stock Heatmap and on the Core Molding Technologies Inc stock chart.
Core Molding Technologies Inc market capitalization is 191.46 M, representing the total value of all its outstanding shares (price × shares outstanding).
What it means:
– Market cap is one of the key ways to classify companies (large-cap, mid-cap, etc.)
– It reflects how investors value the company today
– It changes constantly with stock price movements
What to look at next:
– Market cap trends: Rising cap may signal growth and investor confidence; falling cap can reflect risk or downturns
– Price vs shares: Changes can come from Core Molding Technologies Inc stock price moves or share count (buybacks, issuance)
– Valuation ratios: Compare market cap with revenue and earnings
– Peer comparison: See how Core Molding Technologies Inc stacks up against other companies
What it means:
– Market cap is one of the key ways to classify companies (large-cap, mid-cap, etc.)
– It reflects how investors value the company today
– It changes constantly with stock price movements
What to look at next:
– Market cap trends: Rising cap may signal growth and investor confidence; falling cap can reflect risk or downturns
– Price vs shares: Changes can come from Core Molding Technologies Inc stock price moves or share count (buybacks, issuance)
– Valuation ratios: Compare market cap with revenue and earnings
– Peer comparison: See how Core Molding Technologies Inc stacks up against other companies
The safest way to buy Core Molding Technologies Inc stocks is through a reliable broker. Create an account, fund it, and place a buy order.
You can trade CMT directly from TradingView:
– Choose a broker: Explore our supported trading partners and pick one that fits your needs
– Compare options: View available brokers side by side to evaluate fees and features
– Connect your account: Open Supercharts, click “Trade”, select your broker, and log in
– Start trading: Place orders without leaving the chart
Tip: If you’re new to trading, try paper trading first — it lets you practice strategies in real market conditions without risking funds.
You can trade CMT directly from TradingView:
– Choose a broker: Explore our supported trading partners and pick one that fits your needs
– Compare options: View available brokers side by side to evaluate fees and features
– Connect your account: Open Supercharts, click “Trade”, select your broker, and log in
– Start trading: Place orders without leaving the chart
Tip: If you’re new to trading, try paper trading first — it lets you practice strategies in real market conditions without risking funds.
As of Nov 10, 2026, the company has 1.24 K employees.
Why traders follow this data:
– Company scale: Employee count reflects the size and global reach of the business
– Operational footprint: Higher headcount often indicates broader product lines, retail presence, or services
– Trend signal: Changes over time can reflect hiring growth, restructuring, or efficiency improvements
See our rating of the largest employers to find more opportunities.
Why traders follow this data:
– Company scale: Employee count reflects the size and global reach of the business
– Operational footprint: Higher headcount often indicates broader product lines, retail presence, or services
– Trend signal: Changes over time can reflect hiring growth, restructuring, or efficiency improvements
See our rating of the largest employers to find more opportunities.
Investing in Core Molding Technologies Inc depends on your goals, risk tolerance, and market conditions. It’s essential to analyze the stock before making a decision.
First, study Core Molding Technologies Inc financials and track their dynamics on the Fundamental Graphs:
– Business fundamentals: Revenue, earnings, and growth trends
– Valuation: P/E ratio, market cap, and how it compares to peers
– Profitability: Margins, return on equity, and cash flow
– Dividends (if any): Yield, payout ratio, and consistency
Then explore our CMT technicals – signals based on essential indicators calculations:
– Today — sell
– 1-week — neutral
– 1-month — buy
Combine fundamental and technical analysis for better results.
First, study Core Molding Technologies Inc financials and track their dynamics on the Fundamental Graphs:
– Business fundamentals: Revenue, earnings, and growth trends
– Valuation: P/E ratio, market cap, and how it compares to peers
– Profitability: Margins, return on equity, and cash flow
– Dividends (if any): Yield, payout ratio, and consistency
Then explore our CMT technicals – signals based on essential indicators calculations:
– Today — sell
– 1-week — neutral
– 1-month — buy
Combine fundamental and technical analysis for better results.
Core Molding Technologies Inc stock ticker depends on the exchange where it’s listed. On the AMEX, its primary exchange, Core Molding Technologies Inc stocks trade under the symbol CMT.
About tickers:
– Unique identifiers: A ticker is a short code used to find and trade a stock
– Exchange-specific: The same company may have different tickers across exchanges
– Search shortcut: Used on trading platforms, charts, and screeners
Remember:
– Some companies have multiple listings
– Always check the exchange prefix to avoid confusion
Learn how to find your desired assets in our Symbol Search.
About tickers:
– Unique identifiers: A ticker is a short code used to find and trade a stock
– Exchange-specific: The same company may have different tickers across exchanges
– Search shortcut: Used on trading platforms, charts, and screeners
Remember:
– Some companies have multiple listings
– Always check the exchange prefix to avoid confusion
Learn how to find your desired assets in our Symbol Search.
CMT earnings for the last quarter are 0.33 USD per share, whereas the estimation was 0.06 USD, resulting in a 450.00% surprise. The estimated earnings for the next quarter are 0.07 USD per share.
How to read financials:
– Compare actual vs estimates: Earnings beats or misses often drive price moves
– Watch market reaction: Price response matters as much as the numbers
– Look at forward guidance: Future estimates signal expected growth
– Track trends: Analyze results across multiple quarters, not just one
Follow other essential metrics in Core Molding Technologies Inc financials:
– Revenue growth: Shows business expansion
– Margins (operating, net): Reflect profitability and efficiency
– Free cash flow: Indicates real cash generation
– Debt levels: Impacts financial stability and risk
How to read financials:
– Compare actual vs estimates: Earnings beats or misses often drive price moves
– Watch market reaction: Price response matters as much as the numbers
– Look at forward guidance: Future estimates signal expected growth
– Track trends: Analyze results across multiple quarters, not just one
Follow other essential metrics in Core Molding Technologies Inc financials:
– Revenue growth: Shows business expansion
– Margins (operating, net): Reflect profitability and efficiency
– Free cash flow: Indicates real cash generation
– Debt levels: Impacts financial stability and risk
Core Molding Technologies Inc revenue for the last quarter amounts to 90.24 M USD despite the estimated figure of 86.18 M USD. In the next quarter revenue is expected to reach 67.90 M USD.
How to read this data:
– Compare actual vs estimates: Revenue beats or misses can move the stock
– Watch market reaction: Price response shows how investors interpret results
– Look at growth: Compare with previous quarters and year-over-year data
– Track trends: One quarter matters less than consistent performance
Follow other essential metrics in Core Molding Technologies Inc financials:
– Earnings (EPS): Profitability per share
– Margins (gross, operating): Efficiency and cost control
– Free cash flow: Cash available after expenses
How to read this data:
– Compare actual vs estimates: Revenue beats or misses can move the stock
– Watch market reaction: Price response shows how investors interpret results
– Look at growth: Compare with previous quarters and year-over-year data
– Track trends: One quarter matters less than consistent performance
Follow other essential metrics in Core Molding Technologies Inc financials:
– Earnings (EPS): Profitability per share
– Margins (gross, operating): Efficiency and cost control
– Free cash flow: Cash available after expenses
Yes, you can track Core Molding Technologies Inc financials in yearly and quarterly reports right on TradingView.
Use our Earnings Calendar to never miss important releases and spot opportunities early.
No, Core Molding Technologies Inc does not currently pay dividends to its shareholders.
Instead of distributing profits as cash payments, the company may choose to reinvest earnings back into the business — for example, in growth, innovation, acquisitions, or debt reduction.
What to consider instead:
– Earnings growth: Is the company increasing profitability over time?
– Revenue expansion: Is the business scaling its operations?
– Free cash flow: Does it generate enough cash to potentially support future dividends?
– Share buybacks: Some companies return capital through repurchasing shares instead of dividends
Instead of distributing profits as cash payments, the company may choose to reinvest earnings back into the business — for example, in growth, innovation, acquisitions, or debt reduction.
What to consider instead:
– Earnings growth: Is the company increasing profitability over time?
– Revenue expansion: Is the business scaling its operations?
– Free cash flow: Does it generate enough cash to potentially support future dividends?
– Share buybacks: Some companies return capital through repurchasing shares instead of dividends
CMT reached its all-time high of 30.09 USD on Oct 2, 2023. Its all-time low was 0.31 USD and was reached on May 5, 1994.
Explore the Core Molding Technologies Inc stock price chart to see more price history, and discover companies reaching new all-time highs and lows.
Core Molding Technologies Inc EBITDA is 16.73 M USD, with an EBITDA margin of 8.56%.
EBITDA is a measure of core operating performance, showing how much profit the company generates from its main business activities before accounting for financing and accounting-related costs.
What it means:
– Operating strength: Helps assess profitability from core operations
– Efficiency signal: Rising EBITDA often reflects improving business performance
– Comparability: Useful for comparing companies with different capital structures
What to look at next in Core Molding Technologies Inc statements:
– Revenue growth: Shows whether the business is expanding
– Net income: Captures full profitability after all expenses
– Free cash flow: Shows actual cash generated
– Debt levels: Important when evaluating earnings quality
EBITDA is a measure of core operating performance, showing how much profit the company generates from its main business activities before accounting for financing and accounting-related costs.
What it means:
– Operating strength: Helps assess profitability from core operations
– Efficiency signal: Rising EBITDA often reflects improving business performance
– Comparability: Useful for comparing companies with different capital structures
What to look at next in Core Molding Technologies Inc statements:
– Revenue growth: Shows whether the business is expanding
– Net income: Captures full profitability after all expenses
– Free cash flow: Shows actual cash generated
– Debt levels: Important when evaluating earnings quality
Analyst forecasts suggest a price range between 30.00 USD and 30.00 USD for CMT, based on current estimates.
Remember:
– Forecasts show possible scenarios, not guaranteed outcomes
– They're based on multiple analysts’ models and assumptions
– Target prices change with earnings, news, and market conditions
Don't rely on analysts' opinions alone:
– Use technical analysis: Trend, support/resistance, momentum
– Study fundamentals: Revenue, earnings, margins
– Account for market context: News, macro trends, sector performance
Remember:
– Forecasts show possible scenarios, not guaranteed outcomes
– They're based on multiple analysts’ models and assumptions
– Target prices change with earnings, news, and market conditions
Don't rely on analysts' opinions alone:
– Use technical analysis: Trend, support/resistance, momentum
– Study fundamentals: Revenue, earnings, margins
– Account for market context: News, macro trends, sector performance