CBOT Wheat — Pullback Holds Support, Next Leg Higher in FocusWheat continues to behave beautifully from a technical standpoint.
We recently saw price fail almost exactly at the Fibonacci extension at 792. Since then, the pullback has retraced straight back to the first level of support at 711 — the July 2026 high — and that prior resistance is now acting as support. That's about as clean as technical structure gets.
This looks like the correction lower we were anticipating. A deeper pullback toward 688 (the May 2026 high) can't be ruled out, but as things stand, wheat looks well placed for another leg higher.
Key levels to watch:
Support: 711 (prior resistance, now support) / 688 (deeper support, May '26 high)
Upside target 1: 792–795 (recent high)
Upside target 2 (monthly): 825 — 38.2% retracement of the 2022–2025 decline
Long-term target: 928 — 50% retracement, reinforced by proximity to the 2011 (916) and 2012 (947) highs
Wheat is a cyclical market, and this looks like a structural bottom longer-term, with further upside potential. Definitely one to have on the radar.
Disclaimer:
The information posted on Trading View is for informative purposes and is not intended to constitute advice in any form, including but not limited to investment, accounting, tax, legal or regulatory advice. The information therefore has no regard to the specific investment objectives, financial situation or particular needs of any specific recipient. Opinions expressed are our current opinions as of the date appearing on Trading View only. All illustrations, forecasts or hypothetical data are for illustrative purposes only. The Society of Technical Analysts Ltd does not make representation that the information provided is appropriate for use in all jurisdictions or by all Investors or other potential Investors. Parties are therefore responsible for compliance with applicable local laws and regulations. The Society of Technical Analysts will not be held liable for any loss or damage resulting directly or indirectly from the use of any information on this site.
Wheat Futures
No trades
No trades
In-depth trading ideas
Incremental analysis of wheatWheat remains structurally bullish.
Strong liquidity inflows, highlighted by the rising volume profile, support further upside toward the previous record high. Renewed Black Sea disruptions, Russia–Ukraine tensions, tighter U.S. wheat supply, and adverse weather risks are reinforcing the bullish fundamental backdrop.
Sasha Charkhchian
COT 101 · Lesson 05 — Net Positioning Extremes🔵 WHAT "EXTREME" MEANS
A net position is extreme when it sits at the edge of its own history — the highest or lowest reading in 6, 12, or 24 months. Not "high", not "low": the outer band of what this market has actually seen. The next lesson gives this a precise number.
🔵 WHY WHEAT
The earlier lessons in this series used gold; this one switches to wheat. Not for variety — because this method is at its cleanest in agriculture. In physical grain markets the commercials are genuine hedgers: farmers, elevators and millers who must cover real product against the market in both directions, regardless of price. Their positioning is structural, so their extremes are honest and the turns they mark are meaningful. In metals a large share of the commercial bucket is banks and trading desks whose net is noisier and less anchored to physical hedging — the logic holds, but the signal is fuzzier. Wheat is the clearest classroom for reading a commercial extreme.
🔵 HOW I BUILD THE ZONES
Take the last 12 months of the commercial net line. Find its highest and lowest reading inside that window, and set a level at each — those two extremes are the band. The span between them is 100%.
Now split that span: the top 20% is the green zone, the bottom 20% is the red zone, the middle 60% is the neutral range. Line in the upper band = commercials very long for that window; in the lower band = very short; in the middle = unremarkable.
The same construction works on any window — 3, 6 or 24 months. Each window answers a different question: how extreme is the position right now, against the recent picture, the cycle or the structural band. That is the whole method: a rolling window, two extremes, a 20/60/20 split.
🔵 THE ZONE IS THE MAP, THE EXIT IS THE TRIGGER
The green zone means commercials are very long; the red zone means they are very short. That alone is not a trigger. Being in a zone says: an extreme is building, and the move in the opposite direction is likely somewhere ahead. Price can sit inside the extreme for weeks.
The move typically starts when the zone is LEFT. Watch the weekly close: when commercials rotate out of the green zone (their net falls below the band) the long move is really under way. When they rotate out of the red zone, the short move is under way. In both cases the rotation is the confirmation — commercials unwinding the winning side as the move plays out. Often the disciplined read is to wait for that exit rather than act on the first touch of the zone.
🔵 ONE SIDE IS ENOUGH
You do not need both flanks to make the point. A single clean example — commercials rotating out of the green zone while the extreme band is drawn — shows the setup. Adding the mirrored case buries the lesson in labels. Draw one exit well, not two badly.
🔵 THREE WINDOWS
The 12-month example scales: 6 months for the recent picture, 12 for the cycle, 24 for the structural band. An extreme that holds across all three is stronger than one that shows up in only one.
Next lesson: the z-score — turning "extreme" from a feeling into a number.
Educational content only. Not investment advice.
Chart of the Week: CBOT Wheat FuturesWheat has been one of the standout movers of 2026, trending sharply higher for most of the year — and the past six weeks have brought a marked acceleration to the upside.
Notably, this week's high landed almost exactly on one of our Fibonacci extensions at 792/bushel — the 1.618 extension of the move from the January low to the early March peak, projected from the mid-April low. Some consolidation around this resistance wouldn't surprise us, but on any pullback we'd expect support to hold well ahead of the July peak at 711 and the May peak at 688.
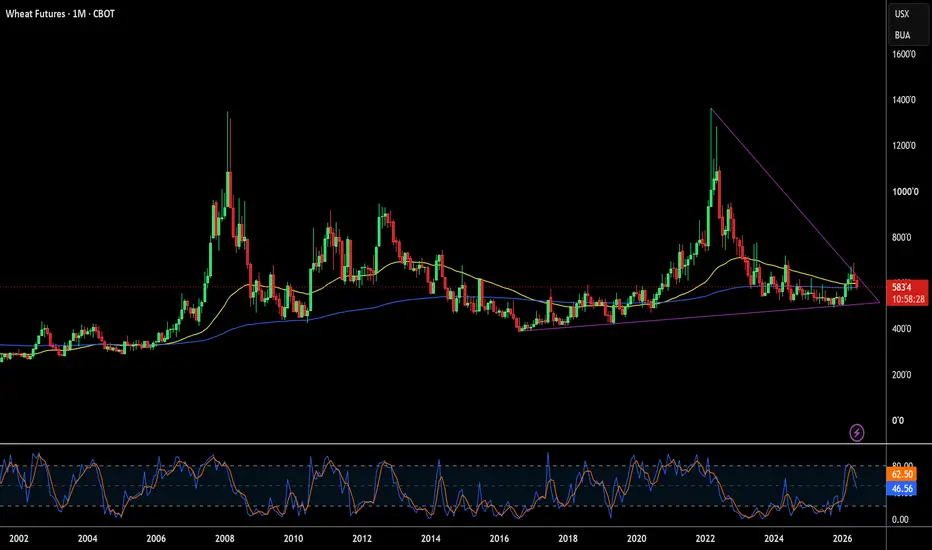
Zooming out, the picture stays constructive. On the longer-term chart, wheat remains inside a broad uptrend that has been intact since 2001, and price appears to have carved out a cyclical base at the end of October 2025. That keeps scope open for higher levels over time. Taking a Fibonacci retracement of the entire decline from the 2023 high, the next resistance sits at 825 (38.2%), with our medium-term upside objective at the 50% retracement, 928.
This is for educational and informational purposes only and does not constitute investment or trading advice. Always do your own research and consider your own risk tolerance before making any trading or investment decisions.
Grain Under Fire: What Wheat Is (And Isn't) Pricing InWheat has surged 30.8% since June 30, breaking out to trade above its May 2024 high for the first time. Following an initial rally in July, prices spent most of August consolidating. A sharp single-session spike late in the month reignited the upward trend, driven by escalating Black Sea disruption layered on an already tight U.S. supply picture, the smallest wheat crop since 1972 after severe Plains drought.
In the 2024/25 marketing year, Russia and Ukraine together accounted for roughly 30% of global wheat exports, according to the USDA. This concentration is why the mechanism works: when that much supply goes offline, suppliers and buyers both need time to adjust, so prices move globally before any single buyer can actually switch sources.
The Escalation
Since early July, Ukraine and Russia have waged a weeks-long campaign against each other's grain export infrastructure. A Ukrainian drone campaign shut down the Sea of Azov in mid-July, a route that typically carries roughly a quarter of Russia's grain exports even as Russia retaliated with strikes on Ukraine's own port infrastructure.
That mutual escalation culminated on August 12, when Ukraine attacked Russia's port of Novorossiysk, disabling terminals that together handle over half of Russia's wheat export capacity. The impact was severe enough that the USDA revised its official export forecasts downward for both countries that same day. Meanwhile, Ukraine's own wheat exports have lagged significantly, running about 15% behind the previous year's pace through mid-August.
Why This Time Is Different
Physical destruction of export infrastructure is not new to this conflict. Russia has struck Ukraine's ports repeatedly since exiting the Black Sea Grain Initiative in 2023, damaging hundreds of facilities over three years- damage the market has already absorbed as background noise. What changed in August is the target: Russia's own terminals had gone largely untouched until Ukraine demonstrated the capability and willingness to physically destroy Russia's core export capacity at Novorossiysk and Taman. That shift, not the scale of any single strike, is what the market is still trying to price.
This asymmetry cuts both ways. Attacks on Russian export hubs are unprecedented, so continued targeting would likely mean further repricing, not the desensitisation seen with Ukrainian ports. And de-escalation cannot fast-track physical repairs: with NKHP, one of the damaged Novorossiysk terminals, estimating fix times of up to four months, physical bottlenecks will outlast diplomatic headlines, creating a floor under prices that won't collapse as quickly as a lifted blockade would.
Not Priced Like 2022 — Yet
So far, though, the market hasn't priced in the scenario laid out above.
Wheat's price action still looks nothing like 2022. The current rally has taken futures from $5.74 to $7.51, which is a real move, but well short of 2022's spike to $13.63. It's slower too: this year's gain took about eight weeks, against 2022's 75%-plus move in a single month.
Source: CME CVOL
Volatility tells the same story. Wheat's CVOL spiked to nearly 100 after the 2022 invasion, an isolated, unprecedented move. Current CVOL sits in the low 40s, elevated but in line with smaller, recurring escalation spikes seen since 2022.
Positioning shows the same restraint: as of August 18, managed money held a modest net short of roughly 25,000 contracts, and the latest week's improvement came from short-covering instead of fresh buying. But that data predates the sharp August 26 spike, showing hesitancy heading in without revealing what actually drove the move that followed.
Source: CME QuikStrike
Options markets show a similar lean toward calls. The put/call ratio sits at 0.70, and that skew is even sharper in recent trading, where it drops to 0.45. Most of that call positioning is concentrated in December 2026 wheat rather than spread across the curve. This doesn't confirm a shortage is coming, but it does show the market leaning defensively toward more upside. The price chart itself carries its own signals too.
Technical Signals
RSI sits at 77.8 in overbought territory. It reached a fresh high alongside price, meaning there is no bearish divergence to warn of an immediate reversal. Meanwhile, the MACD indicator recently turned bullish, with the histogram expanding once again. Together, these indicators describe a strong trend that has simply outrun itself short-term, favouring a pause or partial pullback before resuming, not a reversal.
Bottom Line
Taken together, this looks like a market pricing real, elevated risk rather than confirming an actual shortage. Price, volatility, and positioning all sit well short of 2022 levels, and buyers are still choosing $215/ton Russian wheat over the pricier U.S. option . The Novorossiysk strikes still give this repricing a stronger basis than past false alarms. But whether this becomes a genuine supply shock will be settled by shipment and export-sales data in the coming weeks, not by further headlines.
For a sense of how a comparable Black Sea shock has traded out before, here's how that 2022 episode would have played as a trade.
Historical Trade Setup
Black Sea Invasion Shock — Spring 2022
Russia's invasion of Ukraine on February 24, 2022, led to a naval blockade of Ukraine's Black Sea ports, disrupting one of the world's largest wheat-exporting regions. Global wheat prices spiked sharply in the weeks that followed, before easing well ahead of the Black Sea Grain Initiative, signed on July 22, 2022, which restored Ukrainian exports through a safe maritime corridor.
CME Micro Wheat futures (MZW) were not available in 2022 and were launched later. The trade below uses micro contract sizing for illustration.
How a Long CME Micro Wheat (MZW) Position Would Have Performed
Entry: 934.80 (USc/bu), close, February 24, 2022
Exit: 1,286.50 (USc/bu), close, March 8, 2022
Move: 1,286.50 − 934.80 = 351.70 → 351.70 / 934.80 = +37.62%
Gross Profit: (1,286.50 − 934.80) × 500 / 100 = USD 1,758.50
This content is sponsored.
MARKET DATA
CME Real-time Market Data helps identify trading setups and more effectively express market views. If you have futures in your trading portfolio, you can check out on CME Group data plans available that suit your trading needs at tradingview.com/cme .
DISCLAIMER
This case study is for educational purposes only and does not constitute investment recommendations or advice. Nor are they used to promote any specific products, or services.
Trading or investment ideas cited here are for illustration only, as an integral part of a case study to demonstrate the fundamental concepts in risk management or trading under the market scenarios being discussed.
Can Wheat Futures Trigger a Global Crisis?Geopolitics, Geostrategy, and Macroeconomics
Chicago wheat futures recently surged to three-year highs near $7.70 per bushel. Intensifying warfare in the Black Sea region directly threatens critical grain export terminals. Russia and Ukraine historically supply over twenty-five percent of global wheat exports. Port disruptions force nations across the Middle East and Africa to seek expensive alternative supplies. Macroeconomic food inflation now looms heavily over developing nations facing high import costs. Sovereign food security rapidly becomes a central geopolitical weapon in modern conflict zones.
Importers like Egypt now divert contracts toward European and American grain suppliers. Longer maritime shipping routes sharply elevate freight rates and overall import expenditures worldwide. Governments actively build strategic grain reserves to cushion against prospective supply chain collapses. Geostrategic alliances increasingly dictate international trade agreements and cross-border grain allocation strategies.
Industry Trends, Economics, and Business Models
Commodity trading houses adapt their business models to navigate extreme price volatility continuously. Firms like Cargill, Bunge, and ADM restructure physical supply lines across continents. Surging corn futures exacerbate the rally as feed compounders substitute grain inputs dynamically. Tightening European inventories further compress global supply balances across major export markets. Market participants leverage complex derivative contracts to lock in operational profit margins.
Physical grain cash markets reflect historical premiums over paper derivative contracts today. Regional elevators adjust cash basis levels to incentivize domestic farmer grain movement. High capital requirements force smaller agricultural intermediaries to consolidate under mega-cap conglomerates. Financial institutions structure dynamic hedging portfolios to manage systemic agricultural commodity risks.
High-Tech Innovation, Science, and Patent Analysis
Modern agribusiness relies heavily on artificial intelligence and satellite remote sensing tools. Computational climate models evaluate soil moisture levels and crop condition ratings daily. Scientists pioneer gene-edited wheat varieties to resist severe drought and emerging pathogens. Patent analysis reveals accelerated filings for climate-resilient seed traits globally. Major ag-tech corporations aggressively defend proprietary genetic codes to secure future market dominance.
Autonomous harvesting equipment and field sensors optimize crop yields at minimal operational cost. High-tech biotechnology platforms accelerate the development of stress-tolerant crop varieties rapidly. Precision agriculture tools allow farmers to apply fertilizer with micro-level targeting efficiency. Science continuously redefines global yield potential despite escalating climate challenges.
Cybersecurity, Leadership, and Pharma Parallels
Agricultural supply networks face growing cybersecurity threats from sophisticated nation-state hackers. Digital grain trading platforms and automated port operations represent primary targets for disruption. Corporate leadership mandates stringent cyber defenses to protect critical supply chain data infrastructure. Executive management teams prioritize risk mitigation while maintaining seamless physical logistics operations. Strong leadership aligns operational resilience directly with enterprise risk management goals.
Interestingly, wheat starch plays a vital role within the modern pharmaceutical industry. Drug manufacturers utilize specialized wheat derivatives as essential binders in oral pill production. Supply disruptions in agricultural markets directly impact pharmaceutical manufacturing costs worldwide. Cross-industry dependencies highlight the far-reaching economic consequences of agricultural market shocks.
ZW1! 1H: Descending Channel Breakout & Resistance Reclaim1. Market Context
On the 1H chart, Wheat Futures (ZW1!) broke out above the purple descending channel. Price bounced strongly off the "Buyer" base and is currently pressing against the key horizontal resistance at 656'2.
2. Trader Behavior & House Trap Analysis
• Where Traders Place Orders: Seeing the horizontal resistance ceiling at 656'2, retail traders are opening SELL orders (marked "Seller"), expecting price to reject and fall back toward 627'4.
• Trader Stop-Loss & Target: Shorters are placing their Stop-Loss orders immediately above 656'2 (around 660'0 – 666'0), targeting a drop back to the lower support levels.
• How the House Plays It: The House engineered the purple channel breakout to wipe out early shorters. As retail crowds into sell orders at 656'2, the House will push price above resistance to trigger their stop-losses up to 666'0. A retest back to 656'2 will trap late shorters before launching a rally straight toward 685'4.
3. Trade Setup
• Entry: 656'2 (Confirmed 1H close and retest above horizontal resistance)
• Stop Loss (SL): 644'0 (Placed safely below the "Buyer" breakout base)
• Take Profit 1 (TP1): 666'0
• Take Profit 2 (TP2): 685'4
• Risk-to-Reward Ratio (R:R): Approx 2.4:1 (Calculated toward TP2)
Buying a Triple Bottom - Action-Reaction System
For the Action-Reaction System, double bottoms and double tops are treated as true support and resistance. Whether prices have a tendency to break that structure at some point is irrelevant to the problem of what the current trend is. The current trend may be moving away from them or moving to them, but they are just treated as another pivot of an action-reaction set. They don't change the probabilities, or if they do, what really matters is the output of thousands of cases. So when this structure of a triple/quadruple bottom is formed, the numbers stay the same since they are defined by the generality. At the end of the day, it is about isolating the noise, focusing on the hard numbers, managing the risk and trading the mathematics.
ZW Long — Supply-threatening weather and geopolitical shocks areWheat offers an attractive 2.24R pullback long, bolstered by fresh geopolitical and weather-related catalysts threatening global supply. Although the 4h trend is carving out constructive higher highs and higher lows, the immediate 1h momentum trigger is still developing. The fundamental backdrop makes this highly compelling, keeping it on high alert to take once shorter-term momentum confirms.
📍 Entry: 667.25
🛑 Stop: 656.00
🎯 Target: 692.25
⚖️ R:R: 2.22
Food as an Inflation Hedge AssetWhat has been moving that many are not aware of?
Food prices.
According to the CME Group Agriculture report, year-to-date performance for grains and oilseeds has been appreciating. Grains like rice, which we eat, and wheat, used for bread, are up by 25% and 14%, respectively. Meanwhile, soybeans, soybean oil, and soybean meal—which are used for cooking, biodiesel, and animal feed—are up by 37%, 4%, and 1%.
Chicago SRW Wheat Futures & Options
Ticker: ZW
Minimum fluctuation:
1/4 of one cent (0.0025) per bushel = $12.50
Disclaimer:
• What presented here is not a recommendation, please consult your licensed broker.
• Our mission is to create lateral thinking skills for every investor and trader, knowing when to take a calculated risk with market uncertainty and a bolder risk when opportunity arises.
CME Real-time Market Data help identify trading set-ups in real-time and express my market views. If you have futures in your trading portfolio, you can check out on CME Group data plans available that suit your trading needs www.tradingview.com
Wheat Futures +13.10% in 15 days .....Wheat Futures COT positioning
This is a significant shift from the prior analysis. Managed Money is now buying (+4,617 longs, -2,512 shorts) rather than the aggressive selling seen last time. Large Specs also trimmed shorts (-3,579) while adding modest longs (+1,695). Producer/Merchant longs fell slightly (-2,100) while their shorts rose (+4,233) — commercials are now adding hedges at these levels, the mirror image of what they were doing below 607. COT Index has pulled back from 63.1% to 57.4% (6mo) and 46.7% (36mo), still mid-range — not at an extreme that would force a large short-covering squeeze but also not crowded long enough to fear a collapse. The spec community is increasingly positioned in the direction of the move, which is normal for a trend but reduces the potential for further short-covering fuel above current levels. USDA Crop Progress
US total wheat production is forecast to fall to 41.81 million tons — the lowest since 1970 — down from 54.01 million tons last year, driven by a reduction in sown area (15.07M ha to 12.98M ha) and a decline in yield (35.8 c/ha to 32.2 c/ha). Winter wheat production is now estimated below the previous figure at 990 million bushels; ending stocks for 2026-27 are projected at 722 million bushels — a tight balance sheet. HRW crop condition ratings remain among the lowest in over 30 years. Spring wheat rated 58% G/E as of July 12 (+1pt week-on-week), headed 72% vs 54% prior week. Spring wheat improving slightly but winter wheat (the price-setting crop) remains structurally compromised — net bullish supply backdrop for the medium term. Trade location & invalidation levels
Short/fade: Best location is 667-688 (Premium zone into Weak High), looking for the liquidity sweep of 688.2 to fail and reverse. Invalidation: daily close above 688.2 with momentum (would confirm extension toward 720-777). Tight stop given how fast these Iran-war reversal moves can be.
Long/continuation: Only on a pullback to 638.2 (weekly POC) with a daily close confirming hold, targeting re-test of 667-688. Invalidation: close below 622 (prior BOS level, would compromise the bullish SMC structure). The 4H FOMO signal argues against chasing at 664 — wait for the pullback.
Do not chase at current levels — the KMCM 4H Velocity/Volume + FOMO readings (Velocity 17, Volume 94) indicate the immediate move is overextended on a 4-hour basis. The daily reading is Neutral/Balanced (Velocity 19, Volume 110), which means the trend is intact on daily but the entry timing is poor right now.
Probability ranking:
Bearish pullback / FOMO unwind toward 638.2-616 (50%): KMCM 4H FOMO/Overheated + short-term WEAT outflows + producer commercial hedging added at these levels + price deep inside Premium zone + real yields at 2.356% = elevated mean-reversion risk. The setup for a pullback is technically well-defined even if the fundamental trend remains bullish.
Range/consolidation 640-670 pending PPI and Iran clarity (30%): Market awaits the PPI print and any Iran ceasefire/escalation headline before committing to the next directional move; consistent with the daily KMCM Neutral/Balanced regime.
Bullish extension through 688 → 720+ (20%): Requires a simultaneous soft PPI + fresh Iran escalation catalyst. Possible given the war-premium dynamic is very headline-sensitive, but the technical risk/reward at 664 chasing into 688 is poor given the FOMO signal and Weak High designation.
Phase transition Nothing here is advice. I'm a trader publishing his own homework and I get things wrong in public on a regular basis. The arrays and the reversals are Martin Armstrong's, via Socrates. The reading of them, and the execution rules I trade against them, are mine - and so are the errors.
Why Is the Global Wheat Market Surging?Wheat futures are experiencing a violent upward rally today. The recent July WASDE report triggered panic buying across commodity desks. Global wheat production is officially falling below total consumption. Russia just reinstated its controversial wheat export tax. Meanwhile, maritime drone strikes continue to choke vital Black Sea transit routes. Investors must look beyond the surface of this massive agricultural shockwave. Let us dissect the multi-layered drivers reshaping global wheat markets today.
Geopolitics and Geostrategy
Food security remains the ultimate weapon of modern geopolitical statecraft. Ukraine recently deployed sophisticated maritime drones near major Russian grain straits. This strategic move instantly choked vessel traffic and panicked global shipping lines. Concurrently, Russia weaponized its market dominance by reinstating floating export taxes. By artificially elevating international prices, Moscow controls the global low-cost food supply. Meanwhile, China actively hoards domestic stockpiles while restricting Western grain inflows. These aggressive geostrategic moves establish agricultural control as a core pillar of modern warfare.
Macroeconomics and Economics
The latest USDA reports fundamentally shattered previous bearish market assumptions. Forecasters slashed U.S. new-crop wheat ending stocks down to 722 million bushels. Globally, the agency projects total wheat production at 820 million tonnes. This tight supply faces an expanding global demand of 824.5 million tonnes. Structural deficits naturally fuel massive speculative capital inflows from hedge funds. This supply-demand mismatch guarantees persistent inflationary pressures across developing nations. Consequently, central banks face prolonged food-driven inflation threats well into next year.
Industry Trends and Business Mode ls
Agricultural supply chains are completely overhauling their traditional logistics models. Global agribusinesses are abandoning just-in-time inventory strategies entirely. Instead, they embrace heavy regional storage and localized sourcing networks. Modern grain trading desks utilize dynamic hedging models to neutralize severe price volatility. Agribusiness companies must adapt their business models to survive sudden export tax shocks. Firms that fail to secure diverse alternative origins face swift financial ruin. Resilience now takes absolute priority over short-term cost minimization.
Management, Leadership, and Culture
Navigating volatile commodity spikes requires highly decentralized corporate leadership. Rigid, slow-moving agricultural conglomerates fail instantly during fast-moving supply shocks. Forward-thinking executives actively foster agile, data-driven corporate cultures across trading teams. Leaders must empower regional managers to make immediate procurement decisions. Bureaucratic delays during a shipping crisis can cost trading firms millions. Progressive organizational culture values rapid adaptability over traditional, top-down hierarchy. Decisive leadership ultimately separates thriving market leaders from bankrupt laggards.
Technology and Cybersecurity
The global grain trade operates almost entirely on highly interconnected digital trading platforms. Automated electronic supply chains manage millions of tons of wheat transactions daily. This massive digital footprint creates an enticing target for state-sponsored cybercriminals. Rogue actors aggressively deploy ransomware against grain elevators and port control systems. A successful cyber attack on critical food logistics can paralyze regional supply chains instantly. Therefore, global agribusinesses must dramatically scale up their cybersecurity spending. Digital defense secures physical food survival.
Science, High-Tech, and Patent Analysis
Severe climate volatility forces agricultural science to accelerate rapidly. High-tech laboratories utilize gene-editing tools like CRISPR to engineer drought-resistant wheat varieties. Agro-tech corporations aggressively file patents for climate-resilient seed phenotypes. Patent analysis reveals a massive corporate arms race targeting heat-tolerant crop genomes. Furthermore, satellite imaging and machine learning algorithms predict crop yields with unprecedented precision. These scientific innovations shield multinational producers from catastrophic weather anomalies. Intellectual property in agriculture directly dictates future market dominance.
The Pharmaceutical Industry Connection
The pharmaceutical sector maintains a quiet but deep connection to global wheat markets. Modern drug manufacturers rely heavily on high-purity wheat starch as a primary binding excipient. Pharmaceutical factories process vast amounts of wheat derivatives to produce daily tablets and capsules. Additionally, medical research increasingly isolates specific wheat proteins for targeted immunotherapy applications. A prolonged global wheat shortage directly spikes production costs for essential medications. Therefore, major healthcare conglomerates closely monitor wheat futures to protect their manufacturing supply chains.
ZW Long — Wheat's pulling back but Black Sea risk and weather…Black Sea supply risks and weather premiums are providing a solid fundamental backdrop for this pullback long. Despite the broader bearish trend read, the 2.68R geometry and lack of extension offer a well-defined setup to play the geopolitical risk bid.
📍 Entry: 607.00
🛑 Stop: 599.50
🎯 Target: 627.00
⚖️ R:R: 2.67
Does Wheat Hold 585 or Is Lower Still on the Table?Bumper Harvest Progress Collides With Fading Geopolitical Risk
Wheat futures have spent the past month grinding lower as fresh harvest supply overwhelmed a market that had been pricing in tighter production. Prices slipped to around 570 to 571 cents per bushel in late June, the lowest level since March, as the advancing US winter wheat harvest reinforced expectations of ample near term supplies. Hard red winter wheat was reported 49% harvested versus just 11% a year earlier and a five year average of 19%, while soft red winter wheat reached 45% harvested, also well ahead of its historical pace. This rapid progress has partly offset the bullish acreage story from USDA's June Wheat Outlook, which projected 2026/27 winter wheat production down 27% year over year to 1,030 million bushels, the smallest crop since 1965/66, with hard red winter output pegged at 497 million bushels, the lowest since 1957/58, largely due to persistent drought across the Great Plains.
On the geopolitical side, the US and Iran signed an interim memorandum of understanding in mid June that ended active hostilities, set a 60 day window for reopening the Strait of Hormuz to commercial shipping, and outlined a path toward sanctions relief, while leaving the detailed terms of Iran's nuclear program to be negotiated separately within that window. This eased fertilizer and shipping risk that had been supporting wheat prices. That news also pushed European wheat futures in Paris below the 200 euro mark, their lowest level in weeks. It is worth noting that this arrangement remains an interim framework rather than a final deal, and recent reports point to continued disagreement between Washington and Tehran over its scope, so this is better viewed as a reduction in acute risk rather than a fully resolved situation.
Export demand has been choppy as well, with the week ending June 18 showing sales nearly double the prior year's pace, only for the week ending June 25 to fall to the lowest total of the new marketing year. Slower farmer selling and concerns over European wheat production following a recent heatwave have helped cushion the downside somewhat. Traders should keep an eye on the upcoming USDA Grain Stocks report, continued harvest pace data, and any developments in the ongoing US Iran negotiating window, since these will likely determine whether prices stabilize here or extend the slide.
What did the Market do?
Towards the end of February, the market broke above 588 (daily level 3), imbalancing out of a multi-month consolidation range that had held from September through January 2026.
The market then auctioned two-way, forming an auction block between 635 and 588.
By the end of April, the market broke out above the 635 area (March and April CVAH), then retraced back to the middle of the auction block, where buyers stepped up bids.
That buying pushed price higher into the 700 area (daily level 1, February 2025 VAH), forming a sequence of higher highs and higher lows.
Responsive sellers stepped in at the 700 area, sending prices lower back into the auction block and breaking below 620 (daily level 2), which ended the bullish structure of higher highs and higher lows.
More recently, sellers have stepped their offers down to 620 (daily level 2, June VAH) and price is now testing the 585 area (daily level 3, Jun VAL).
What to Expect in the Coming Weeks?
The key level to watch remains the 585 area (daily level 3, June VAL).
Neutral Scenario
If buyers continue to defend the 585 area and sellers defend 620 (daily level 2, June VAH), expect continued two way auction within June's value area.
A possible trigger for this range bound scenario would be a mixed USDA Grain Stocks report that neither confirms nor challenges current harvest pace assumptions.
Bearish Scenario
If buyers fail to hold 585, expect a move down toward the 560 area, the mid point of the prior consolidation range.
If buyers also fail to defend 560, expect a move down to the 533 area (daily level 4), which also marks the low of the consolidation range.
A possible trigger here would be confirmation of continued rapid harvest progress alongside weak export sales, reinforcing the ample supply narrative.
Bullish Scenario
If buyers break and accept above 620 (daily level 2, June VAH), expect a move up toward the 650 area (May HVN).
A possible trigger here would be renewed weather stress in European or US growing regions, or a setback in the fragile 60 day Hormuz safe passage arrangement under the MOU, since Iran has disputed parts of the deal's scope and the free passage window is temporary rather than permanent.
Conclusion
From a technical standpoint, wheat is sitting at a pivotal decision point at the 585 area, with the broader structure still range-bound between the 533 and 700 levels that have defined trading since last year. From a fundamental standpoint, the market remains caught between a genuinely smaller winter wheat crop, the smallest since the late 1950s and 1960s by USDA's own estimates, and a harvest that is arriving unusually fast, alongside a Middle East backdrop that has de-escalated following the interim US Iran memorandum of understanding, though that arrangement is still only a 60 day framework rather than a resolved situation. Whether 585 turns into a buying opportunity or a trapdoor to lower prices will likely hinge on which of these forces, tightening supply fundamentals or the durability of the harvest and geopolitical calm, wins out in the coming weeks. Where do you see wheat heading from here, and are you positioned for a breakout or a breakdown?
Disclaimer: Past performance is not necessarily indicative of future results. Trading futures involves substantial risk of loss and is not appropriate for all investors. This content is intended for informational and educational purposes only and does not constitute trading advice or a solicitation to buy or sell any futures contract. Trade your own plan and manage risk.
Acronyms:
C - Composite
w - Weekly
m - Monthly
VA - Value Area
VAH - Value Area High
VAL - Value Area Low
VPOC - Volume Point of Control
LVN - Low Value Node
LVA - Low Value Area
HVN - High Value Node
HVA - High Value Area
SP - Single print
ATH - All time high
Who Controls Wheat: Weather Scares or Supply?Wheat is caught between opposing forces, and right now the bearish side is winning. A record-breaking European heatwave pushed French milling wheat to a three-month high near €211 a tonne, its strongest since mid-March, on fears of crop stress in the EU's largest producer. Yet the global benchmark is falling. CBOT wheat dropped below $5.80, its lowest since April 10, as the US winter-wheat harvest races ahead at 49% complete versus 11% a year ago. Ample supply is overpowering the weather scare.
The reason is comfortable global inventories. Record stocks and strong Black Sea production have left the market largely desensitized to bullish headlines, from the European heat to a developing El Niño to renewed Russia-Ukraine strikes. Russian wheat remains the world's price-setter, and major buyers like Egypt and Turkey are importing less as their own harvests improve. Even Kazakhstan's new six-month ban on most wheat imports, aimed at cheap Russian grain, is a localized protectionist signal rather than a global price driver. When inventories are full, weather and politics struggle to move the needle.
That said, the bullish risks are real, just not yet decisive. The European heat is genuine, but with the crop largely past flowering, the damage skews toward quality and test weights more than outright production, and corn is the more vulnerable victim. The bigger danger is cumulative. A 2003-style EU yield loss of roughly 9% to 10%, if it materialized, would tighten world stocks-to-use toward levels not seen since 2013. And a developing El Niño threatens the 2026/27 crop, which is why some analysts see the next meaningful rally arriving in 2027 rather than now.
The honest read is that the well-supplied exporters, not the weather headlines, control the breadbasket today. Near-term, the fast US harvest, record global stocks, and dominant Black Sea supply keep prices pressured, even as Europe bakes and nations hoard grain. The bullish case is a story for later. If the European heat cuts deeper than feared, or if El Niño damages the next crop, the market's current complacency could reverse sharply. For traders, the signals to watch are EU yield confirmations from FranceAgriMer, the pace of the US harvest, and Black Sea export flows. For now, ample supply wins, and the rally waits.
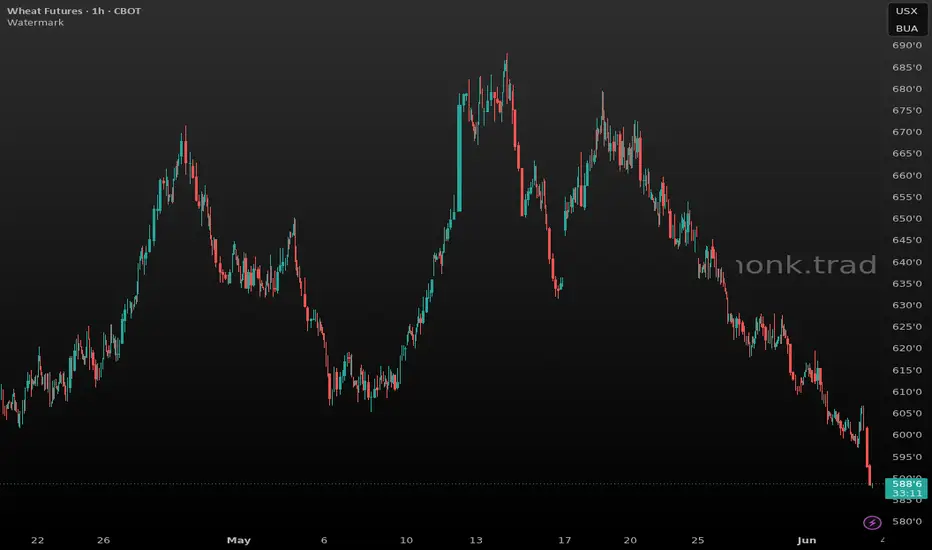
ZW Short — ZW short only on a retest of 589.50 after the 590 floZW remains in a higher-timeframe downtrend: the mid-June bounce stalled well below the May highs, then price rolled back under the 600 area and is now pressing through the repeatedly defended 586–590 support band. That support is the actionable level; once lost, it becomes the underside to sell rather than a spot to chase lower.
The 1h chart triggered with a heavy-volume break below 590 and a close near the low. The cleaner entry is a retest into 589.50, with the stop above the broken shelf and recent hourly rejection area at 593.25. The first downside objective is just ahead of the prior 581.5–583 support shelf; a sustained reclaim of 593.25 would negate the breakdown.
The backdrop is mixed but does not fight the short. Fair U.S. crop weather and commentary around ample global supplies lean bearish, while the smaller U.S. winter wheat crop, lower new-crop U.S. carryout, and stronger-than-expected new-crop export sales are offsetting risks that keep conviction from being higher.
📍 Entry: 589.50
🛑 Stop: 593.25
🎯 Target: 582.50
⚖️ R:R: 1.87
GRAINS Markets ....What`s coming !!!!!Today's macro backdrop — why wheat decoupled from the dollar
The dominant force right now isn't Fed policy, it's the Iran war energy/fertilizer shock. Crude oil has been supporting the grain complex amid uncertainty around the Iran war, with traders noting the correlation between crude and corn/wheat running close to 90%, and research shows that in past episodes where crude rallied 4%+, wheat and soybean oil showed the strongest co-movement in the ag complex. More structurally, nitrogen fertilizer prices are projected to roughly double from 2024 levels, with Asian nations highly dependent on Middle Eastern urea, sulfur and ammonia exports now facing supply constraints during the Northern Hemisphere planting season — that's a direct hit to wheat input costs and yield potential, independent of the dollar. This explains why a hawkish Fed and stronger DXY didn't translate into wheat weakness today: energy/input-cost-push fundamentals are currently overriding macro-driven dollar strength. Trading Economics + 2
Bullish scenario (war-premium dominant): Crude stays bid on Strait of Hormuz risk, fertilizer scarcity narrative intensifies, fund/index flow continues rotating into undervalued grains as a crude proxy. Wheat pushes through 622.2 (PDH) and 630.2 single print toward the poor high/low at 638.2, with 650+ in play if energy keeps climbing.
Bearish scenario (dollar/macro reasserts): The Fed's hawkish repricing eventually drags broader commodities lower as it did to gold, DXY continues higher, real yields keep climbing toward 2.25%+, and the war-premium narrative cools (e.g., diplomatic de-escalation headlines, which historically have hit grains hard and fast). Wheat fades back below 605.2/605.6 (PML/weekly POC cluster) toward 593.0 and 586.0.
DXY & real yield implications: Both metrics moved firmly hawkish (DXY 99.63→100.71, real yield 2.121%→2.20%), which is the textbook bearish commodity input — but wheat ignored it today, telling you the energy/fertilizer story currently has more weight in price discovery than the rates story. Watch this relationship closely: if it normalizes (dollar strength starts pressuring wheat again), that's a signal the war premium is fading.
WHEAT FUTURES Up Date....Wheat Futures Institutional Analysis — 18 June 2026
This week's development is constructive for the bullish thesis.
The most important observation is:
Wheat is trading 620.0 while DXY has risen to 100.71 and Real Yields remain elevated at 2.20%.
Normally that combination should pressure grains.
Instead Wheat has:
-Reclaimed Monthly Low (605.2)
-Reclaimed Weekly POC (605.6)
-Reclaimed Previous Weekly High (600.2)
-Traded into the 620 resistance area
That is relative strength.
Trade Location Current: 620
This is no longer discount....This is early markup territory.
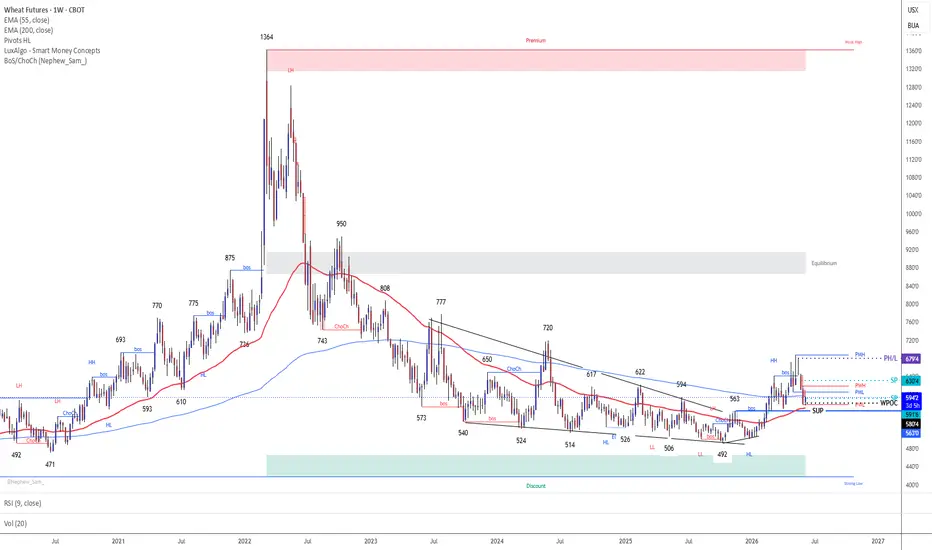
Support : 605.6 (Weekly POC) / 596 (Weekly 200 EMA) / 593 (Poor Low) / 570 (Weekly 55 EMA)
Resistance: 628–634 Then: 679–688
Invalidation for the bullish thesis:
Weekly Close Below 593 .....First warning.
Weekly Close Below 563 Major invalidation.
That would significantly weaken the Wave C completion argument. The most important development this week is not the move to 620 itself.
It's that Wheat has: reclaimed both Weekly POCs (586 and 605.6), held above the Weekly 200 EMA and is attacking the 628–634 inefficiency zone ....while DXY trades above 100.7.
That behavior is increasingly consistent with a market that may have already completed its corrective phase at 571 and is now attempting to transition into a new markup leg. The next battle is clearly 628–634; a successful auction through that zone would materially increase the odds of a return toward 679–688.
WHEAT FUTURES Up Date....Institutional View
The most important development this week is not the price rally from 571.
It is that:
Managed Money is now extremely short
Commercials are aggressively long
Wheat has reclaimed:
Weekly POC (586)
Monthly Low (605)
Weekly High (600)
while sitting directly above:
Weekly 55 EMA (570)
Weekly 200 EMA (596)
That combination is much more consistent with a completed Wave C / Wyckoff Spring than with the start of a new bearish leg.
The next major battleground is 628–634. If Wheat can auction through that zone, the probability of a move back toward 679–688 rises substantially.
Trade Location
Current price: 607
This is no longer deep discount.....This is early recovery.
Best Support
596 (Weekly 200 EMA)
586 (Previous Weekly POC)
580
Resistance
620
628
631
634
688
Invalidation : Weekly Close Below 563
Spring thesis
Elliott Wave C completion thesis and reopen:
520
500 Final Institutional View
567Educational content describing how the Armstrong reversal system and Erwin’s execution framework resolve a specific market setup. Not financial advice. Trading involves substantial risk of loss. The methodology does not eliminate risk or guarantee outcomes. Confirm all triggers on a closing basis. Trade only what you can afford to lose.
WHEAT FUTURES Up Date....WHEAT FUTURES – Institutional Macro, COT, Elliott, Wyckoff & Liquidity Analysis
Executive Summary
Wheat at 590.4 is now sitting in one of the most important zones seen since the 2022 peak at 1364.
What's changed versus last week:
-Commercials dramatically increased longs (+13,907)
-Commercials aggressively reduced shorts (-17,842)
-Specs liquidated longs heavily
-Managed Money dumped longs (-25,555) and added shorts (+12,931)
-Price is now testing the confluence of:
Weekly POC (580)
Weekly 55 EMA (569)
Weekly structure support
Elliott Wave termination zone
This is beginning to look more like capitulation than the beginning of a fresh bear market. Probability
Scenario 1
Commercial accumulation + Wave C completion + Spring
Target:
603 → 620 → 630 → 679
Scenario 2
Final liquidity sweep into 569–563 before reversal
Target:
563 then reversal higher.
Scenario 3
Full bearish continuation
Requires:
DXY >100.5
Real Yield >2.35%
Weekly close below 563
Crop conditions improving materially
ZW Short — ZW bear trend stays intact below the broken 598-600 sHTF structure is firmly bearish with price well below declining averages and pressing fresh swing lows. The LTF confirmed downside with a high-volume flush through the 598-600 shelf; rather than chase at the low, the cleaner trade is a short on a retest of the breakdown area near 592.75. A reclaim above 597.5 would put price back inside the prior range and invalidate the immediate bear continuation. Target is the next HTF support zone near 580.5 from the prior base.
📍 Entry: 592.75
🛑 Stop: 597.50
🎯 Target: 580.50
⚖️ R:R: 2.58