CBOT Wheat — Pullback Holds Support, Next Leg Higher in FocusWheat continues to behave beautifully from a technical standpoint.
We recently saw price fail almost exactly at the Fibonacci extension at 792. Since then, the pullback has retraced straight back to the first level of support at 711 — the July 2026 high — and that prior resistance is now acting as support. That's about as clean as technical structure gets.
This looks like the correction lower we were anticipating. A deeper pullback toward 688 (the May 2026 high) can't be ruled out, but as thin
In-depth trading ideas
Incremental analysis of wheatWheat remains structurally bullish.
Strong liquidity inflows, highlighted by the rising volume profile, support further upside toward the previous record high. Renewed Black Sea disruptions, Russia–Ukraine tensions, tighter U.S. wheat supply, and adverse weather risks are reinforcing the bullish fundamental backdrop.
Sasha Charkhchian
COT 101 · Lesson 05 — Net Positioning Extremes🔵 WHAT "EXTREME" MEANS
A net position is extreme when it sits at the edge of its own history — the highest or lowest reading in 6, 12, or 24 months. Not "high", not "low": the outer band of what this market has actually seen. The next lesson gives this a precise number.
🔵 WHY WHEAT
The earlier lessons in this series used gold; this one switches to wheat. Not for variety — because this method is at its cleanest in agriculture. In physical grain markets the commercials are genuine hedgers: f
Chart of the Week: CBOT Wheat FuturesWheat has been one of the standout movers of 2026, trending sharply higher for most of the year — and the past six weeks have brought a marked acceleration to the upside.
Notably, this week's high landed almost exactly on one of our Fibonacci extensions at 792/bushel — the 1.618 extension of the move from the January low to the early March peak, projected from the mid-April low. Some consolidation around this resistance wouldn't surprise us, but on any pullback we'd expect support to hold well
Grain Under Fire: What Wheat Is (And Isn't) Pricing InWheat has surged 30.8% since June 30, breaking out to trade above its May 2024 high for the first time. Following an initial rally in July, prices spent most of August consolidating. A sharp single-session spike late in the month reignited the upward trend, driven by escalating Black Sea disruption layered on an already tight U.S. supply picture, the smallest wheat crop since 1972 after severe Plains drought.
In the 2024/25 marketing year, Russia and Ukraine together accounted for roughly 30
Can Wheat Futures Trigger a Global Crisis?Geopolitics, Geostrategy, and Macroeconomics
Chicago wheat futures recently surged to three-year highs near $7.70 per bushel. Intensifying warfare in the Black Sea region directly threatens critical grain export terminals. Russia and Ukraine historically supply over twenty-five percent of global wheat exports. Port disruptions force nations across the Middle East and Africa to seek expensive alternative supplies. Macroeconomic food inflation now looms heavily over developing nations facing high
ZW1! 1H: Descending Channel Breakout & Resistance Reclaim1. Market Context
On the 1H chart, Wheat Futures (ZW1!) broke out above the purple descending channel. Price bounced strongly off the "Buyer" base and is currently pressing against the key horizontal resistance at 656'2.
2. Trader Behavior & House Trap Analysis
• Where Traders Place Orders: Seeing the horizontal resistance ceiling at 656'2, retail traders are opening SELL orders (marked "Seller"), expecting price to reject and fall back toward 627'4.
• Trader Stop-Loss & Target: Shorters are pl
Buying a Triple Bottom - Action-Reaction System
For the Action-Reaction System, double bottoms and double tops are treated as true support and resistance. Whether prices have a tendency to break that structure at some point is irrelevant to the problem of what the current trend is. The current trend may be moving away from them or moving to them, but they are just treated as another pivot of an action-reaction set. They don't change the probabilities, or if they do, what really matters is the output of thousands of cases. So when this struct
ZW Long — Supply-threatening weather and geopolitical shocks areWheat offers an attractive 2.24R pullback long, bolstered by fresh geopolitical and weather-related catalysts threatening global supply. Although the 4h trend is carving out constructive higher highs and higher lows, the immediate 1h momentum trigger is still developing. The fundamental backdrop makes this highly compelling, keeping it on high alert to take once shorter-term momentum confirms.
📍 Entry: 667.25
🛑 Stop: 656.00
🎯 Target: 692.25
⚖️ R:R: 2.22
Food as an Inflation Hedge AssetWhat has been moving that many are not aware of?
Food prices.
According to the CME Group Agriculture report, year-to-date performance for grains and oilseeds has been appreciating. Grains like rice, which we eat, and wheat, used for bread, are up by 25% and 14%, respectively. Meanwhile, soybeans, soybean oil, and soybean meal—which are used for cooking, biodiesel, and animal feed—are up by 37%, 4%, and 1%.
Chicago SRW Wheat Futures & Options
Ticker: ZW
Minimum fluctuation:
1/4 of one cent
Wheat Futures +13.10% in 15 days .....Wheat Futures COT positioning
This is a significant shift from the prior analysis. Managed Money is now buying (+4,617 longs, -2,512 shorts) rather than the aggressive selling seen last time. Large Specs also trimmed shorts (-3,579) while adding modest longs (+1,695). Producer/Merchant longs fell slightly (-2,100) while their shorts rose (+4,233) — commercials are now adding hedges at these levels, the mirror image of what they were doing below 607. COT Index has pulled back from 63.1% to 57.4%
Phase transition Nothing here is advice. I'm a trader publishing his own homework and I get things wrong in public on a regular basis. The arrays and the reversals are Martin Armstrong's, via Socrates. The reading of them, and the execution rules I trade against them, are mine - and so are the errors.
Why Is the Global Wheat Market Surging?Wheat futures are experiencing a violent upward rally today. The recent July WASDE report triggered panic buying across commodity desks. Global wheat production is officially falling below total consumption. Russia just reinstated its controversial wheat export tax. Meanwhile, maritime drone strikes continue to choke vital Black Sea transit routes. Investors must look beyond the surface of this massive agricultural shockwave. Let us dissect the multi-layered drivers reshaping global wheat market
ZW Long — Wheat's pulling back but Black Sea risk and weather…Black Sea supply risks and weather premiums are providing a solid fundamental backdrop for this pullback long. Despite the broader bearish trend read, the 2.68R geometry and lack of extension offer a well-defined setup to play the geopolitical risk bid.
📍 Entry: 607.00
🛑 Stop: 599.50
🎯 Target: 627.00
⚖️ R:R: 2.67
Does Wheat Hold 585 or Is Lower Still on the Table?Bumper Harvest Progress Collides With Fading Geopolitical Risk
Wheat futures have spent the past month grinding lower as fresh harvest supply overwhelmed a market that had been pricing in tighter production. Prices slipped to around 570 to 571 cents per bushel in late June, the lowest level since March, as the advancing US winter wheat harvest reinforced expectations of ample near term supplies. Hard red winter wheat was reported 49% harvested versus just 11% a year earlier and a five year ave
Who Controls Wheat: Weather Scares or Supply?Wheat is caught between opposing forces, and right now the bearish side is winning. A record-breaking European heatwave pushed French milling wheat to a three-month high near €211 a tonne, its strongest since mid-March, on fears of crop stress in the EU's largest producer. Yet the global benchmark is falling. CBOT wheat dropped below $5.80, its lowest since April 10, as the US winter-wheat harvest races ahead at 49% complete versus 11% a year ago. Ample supply is overpowering the weather scare.
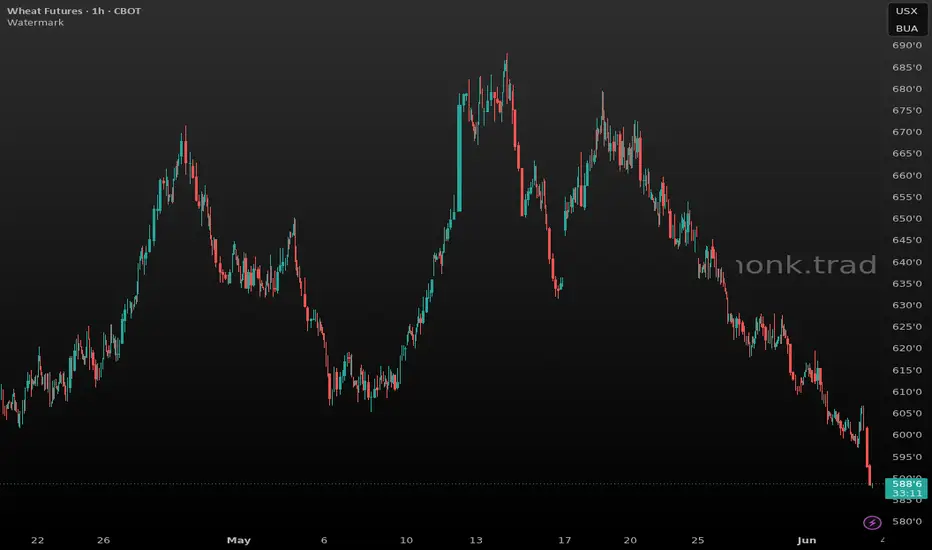
ZW Short — ZW short only on a retest of 589.50 after the 590 floZW remains in a higher-timeframe downtrend: the mid-June bounce stalled well below the May highs, then price rolled back under the 600 area and is now pressing through the repeatedly defended 586–590 support band. That support is the actionable level; once lost, it becomes the underside to sell rather than a spot to chase lower.
The 1h chart triggered with a heavy-volume break below 590 and a close near the low. The cleaner entry is a retest into 589.50, with the stop above the broken shelf and
GRAINS Markets ....What`s coming !!!!!Today's macro backdrop — why wheat decoupled from the dollar
The dominant force right now isn't Fed policy, it's the Iran war energy/fertilizer shock. Crude oil has been supporting the grain complex amid uncertainty around the Iran war, with traders noting the correlation between crude and corn/wheat running close to 90%, and research shows that in past episodes where crude rallied 4%+, wheat and soybean oil showed the strongest co-movement in the ag complex. More structurally, nitrogen fertiliz
WHEAT FUTURES Up Date....Wheat Futures Institutional Analysis — 18 June 2026
This week's development is constructive for the bullish thesis.
The most important observation is:
Wheat is trading 620.0 while DXY has risen to 100.71 and Real Yields remain elevated at 2.20%.
Normally that combination should pressure grains.
Instead Wheat has:
-Reclaimed Monthly Low (605.2)
-Reclaimed Weekly POC (605.6)
-Reclaimed Previous Weekly High (600.2)
-Traded into the 620 resistance area
That is relative strength.
WHEAT FUTURES Up Date....Institutional View
The most important development this week is not the price rally from 571.
It is that:
Managed Money is now extremely short
Commercials are aggressively long
Wheat has reclaimed:
Weekly POC (586)
Monthly Low (605)
Weekly High (600)
while sitting directly above:
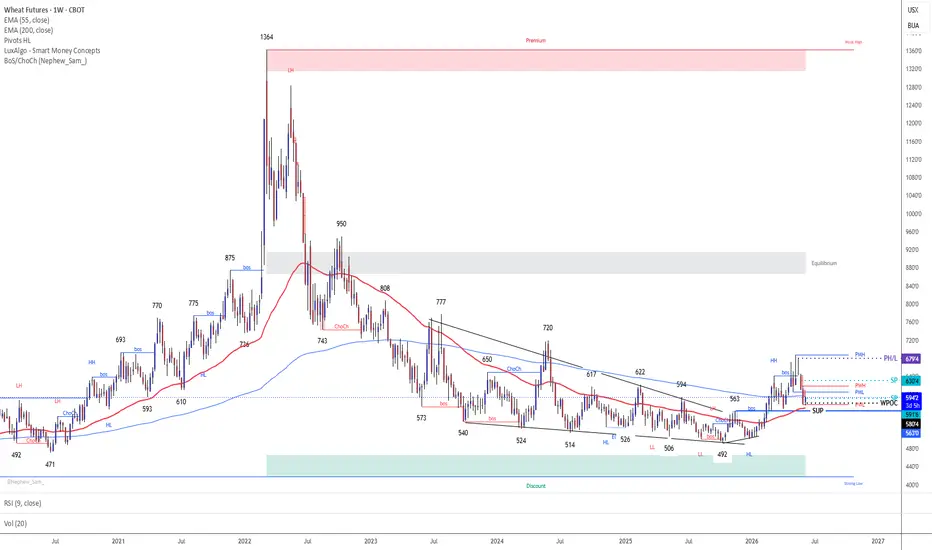
Weekly 55 EMA (570)
Weekly 200 EMA (596)
That combination is much more consistent with a completed Wave C / Wyckoff Spring than with the start of a new bearish leg.
The next major battleground is 628–634. If Wheat ca
567Educational content describing how the Armstrong reversal system and Erwin’s execution framework resolve a specific market setup. Not financial advice. Trading involves substantial risk of loss. The methodology does not eliminate risk or guarantee outcomes. Confirm all triggers on a closing basis. Trade only what you can afford to lose.
WHEAT FUTURES Up Date....WHEAT FUTURES – Institutional Macro, COT, Elliott, Wyckoff & Liquidity Analysis
Executive Summary
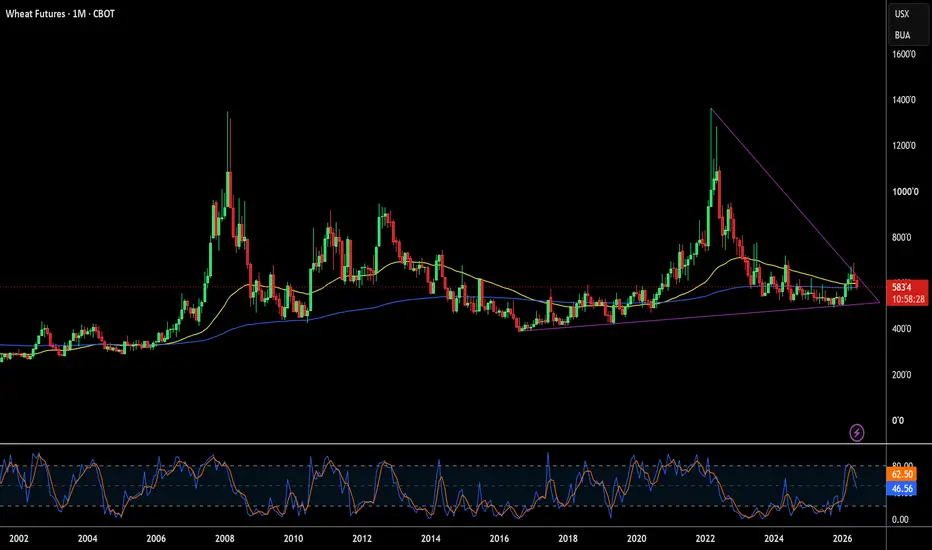
Wheat at 590.4 is now sitting in one of the most important zones seen since the 2022 peak at 1364.
What's changed versus last week:
-Commercials dramatically increased longs (+13,907)
-Commercials aggressively reduced shorts (-17,842)
-Specs liquidated longs heavily
-Managed Money dumped longs (-25,555) and added shorts (+12,931)
-Price is now testing the confluence of:
Weekly POC (580)
Weekly 55
ZW Short — ZW bear trend stays intact below the broken 598-600 sHTF structure is firmly bearish with price well below declining averages and pressing fresh swing lows. The LTF confirmed downside with a high-volume flush through the 598-600 shelf; rather than chase at the low, the cleaner trade is a short on a retest of the breakdown area near 592.75. A reclaim above 597.5 would put price back inside the prior range and invalidate the immediate bear continuation. Target is the next HTF support zone near 580.5 from the prior base.
📍 Entry: 592.75
🛑 Stop: 597.