Beyond the Mega-Caps: The 2026 Small-Cap SurgeStandard market benchmarks are not evenly weighted. In the S&P 500, the 10 largest companies account for roughly 37% of the index's value, while in the Nasdaq they represent closer to 45%. When these indices lead a rally, benchmark performance is disproportionately influenced by sentiment toward these mega-cap technology firms. By contrast, companies with smaller index weights have less impact on overall performance. Indices that give smaller companies more proportional representation, such as the Russell 2000 or the S&P 500 Equal Weight Index, typically depend on a broader market rally.
Despite the AI-driven tech rally gripping the market this year, the reverse occurred. Over the past two months, the Russell 2000 has led the S&P 500, gaining roughly 4%, while the S&P Equal Weight has held flat and the Nasdaq has trended lower.
This paper discusses how capital rotating out of expensive mega-cap tech, and the AI rally’s risk appetite broadening into higher-beta small-cap names have given way to a market driven by small-cap firms and why the Russell’s annual reconstitution at end-June may have brought that trend to a grinding halt.
What Goes Into A Winning Index
Although the indices discussed in this paper – S&P 500, Nasdaq 100, Russell 2000, and S&P 500 Equal Weight - primarily differ in their composition due to market caps of the underlying companies rather than an industry/sector focus, the soaring valuations of technology mega-cap firms have led to a high concentration of the sector in the market capitalization weighted S&P 500 and Nasdaq 100.
Nasdaq’s Information Technology weight sits near 68%, close to double the S&P 500’s 38% and over five times the Russell 2000’s 13%. The Russell 2000’s largest sectors, Health Care, Financials, and Industrials, carry little direct AI exposure, and no single sector dominates the way Technology dominates Nasdaq.
Under equal-weighted S&P 500, two sectors shrink: Information Technology falls from 38% to roughly 15%, and Communication from 9.7% to under 4%. Every other sector holds steady or gains. The shift is concentrated in the two sectors where the largest, most heavily weighted companies sit.
The Spread's Longer History
The Russell 2000’s relative decline is not new. The Russell 2000/S&P 500 ratio has been falling since early 2022, tracking the AI rally’s rise which favoured the mega-cap technology firms. The relative trend reached its low around April 2025. The recovery since has been sustained, not sudden. May to July 2026 marks an acceleration within that longer trend rather than its origin.
The S&P Equal Weight tells a different story. It underperformed the S&P 500 like the Russell through the same period, but unlike the Russell, it failed to recover by outperforming. The ratio has spent the past year near its multi-year low.
This divergence between these 2 spreads suggests that what’s driving Russell 2000 to outperform may be its small-cap risk appetite rather than a broader retreat from mega-cap concentration.
What’s Behind the Small-Cap Recovery, And Can It Last?
The Russell 2000 began to outperform the S&P 500 last July and the acceleration in the spread since May 2026 has extended that trend. The move ran in stages – cheap starting valuations gave the spread room to rise, a risk-on broadening carried it higher, a rotation out of a specific pocket of tech risk sustained it into mid-June, and the June 26 index reconstitution mechanically capped it.
The initial trigger for recovery in the spread was the relatively low valuations for small cap firms. The Russell 2000 to Russell 1000 valuation ratio sat near a 25-year low, signalling lower valuations for small-cap firms.
Source: Franklin Templeton
On a median EV/EBIT basis, the Russell 2000 traded at roughly a 26% discount to the S&P 500, against a historical average closer to 3%.
Source: Goldman Sachs Asset Management
Lower valuations triggered the start of the recovery in small-cap stocks which continued into early 2026.
Then, April's CPI print of 3.8%, the highest in nearly three years, stressed markets as the macro environment deteriorated, with the largest mega-cap technology firms taking the brunt of the damage. The hawkish surprise at Warsh's first FOMC on June 16–17 added fuel to the fire as median 2026 dot-plot expectation rose to 3.8% from 3.4%.
The leadership of the small-cap move was telling. This was not merely capital fleeing tech for safety. The rally was led by dynamic, higher-risk firms rather than defensive ones. In the year to April 2026, the Russell 2000's high-beta Dynamic slice returned 61.2% against 28.0% for its Defensive counterpart suggesting risk appetite broadening, not just capital retreating from mega-cap tech.
Source: LSEG
By mid-June the move's character shifted. Concerns over heavy data-centre capex, particularly among the Magnificent Seven, were in full swing and drove those names lower. Russell 2000 companies carry no comparable capex exposure and held up relatively well. What had been a broadening into small-caps became a rotation away from a specific pocket of tech risk.
The trend halted at the FTSE Russell reconstitution at the June 26 close. Forty-two companies graduated from the Russell 2000 to the Russell 1000, including data-centre names such as Bloom Energy and Credo Technology. The RTY/ES spread peaked almost exactly on that date. Reconstitution mechanically removed the very stocks driving the outperformance in the same week mega-cap tech sentiment was finding a floor.
Historical Trade Setup
The rally in the Russell 2000 vs S&P 500 spread was driven by a range of factors including attractive valuations for small-caps, rotation away from mega-caps, and strong momentum in a pocket of small-cap names linked to the AI rally. Put together this suggests that this type of relative value move often manifests in sustained bursts.
However, when the key drivers of the rally are removed from the index, further outperformance becomes untenable. Consider the following position where a trader positions to benefit from this sustained trend but plans an exit date on the reconstitution date expecting that some of the top performing names may have rallied enough to graduate.
A trader who went long the CME Micro Russell 2000 (M2K) and short the CME Micro E-mini S&P 500 (MES) on 19 May 2026, exiting on 26 June 2026 — the effective date of FTSE Russell's annual reconstitution — would have realised a combined gross mark-to-market gain of USD 1,228.25 .
Long CME Micro E-mini-Russell 2000 (M2K1!) Futures
Entry = 2,753.20
Exit = 3,022.60
PnL: 5 × (3,022.60 − 2,753.20) = USD 1,347.00
Short CME Micro E-mini S&P 500 (MES1!) Futures
Entry = 7,378.00
Exit = 7,401.75
PnL: 5 × (7,378.00 − 7,401.75) = USD −118.75
Combined spread PnL: USD 1,228.25
This content is sponsored.
MARKET DATA
CME Real-time Market Data helps identify trading setups and more effectively express market views. If you have futures in your trading portfolio, you can check out on CME Group data plans available that suit your trading needs at tradingview.com/cme .
DISCLAIMER
This case study is for educational purposes only and does not constitute investment recommendations or advice. Nor are they used to promote any specific products, or services.
Trading or investment ideas cited here are for illustration only, as an integral part of a case study to demonstrate the fundamental concepts in risk management or trading under the market scenarios being discussed.
E-Mini Russell 2000 Index Futures
No trades
No trades
In-depth trading ideas
Momentum Shift with Nova Flow FreeNova Flow Free uses a clean color‑based momentum logic to highlight early trend rotations and structure shifts.
This is the basic version of the tool, designed for clarity and non‑intrusive analysis.
For traders who need more precision, filtering and multi‑mode logic, advanced versions (Core & Sniper) are available privately.
On M2K1 (1H), Nova Flow Free filters intraday noise and reveals early rotation points.
Free version available on my profile.
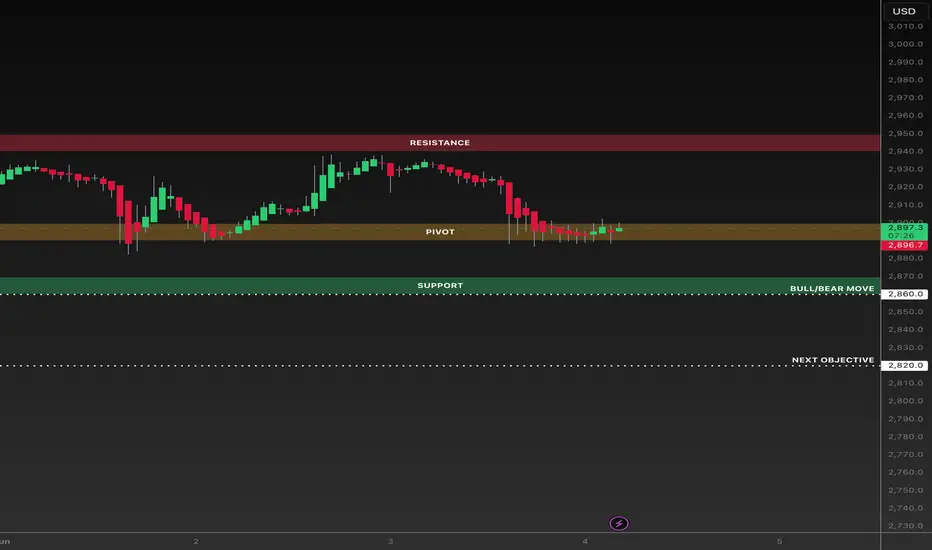
RTY: Decision Point Approaches at 2860RTY continues to rotate lower from resistance near 2940 while holding above key support at 2860.
The current pivot zone around 2890 remains the immediate battleground. A break below 2860 would expose the next objective near 2820, while a successful defence of support could allow buyers to reclaim the pivot and challenge higher levels.
Key Levels:
• Resistance: 2940-2950
• Pivot: 2890-2900
• Support: 2860
• Downside Objective: 2820
My probabilities
Bearish (2860 breaks → 2820)
55%
Bullish (2860 holds → reclaim 2900)
45%
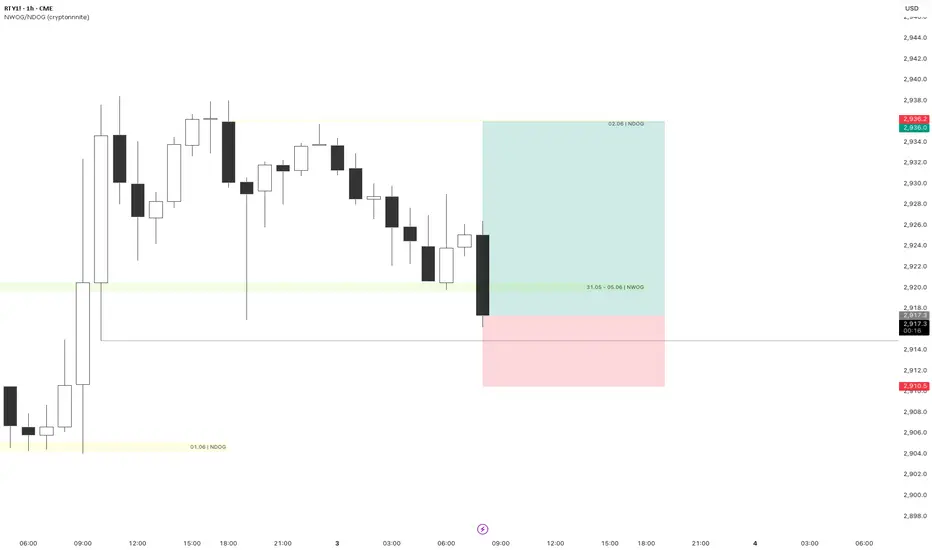
RTY1! · Russell 2000 FuturesFalse break below the 4H low — CRT long trigger
Price swept the 4-hour session low before the open, engineering a liquidity grab on resting sell stops. The move activated a bullish CRT (Candle Range Theory) setup: entry on reclaim, stop protected beneath the prior 4H structural low.
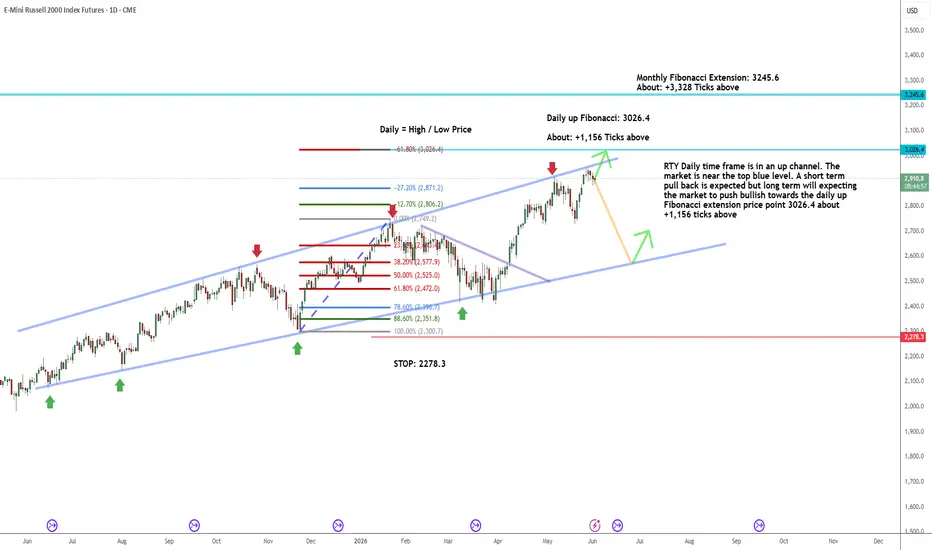
RTY: Daily_ Up Channel_+1,156 Ticks from Fibonacci TargetRTY Daily time frame is in an up channel. The
market is near the top blue level. A short term
pull back is expected but long term will expecting
the market to push bullish towards the daily up
Fibonacci extension price point 3026.4 about
+1,156 ticks above
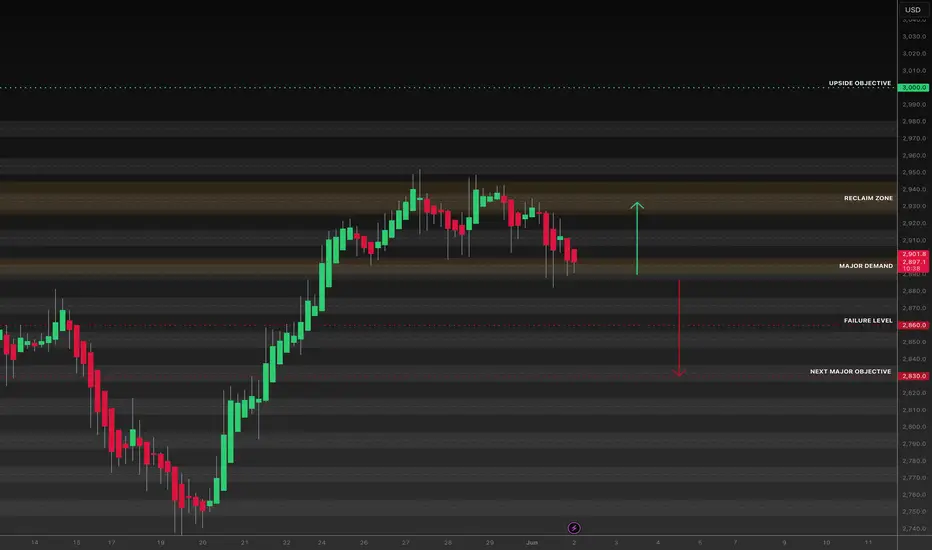
Russell | Pullback Into Demand Within Higher Timeframe Uptrend Russell has pulled back into a key demand area following a strong impulsive advance. The broader trend remains constructive while price holds above the 2860 failure level.
Key Levels:
• Major Demand: 2890-2900
• Failure Level: 2860
• Reclaim Zone: 2925-2945
• Upside Objective: 3000
As long as demand holds, the focus remains on a potential move back into the reclaim zone and a retest of recent highs. A loss of 2860 would invalidate the immediate bullish thesis and shift attention toward lower value near 2830.
Russell 2000 Surges to Record High, Launches Fresh Bull CycleRussell 2000 Futures (RTY) has broken to a new all‑time high, initiating a fresh bullish cycle. The rally from the March 30, 2026 low concluded with wave (1) at 2918.4. Afterward, the Index corrected in wave (2), which ended at 2728.3, as shown in the one‑hour chart. The internal subdivision of wave (2) unfolded as a double three Elliott Wave structure. From the peak of wave (1), wave W finished at 2807.9, while wave X ended at 2881.4. Wave Y then moved lower and completed at 2728.3, marking the end of wave (2) in higher degree.
With the correction complete, the Index resumed its advance and broke above the wave (1) high, confirming that wave (3) has begun. The rally from the wave (2) low is unfolding as a five‑wave impulse. Wave 1 of (3) is expected to finish soon. A pullback in wave 2 should then correct the cycle from the May 19, 2026 low in either three or seven swings before the rally resumes. In the near term, as long as the pivot at 2728.32 remains intact, pullbacks are likely to attract buyers in three or seven swings, supporting further upside.
RTY Daily_Close to bullish Fibonacci target_+194 Ticks to goThe RTY one hour time frame is in an up trend.
The market is making higher highs and higher
lows. The market has an up Fibonacci with an
extension price point 2941.3 about +194 Ticks
above the market. As long as the market does not
take out the one boundary price point 2591.8. It
is expected the market to U-turn bullish and push
towards the one hour Fibonacci extension price.
Entry: Counter trend line break bullish ideally at
price point 2756.8 or lower (That is when reward
is larger than risk)
STOP: 2581.00
LIMIT: 2941.3
Another entry idea: If the risk off the one hour time
frame is too large. It will be a good idea to turn to
the five minute time frame and to look for long ideas
with less risk.
RTY Short — RTY breaking down through key 2832 support — weakestSetup: On the 4h, RTY peaked near 2916 on May 6 and has been printing a series of lower highs — 2896, 2887, 2874 — while the May 12 gap-down session confirmed distribution with ~35k volume bars. The 1h shows price failing at the 2860-2870 supply shelf repeatedly over May 13-14 before rolling over hard in the final 1h bars, breaking below 2832 into the current 2811 print. The descending structure is clean; every bounce is being sold.
Flow: RTY is the weakest equity index today at -2.23%, consistent with small-cap fragility in a rising-rate environment — floating-rate debt exposure and domestic growth sensitivity make this the highest-beta short. COT confirms the setup: asset managers added 26k shorts WoW while leveraged money net short sits at -55k. The macro tape is uniformly risk-off — metals, rates, and equities all selling with DXY bid, removing the typical hedge.
Plan: Entry is a limit at the 2828 area — the prior breakdown shelf from the May 14-15 overnight session and the underside of the 2832 level that broke in the last 1h bar. Stop is placed above the 2845 area, which represents the most recent congestion high and would signal a failed breakdown and reabsorption into the range. Target is the 2790 zone, which corresponds to the early May 12 intraday low cluster and is the next structural support on the 4h. The thesis is wrong if price reclaims 2845 on any 1h close.
📍 Entry: 2828.0
🛑 Stop: 2845.0
🎯 Target: 2790.0
⚖️ R:R: 2.24
RTY Breakout to ATHs: Small Caps Lead as War Truce Holds Geopolitical Fog, Rate Uncertainty, and the Small Cap Divergence
The past month has served as a genuine stress test for risk sentiment, and RTY has passed with surprising resilience. The macro backdrop remains anything but clean. The US-Iran conflict, which began with US-Israeli airstrikes in late February, resulted in Iran closing the Strait of Hormuz and sending shockwaves through global energy markets. The Federal Reserve's April 29 FOMC statement explicitly cited Middle East developments as contributing to "a high level of uncertainty about the economic outlook," noting that "inflation is elevated, in part reflecting the recent increase in global energy prices." As of this writing, the ceasefire that took effect on April 8 remains fragile. Trump called Iran's most recent peace proposal "totally unacceptable" on Sunday, and Israeli Prime Minister Netanyahu stated there is still "work to be done," even as Pakistani mediators remain active in the process. The situation is unresolved and fluid, and any escalation or breakdown in negotiations would reintroduce geopolitical risk premiums into energy prices almost immediately.
On the monetary policy front, the picture is equally complex. The FOMC voted to hold the benchmark federal funds rate steady at 3.5% to 3.75% at its April meeting, marking the third consecutive pause following three consecutive cuts in 2025. The meeting was notable for an unusual degree of internal dissent, and markets are now pricing in no changes for the rest of this year and well into 2027. Adding to the uncertainty, Federal Reserve Chair Jerome Powell is departing in mid-May, with Kevin Warsh expected to be confirmed as his successor. Warsh has pledged a "regime change" at the central bank, though he has not been explicit on exactly how that change will be implemented. A leadership transition at the Fed, against a backdrop of sticky inflation and an unresolved war, is a meaningful wildcard for rate-sensitive small caps to navigate.
This is precisely where RTY's story gets interesting. Small caps carry disproportionate floating-rate debt exposure relative to large caps, making them acutely sensitive to borrowing costs. Nearly 40% of debt held by Russell 2000 constituents is floating-rate, compared to less than 10% for S&P 500 companies. When the S&P 500 was selling off continuously through the worst of the US-Iran escalation period in March, RTY was not following suit with the same conviction. Instead, it carved out a distinct accumulation range and ultimately broke to new ATHs before the large cap benchmarks did. In April alone, the small cap benchmark surged 11.8%, reaching a fresh all-time high. The RTY is currently trading near 2,861, with the index up 0.76% at the close of May 8. The divergence from the S&P 500's continued downtrend during the worst of the conflict was not noise. It was a market telling a story about rotation and domestic economic confidence. Investors will want to watch credit spreads, the pace of the Iran negotiations, and any signal from incoming Fed Chair Warsh on the rate trajectory as the most important macro variables going forward.
What the Market Has Done
The market fell back into November's range and value area at the beginning of March.
Unlike the S&P 500, which continually sold off as the U.S.-Iran war progressed, RTY balanced and auctioned two-way between 2580, the low of the pre-war consolidation range, and the 2420 area, which marked November value area low, forming an accumulation range.
On April 8, the market broke out of this accumulation range and rallied through the pre-war consolidation range into new all time highs.
From mid April into late April, markets consolidated in a tight block and accepted prices higher, showing buyers remained in control despite slowing momentum.
Most recently, the market broke out above 2810 and pushed into fresh all time highs, confirming continuation higher for now.
What to Expect in the Coming Weeks
The key level to watch is 2,810 (April VAH).
Bullish Scenario
If markets hold above 2,810 (April VAH), expect continued upside and a revisit of the ATH area near 2,918.
Above 2,918, the next logical target is a push into the 3,000 level, which represents fresh price discovery territory and a psychologically significant round number.
A possible macro catalyst that could support this path would be a meaningful breakthrough in the Iran negotiations, with the Strait of Hormuz moving toward full reopening. This would accelerate the disinflationary impulse from lower energy prices and potentially reopen the door for Fed easing under the incoming Chair.
Neutral Scenario
If the market lacks pace and volume as it approaches the edges of the range, expect two-way rotation between 2,810 and 2,918 (ATHs) as the market works to establish value at higher prices.
This type of balanced, rotational trade is normal and healthy following a sharp breakout. It does not negate the bullish structure but does require patience.
A possible macro setup for this path would be a continuation of the current impasse: the ceasefire holding but without a formal deal, the Fed on pause, and incoming data remaining ambiguous enough to prevent a strong directional macro conviction.
Bearish Scenario
If buyers are unable to hold 2,810, expect a move down through the bid block toward the 2,720 area, where buyers are expected to respond.
A failure to hold 2,810 does not automatically invalidate the broader bull structure, but it would signal that the market is not yet ready to sustain these prices and that more time and value-building below is needed.
A possible macro trigger for this path would be a ceasefire breakdown, renewed escalation in the Strait of Hormuz that sends energy prices surging, a hawkish surprise from the incoming Fed Chair Warsh, or a hard miss on small cap earnings that calls the profitability thesis into question.
Conclusion
RTY's chart tells a story that the headline indices largely missed. While the S&P 500 was grinding lower through the worst of the geopolitical storm, small caps were quietly building the foundation for a breakout. The technicals are clear: price is above 2,810 and printing new ATHs, and the structure remains bullish as long as that level is defended. From a fundamental and macro standpoint, the picture is more nuanced. The Fed is on hold with a new Chair about to take the helm, inflation remains sticky above 3%, the Iran ceasefire is fragile and actively contested, and nearly 40% of RTY's debt load is floating-rate, meaning the index has more to gain from cuts and more to lose from hikes than its large cap peers. The market, however, has already voted with its feet. Whether the 2,810 level holds will be the most important near-term tell for whether this rally has legs heading into June. Are you watching 2,810, or are you already positioned for the next leg higher?
Disclaimer: This is not financial advice. Analysis is for educational purposes only; trade your own plan and manage risk.
Acronyms:
C - Composite
w - Weekly
m - Monthly
VA - Value Area
VAH - Value Area High
VAL - Value Area Low
VPOC - Volume Point of Control
LVN - Low Value Node
LVA - Low Value Area
HVN - High Value Node
HVA - High Value Area
SP - Single print
ATH - All time high
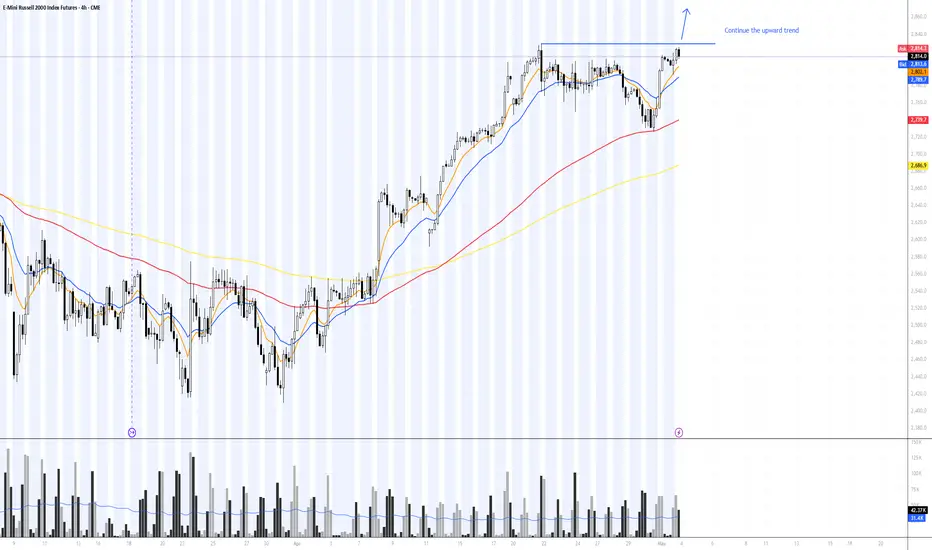
RUSSELL 2000 | Continue the upward trend | Week May 04-08,2026Hello Traders!
CME_MINI:RTY1! is reached ATH and is currently in an accumulation phase.
I am looking for a long opportunity. My strategy is to wait for a bullish breakout candle above the resistance level with high volume confirmation, then place a Buy Stop order
I will follow the trend and use EMA as a trailing stop to lock in profits
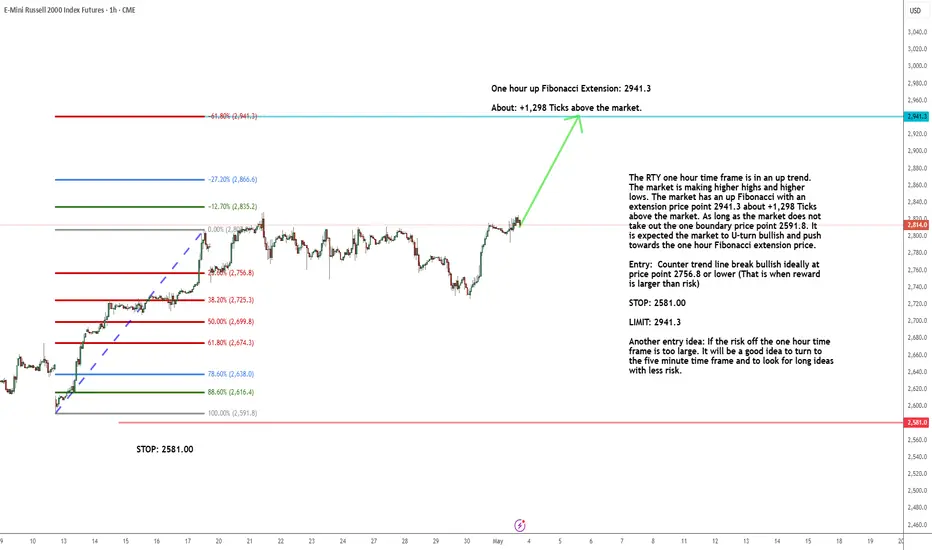
RTY One Hour: +1,298 Ticks to Bullish TargetThe RTY one hour time frame is in an up trend.
The market is making higher highs and higher
lows. The market has an up Fibonacci with an
extension price point 2941.3 about +1,298 Ticks
above the market. As long as the market does not
take out the one boundary price point 2591.8. It
is expected the market to U-turn bullish and push
towards the one hour Fibonacci extension price.
Entry: Counter trend line break bullish ideally at
price point 2756.8 or lower (That is when reward
is larger than risk)
STOP: 2581.00
LIMIT: 2941.3
Another entry idea: If the risk off the one hour time
frame is too large. It will be a good idea to turn to
the five minute time frame and to look for long ideas
with less risk.
Russell (RTY) Extends Higher in Impulsive AdvanceRussell Futures (RTY) completed its correction against the cycle from the April 2025 low on March 31. Since then, the Index has advanced decisively, reaching new all‑time highs while unfolding in a clear impulsive Elliott Wave structure. From the March 31 low, wave 1 terminated at 2557, followed by a measured pullback in wave 2 which ended at 2467.8. The subsequent rally developed into wave 3, itself subdividing into five waves of lesser degree, confirming the impulsive character of the advance.
From wave 2, wave ((i)) concluded at 2674.5, while the retracement in wave ((ii)) found support at 2591.8. The Index then extended higher in wave ((iii)), reaching 2828.7. A corrective phase in wave ((iv)) completed at 2760.7. With this structure, expectations remain for a few additional highs to finalize waves 3, 4, and 5. Completion of these movements should mark the end of wave (1) in higher degree, thereby concluding the cycle from March 31. Afterward, a larger corrective phase is anticipated to adjust the cycle before the next sustained leg higher unfolds. In the near term, as long as the pivot at 2469.4 holds, dips should attract buyers. These retracements are expected to occur in sequences of three, seven, or eleven swings, offering opportunities for further upside participation.
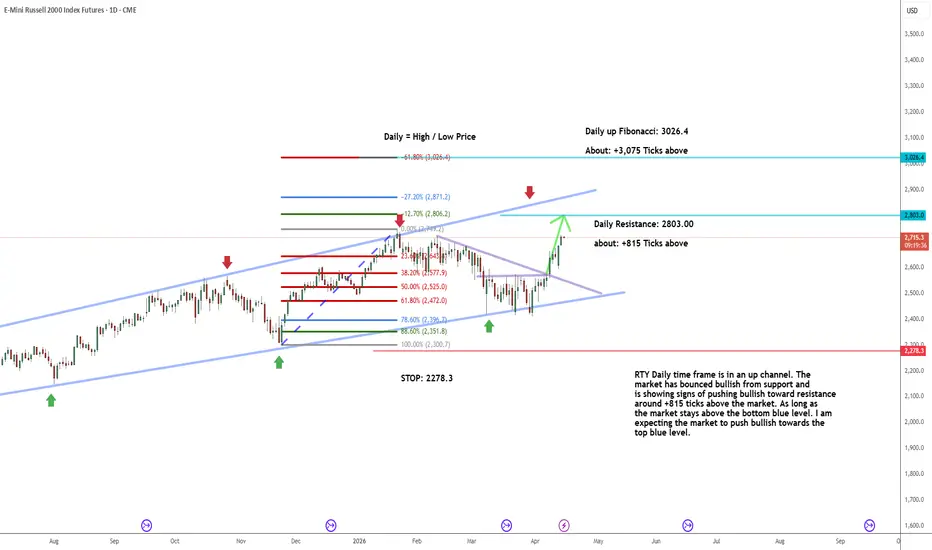
RTY: Daily up channel +815 ticks to resistanceRTY Daily time frame is in an up channel. The
market has bounced bullish from support and
is showing signs of pushing bullish toward resistance
around +815 ticks above the market. As long as
the market stays above the bottom blue level. I am
expecting the market to push bullish towards the
top blue level.
RTY Daily: Buyers holding strong!RTY Daily time frame is in an up channel. The
market has bounced bullish from support and
is showing signs of pushing bullish toward resistance
around +1,552 ticks above the market. As long as
the market stays above the bottom blue level. I am
expecting the market to push bullish towards the
top blue level.
RTY: Daily counter trend line break bullish +1,552 ticksRTY Daily time frame is in an up channel. The
market has bounced bullish from support and
is showing signs of pushing bullish toward resistance
around +1,552 ticks above the market. As long as
the market stays above the bottom blue level. I am
expecting the market to push bullish towards the
top blue level.