When the Target Is Too Close, Change the TimeframeA chart pattern can identify a possible direction. It cannot tell us whether the trade built around that direction offers enough room to justify the risk.
That distinction becomes especially important when a pattern appears technically valid, yet an important support or resistance area sits much closer than the pattern's textbook target. In that situation, the question is no longer simply, "Is the pattern bullish or bearish?" A more useful question is: "How much space does the market realistica
In-depth trading ideas
RTY1! - Why complicate things?Went short Sept 10 (Dec contract pricing shown), there's the stop as of now... sizing is KEY, but not for thee..... not here anyway :-)
When you start trading a proven system, you stop worry about the utter nonsense that prevents most traders from winning....
When stops need to be moved, I'll update here.
And yes all of my public posts are delayed for a reason. Ask why or think harder :-)
RTY1! / RUSSELL 2000 Multiple Timeframes
RTY1! Multiple Timeframe Analysis:
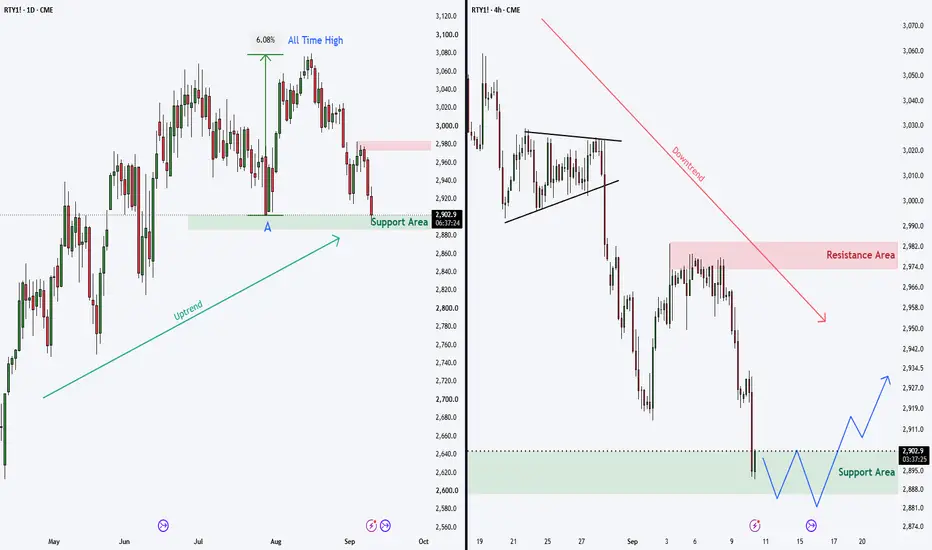
On the Daily chart (LEFT), we can see that this price zone (A) previously acted as support and led to a strong +6% move to a new all-time high. The Daily chart is still in an uptrend.
However, the 4H chart (RIGHT) is trending steadily lower, and at the moment there is no clear sign that the downtrend is coming to an end.
Since the Daily trend (LEFT) remains intact, we could potentially see a bullish reversal if a double bottom, a breakdown failure, or a s
Elliott Wave View: Russell 2000 (RTY) Impulse Set to Extend HighThe short‑term Elliott Wave view in Russell 2000 (RTY) shows that the rally from the June 9, 2026 low is unfolding as a five‑wave impulsive structure. From that low, wave ((i)) concluded at 3068.4, followed by a corrective pullback in wave ((ii)) which ended at 2903.26. The one‑hour chart highlights this development clearly. The Index has since advanced in wave ((iii)), which subdivides into another five‑wave sequence of lesser degree.
From wave ((ii)), wave (i) finished at 2976.3, while the su
Russell 2000 : The Market’s Risk Thermometer The Russell 2000 remains one of the clearest gauges of genuine risk appetite across the market.
Following a strong recovery and a retest of the all-time high area, a healthy correction is now expected before the broader bullish move can continue. This setup aims to take advantage of that potential pullback, offering an attractive risk-to-reward profile while keeping the stop-loss below the key structure supporting the idea.
Should the stop-loss be triggered, the broader long-term thesis would
Beyond the Mega-Caps: The 2026 Small-Cap SurgeStandard market benchmarks are not evenly weighted. In the S&P 500, the 10 largest companies account for roughly 37% of the index's value, while in the Nasdaq they represent closer to 45%. When these indices lead a rally, benchmark performance is disproportionately influenced by sentiment toward these mega-cap technology firms. By contrast, companies with smaller index weights have less impact on overall performance. Indices that give smaller companies more proportional representation, such as t
Momentum Shift with Nova Flow FreeNova Flow Free uses a clean color‑based momentum logic to highlight early trend rotations and structure shifts.
This is the basic version of the tool, designed for clarity and non‑intrusive analysis.
For traders who need more precision, filtering and multi‑mode logic, advanced versions (Core & Sniper) are available privately.
On M2K1 (1H), Nova Flow Free filters intraday noise and reveals early rotation points.
Free version available on my profile.
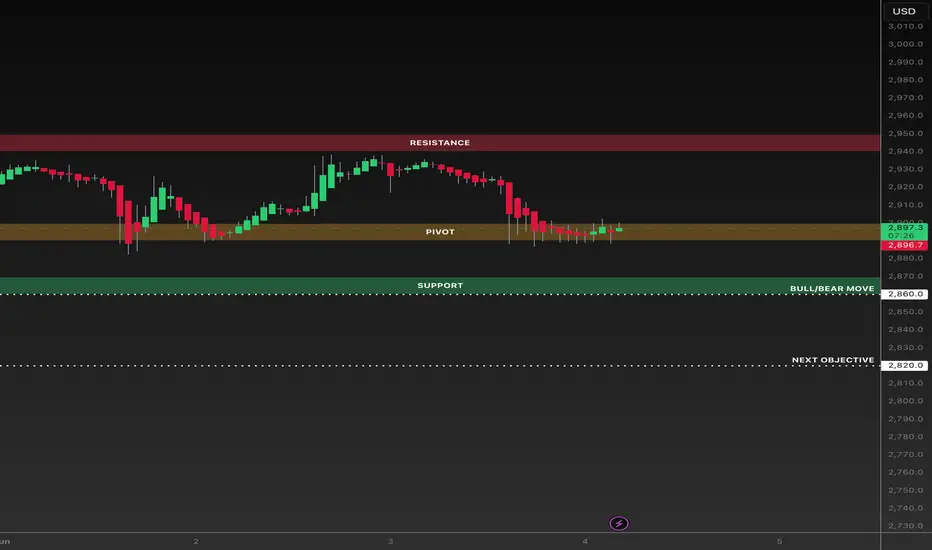
RTY: Decision Point Approaches at 2860RTY continues to rotate lower from resistance near 2940 while holding above key support at 2860.
The current pivot zone around 2890 remains the immediate battleground. A break below 2860 would expose the next objective near 2820, while a successful defence of support could allow buyers to reclaim the pivot and challenge higher levels.
Key Levels:
• Resistance: 2940-2950
• Pivot: 2890-2900
• Support: 2860
• Downside Objective: 2820
My probabilities
Bearish (2860 breaks → 2820)
55%
Bullish
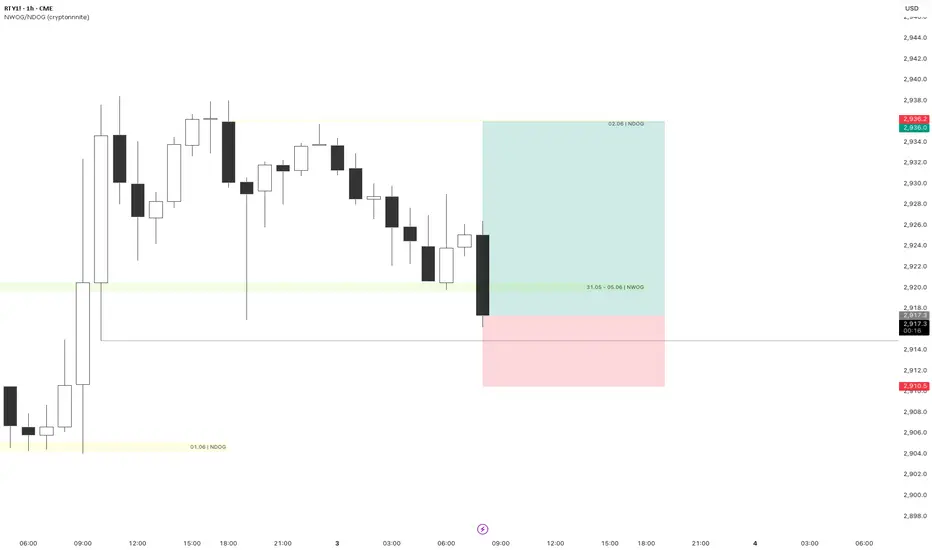
RTY1! · Russell 2000 FuturesFalse break below the 4H low — CRT long trigger
Price swept the 4-hour session low before the open, engineering a liquidity grab on resting sell stops. The move activated a bullish CRT (Candle Range Theory) setup: entry on reclaim, stop protected beneath the prior 4H structural low.
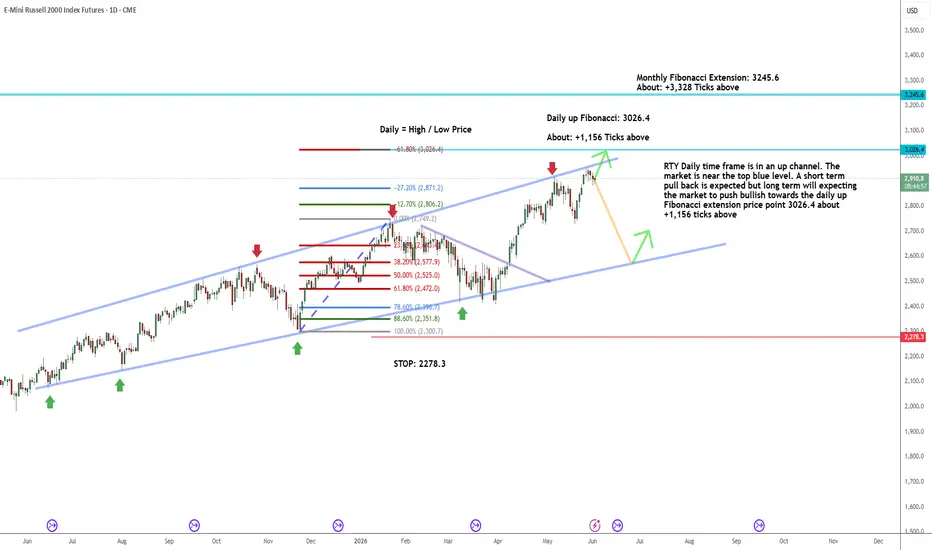
RTY: Daily_ Up Channel_+1,156 Ticks from Fibonacci TargetRTY Daily time frame is in an up channel. The
market is near the top blue level. A short term
pull back is expected but long term will expecting
the market to push bullish towards the daily up
Fibonacci extension price point 3026.4 about
+1,156 ticks above
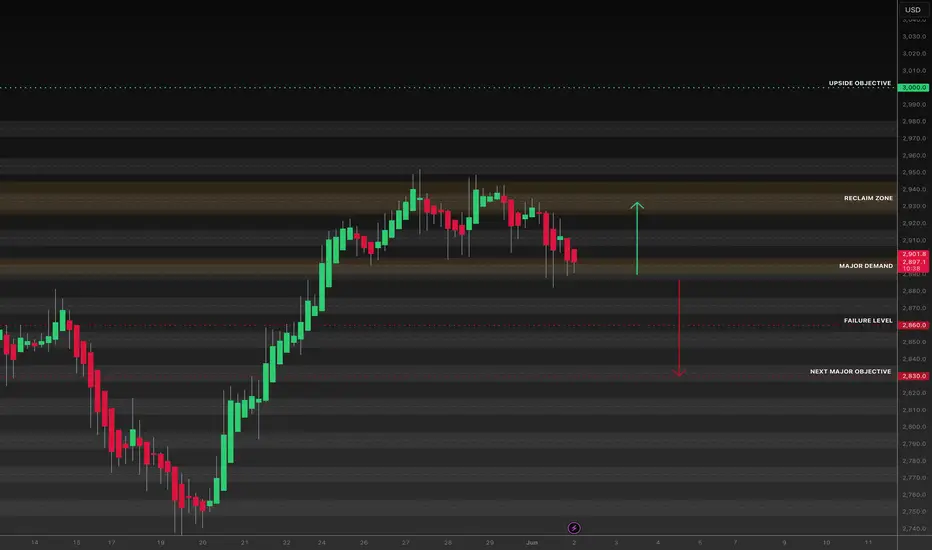
Russell | Pullback Into Demand Within Higher Timeframe Uptrend Russell has pulled back into a key demand area following a strong impulsive advance. The broader trend remains constructive while price holds above the 2860 failure level.
Key Levels:
• Major Demand: 2890-2900
• Failure Level: 2860
• Reclaim Zone: 2925-2945
• Upside Objective: 3000
As long as demand holds, the focus remains on a potential move back into the reclaim zone and a retest of recent highs. A loss of 2860 would invalidate the immediate bullish thesis and shift attention toward lower
Russell 2000 Surges to Record High, Launches Fresh Bull CycleRussell 2000 Futures (RTY) has broken to a new all‑time high, initiating a fresh bullish cycle. The rally from the March 30, 2026 low concluded with wave (1) at 2918.4. Afterward, the Index corrected in wave (2), which ended at 2728.3, as shown in the one‑hour chart. The internal subdivision of wave (2) unfolded as a double three Elliott Wave structure. From the peak of wave (1), wave W finished at 2807.9, while wave X ended at 2881.4. Wave Y then moved lower and completed at 2728.3, marking the
RTY Daily_Close to bullish Fibonacci target_+194 Ticks to goThe RTY one hour time frame is in an up trend.
The market is making higher highs and higher
lows. The market has an up Fibonacci with an
extension price point 2941.3 about +194 Ticks
above the market. As long as the market does not
take out the one boundary price point 2591.8. It
is expected the market to U-turn bullish and push
towards the one hour Fibonacci extension price.
Entry: Counter trend line break bullish ideally at
price point 2756.8 or lower (That is when reward
is larger than r
RTY Short — RTY breaking down through key 2832 support — weakestSetup: On the 4h, RTY peaked near 2916 on May 6 and has been printing a series of lower highs — 2896, 2887, 2874 — while the May 12 gap-down session confirmed distribution with ~35k volume bars. The 1h shows price failing at the 2860-2870 supply shelf repeatedly over May 13-14 before rolling over hard in the final 1h bars, breaking below 2832 into the current 2811 print. The descending structure is clean; every bounce is being sold.
Flow: RTY is the weakest equity index today at -2.23%, consist
RTY Breakout to ATHs: Small Caps Lead as War Truce Holds Geopolitical Fog, Rate Uncertainty, and the Small Cap Divergence
The past month has served as a genuine stress test for risk sentiment, and RTY has passed with surprising resilience. The macro backdrop remains anything but clean. The US-Iran conflict, which began with US-Israeli airstrikes in late February, resulted in Iran closing the Strait of Hormuz and sending shockwaves through global energy markets. The Federal Reserve's April 29 FOMC statement explicitly cited Middle East developments a
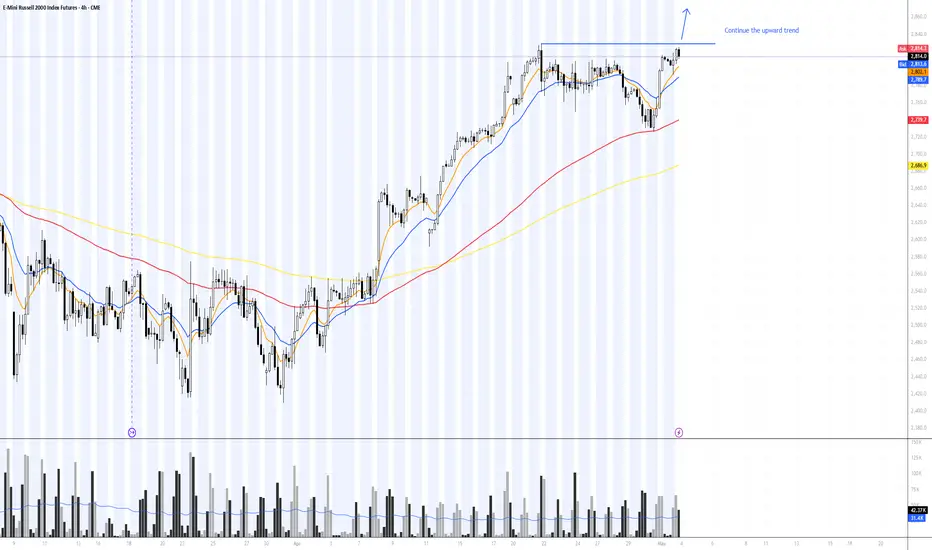
RUSSELL 2000 | Continue the upward trend | Week May 04-08,2026Hello Traders!
CME_MINI:RTY1! is reached ATH and is currently in an accumulation phase.
I am looking for a long opportunity. My strategy is to wait for a bullish breakout candle above the resistance level with high volume confirmation, then place a Buy Stop order
I will follow the trend and use EMA as a trailing stop to lock in profits
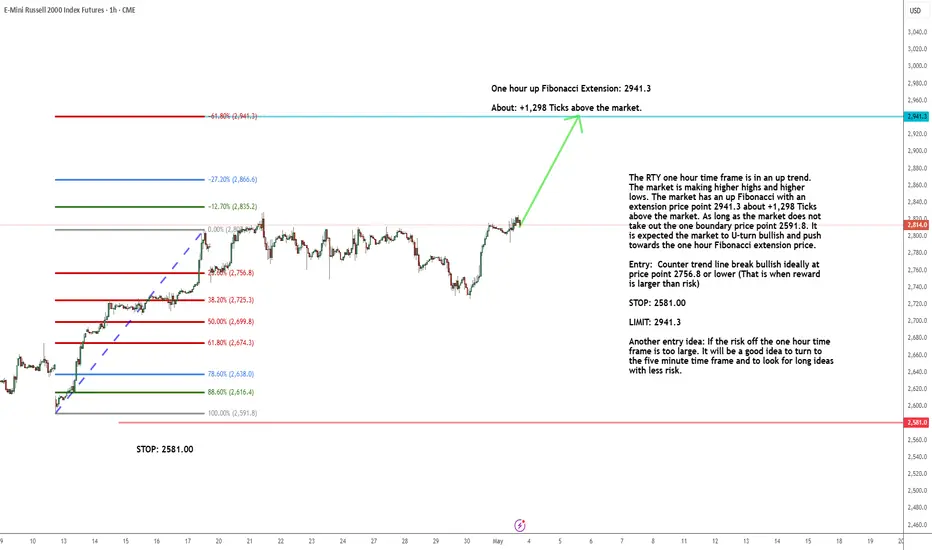
RTY One Hour: +1,298 Ticks to Bullish TargetThe RTY one hour time frame is in an up trend.
The market is making higher highs and higher
lows. The market has an up Fibonacci with an
extension price point 2941.3 about +1,298 Ticks
above the market. As long as the market does not
take out the one boundary price point 2591.8. It
is expected the market to U-turn bullish and push
towards the one hour Fibonacci extension price.
Entry: Counter trend line break bullish ideally at
price point 2756.8 or lower (That is when reward
is larger than