**Silver Futures 1H — Long Scenario from the 1.414–1.618 Expansi**Silver Futures 1H — Long Scenario from the 1.414–1.618 Expansion Zone**
Silver is currently moving lower toward the **1.414–1.618 external expansion zone**, located around **$64.90–$65.30**.
This area overlaps with a previously formed imbalance and may become a potential point of interest for a bullish reaction. I expect the price to complete the current downside expansion before looking for confirmation of a reversal.
**Key levels:**
• Reaction zone: **$64.90–$65.30**
• First target: **$67.90–$68.00**
• Main target: **$68.50**
Sustained acceptance below the expansion zone would weaken the bullish scenario. I will consider a long position only after a clear reaction and confirmation from the marked area.
*This analysis is for educational purposes only and does not constitute financial advice.*
Silver Futures
No trades
No trades
In-depth trading ideas
This is a tricky market but there may be some reversal patterns9 23 226 this is Wednesday the 23rd... There may be a reversal pattern to go higher with coffee the es made a new high and you need to be careful with that. I believe I looked at about 10 or so markets. As it turned out there may be an example of why you another market instead of the es and I put up the pattern for you to see the difference and there are some reasons why you may want to look at these kinds of differences when trading one market versus another.
SILVER FUTURES 30 MINUTES TRADING PLANSILVER FUTURES 30 MINUTES TRADING PLAN
1. Trading Basic Information
Trading Instrument: Silver Futures (COMEX SL1)
Trading Timeframe: 30 Minutes (30M)
Trade Direction: Short
Risk-Reward Ratio: 1:9.56
2. Core Trading Parameters
Entry Price: Enter short position near the current price of 67.390
Stop Loss Price: 67.900
3. Target Price & Position Management Rules
1. First Target Level: 65.750
Close half of the position at this level. Move stop loss to break-even price to secure principal and eliminate trading risks for the remaining position.
2. Second Target Level: 64.300
Close half of the remaining position at this level. Adjust stop loss again to lock floating profits further.
3. Third Target Level: 62.800
Close half of the remaining position at this level. Re-adjust stop loss to maximize accumulated profits.
4. Final Position Handling: Keep the last small position dynamically, follow the market trend, and exit according to real-time price movement without forced closing.
4. Risk Warning
Silver futures markets feature high intraday volatility on the 30-minute timeframe. Price fluctuations, false breakouts and liquidity spikes may occur due to institutional capital flow, commodity market sentiment and macro data releases. Stop-loss orders may face slippage or failure under extreme low-liquidity conditions. Strict position sizing and rigid stop-loss discipline are mandatory to avoid unexpected trading losses.
5. Disclaimer
This trading plan is based solely on preset technical parameters and mechanical position management rules for 30-minute band swing trading. It does not constitute any investment advice, trading recommendation or profit guarantee. All trading decisions, actions and final profit or loss shall be borne entirely by the trader. The producer of this plan assumes no responsibility for any investment losses incurred by referencing this plan.
SI 1!/ USD 45 min Swing Trading PlanSI 1!/ USD 45 min Swing Trading Plan
Trading Cycle: 45-Minute Swing Trade
Risk-Reward Ratio: 1:10.5
Entry: Short entry around current price 67.080
Stop Loss: 67.500
First Target: 65.760
Close half position and trail protective stop after reaching the first target.
Second Target: 64.500
Close half of the remaining position and trail the protective stop again after reaching the second target.
Third Target: 63.000
Reduce position and update trailing protection at the third target. Leave the final tail position with trailing protection.
Risk Warning
CME Silver Futures (SI) has high market volatility. Price slippage and liquidity sweeps may occur around psychological levels and imbalance zones. Silver prices can fluctuate sharply due to macroeconomic data, US dollar movement and geopolitical news. Strict position sizing and disciplined stop-loss execution must be followed for every trade.
Disclaimer
This trading plan is for personal trading reference only and does not constitute any financial investment advice. All trading decisions, profits and losses are entirely borne by the trader personally.
How to Properly Use Risk-Reward Ratio in Futures TradingThe risk-reward ratio measures how much potential reward you're targeting for every dollar you put at risk.
If you risk $100 to potentially make $300, that's a 1:3 ratio. Most professional traders treat this kind of thinking as non-negotiable, and for good reason. It gives you a clear, objective way to evaluate whether a trade is worth taking before you take it.
Why does this matter?
Without thinking about the ratio, even frequent wins can translate into long-term losses if your losers are big enough. Many first-time investors and traders learn this the hard way. So, it’s not just about being right more often than you’re wrong. It’s about what happens to your money when you are right, and when you aren’t.
📌 How to Calculate Risk-Reward Ratio
The process is simple. You only need 3 things:
Entry price: where you take the trade
Stop-loss: where you’re wrong (your risk)
Target: where you exit in profit (your reward)
The formula:
Risk-Reward Ratio = (Target Price - Entry Price) / (Entry Price - Stop-Loss Price)
Think of it like this:
Risk = what you lose (if wrong)
Reward = what you make (if right)
You’re always asking:
“How much am I risking to make how much?”
Example (Long Trade)
Entry: $50
Stop-loss: $47 → Risk = $3
Target: $59 → Reward = $9
You’re risking $3 to make $9
That’s a 1:3 risk-reward
Example (Short Trade)
Entry: $80
Stop-loss: $85 → Risk = $5
Target: $68 → Reward = $10
You’re risking $5 to make $10
That’s a 1:2 risk-reward
Worth noting: The ratio only tells you the relationship between your risk and your target. It says nothing about how likely the trade is to work. That's your edge, and it's a separate question entirely.
📌 What “Good” Risk-Reward Ratios Look Like in Practice
There's no universally correct ratio. It depends on your strategy, your market, and your win rate. A scalper taking clean setups at high frequency might work comfortably with 1:1.5. A swing trader holding for days needs a wider target to justify the overnight risk, so 1:3 or better makes more sense.
The general floor most experienced traders use is 1:2. Below that, your win rate has to be high enough to compensate, and most traders overestimate their win rate.
📌 The Hidden Math: How Win Rate and Risk-Reward Ratio Work Together
Many traders don’t realize that win rate and risk-reward ratio trade off against each other. You can have a low win rate and still be profitable if your winners are big enough.
You can win fewer than half your trades and still be profitable, as long as your winners are large enough relative to your losers. Conversely, a high win rate means nothing if your losses consistently dwarf your gains.
A simple illustration: if you win 1 out of every 4 trades, but each win is three times the size of each loss, you break even. Add even a modest edge on top of that and you're profitable.
This is why many experienced traders focus as much on managing losses as on finding winners. The ratio is what keeps the math working even when your read on the market is wrong more often than right.
📌 Common Pitfalls: Where the Ratio Fails (and Why Beginners Get Tripped Up)
The risk-reward ratio is a starting point, not a guarantee. Several things can break the math in practice:
Market volatility. A stop placed at a logical level can still get hit before price moves to your target, simply because the market moved sharply in both directions. The ratio doesn't account for the path price takes to get there.
Execution. Slippage, wide spreads, and hesitation at the entry can quietly erode a ratio that looked clean on paper. A planned 1:3 can become 1:2 before the trade even starts.
Psychological pressure. Sitting in a trade that's showing profit but hasn't reached the target is harder than it sounds. The temptation to exit early, turning a 1:3 into a 1:1.5, is one of the most common ways traders undermine their own edge.
Actual win rate vs. expected. A setup that looks statistically strong doesn't guarantee the win rate holds over your next 30 trades. Small sample sizes produce noise, and traders often abandon sound approaches during short losing streaks.
Worth noting: If you consistently exit trades before your target, that's worth tracking. The gap between your planned ratio and your actual realized ratio is often larger than traders expect, and it's usually the biggest leak in an otherwise solid approach.
📌 Why Asymmetric Risk-Reward Trades Matter in Modern Markets
Occasionally you'll encounter setups where the potential reward is significantly larger than the risk, a 1:5, 1:8, or beyond. These are called asymmetric trades, and they have a specific logic.
Since the risk is small relative to the potential gain, you can be wrong most of the time and still come out ahead on the few trades that work. Options plays around earnings, breakouts from multi-month ranges, and volatility spikes can all produce this kind of setup.
The catch is consistency. Asymmetric trades don't occur frequently, and when they do, the win rate is usually low. The math only works if you keep losses small on the misses and let the winners run fully on the hits. Most traders cut winners too early and let that edge evaporate.
Worth noting: Asymmetric setups are worth cataloguing separately in your trade journal. Over time you'll see whether your hit rate on them actually justifies the approach, or whether you're overestimating how often they pay out.
📌 What the Data Actually Shows
A few patterns that show up consistently across backtests and fund data:
In trending equity markets, 1:2 setups produced steady results for traders who stuck to their plan. In choppy or high-volatility periods, stop-outs increased significantly, and traders who adjusted their ratio or widened stops mid-trade typically underperformed those who held their structure.
In forex, retail traders using 1:1 or tighter ratios without strict position sizing lost money at a disproportionate rate, consistent with data from multiple brokers over a multi-year period. The ratio alone wasn't the problem. The discipline to execute it consistently was.
Professional funds running 1:3 or better showed consistent outperformance, but almost universally combined that with strict position sizing and predefined exit rules. The ratio was one component of a system, not a standalone edge.
The consistent finding: the ratio is not where most traders fail. Sticking to it is.
Worth noting: If you have six months or more of trade data, calculate your average planned ratio versus your average realized ratio. The difference between those two numbers will tell you more about where your edge is leaking than almost any other metric.
📌 How to Apply It Without Undermining Yourself
A process most professionals follow:
Define your risk before you enter. Know exactly where you're wrong before price tells you.
Set a target based on what the market can realistically deliver, not on what you need to make.
Only take trades with at least a 1:2 ratio. Many prefer 1:3 or better.
Don't move your stop to give the trade more room unless something in the setup has genuinely changed.
Keep risk per trade at 1 to 2% of account size. One loss shouldn't materially change your situation.
Adjust for market conditions. Fast-moving markets require wider stops and lower expected win rates. Your ratio needs to reflect that.
📌 The Bottom Line
Over a large enough sample of trades, refusing to risk more than you stand to gain is one of the few structural edges a retail trader can actually control.
Markets change, setups evolve, and strategies need updating. The principle of protecting your downside while giving your upside room to run doesn't.
📌 Disclaimer
IMPORTANT: Trading in futures and options carries substantial risk of loss and is not suitable for every investor. The valuation of futures and options contracts may fluctuate rapidly and unpredictably, and, as a result, clients may lose more than their original investments. In no event should the content of this website be construed as an express or implied promise or guarantee by or from Plus500US Financial Services LLC that you will profit or that losses can or will be limited in any manner whatsoever. Market volatility, trade volume, and system availability may delay account access and trade executions. Past results are no indication of future performance. Information provided in this correspondence is intended solely for informational purposes and is obtained from sources believed to be reliable. Information is in no way guaranteed. The trading of futures is available through Plus500US Financial Services LLC d/b/a Plus500, a Futures Commission Merchant registered with the US Commodity Futures Trading Commission and a member of the National Futures Association (NFA ID number 0001398). Plus500US Financial Services LLC is a wholly-owned subsidiary of Plus500US Inc. Trading privileges subject to review and approval. Not all applicants will qualify. Information collected on account applications will be used to verify an applicant’s identity, as required under Federal law.
Silver 8H timeframe- bullish potentialMy last prediction was incorrect and invalidated. This is the revised analysis based on the latest price action.
Looks like Silver has completed a wave 2 red double zigzag WXY pattern at Fibonacci 50% at 62.7 and moving higher with wave 3 red, first target at the level where wave 1= wave 3: 83.3
Confirmation: 69
Invalidation: 62.7
I would not enter a long at this stage but rather wait for a correction on a lower timeframe, which is expected shortly.
September 14-19 Silver Weekly Forecast: 69 vs 63Silver enters the new week with the model equilibrium tightly centered around 66.
The key numbers for the week are 69 above and 63 below. These are the first major decision areas that could determine whether Silver extends into a larger directional move or continues rotating around equilibrium.
Upside Levels
The first major upside test is concentrated around 68-69, where the Upper Predictive Rail and first outer level sit very close together.
This makes 68-69 the main upside decision zone for the week.
A sustained move above 69 would put 71 in focus.
If upside momentum continues beyond that, the upper extreme sits around 74, representing the upper end of the weekly forecast distribution.
Downside Levels
The first major downside area is similarly concentrated around 63.
A sustained break below 63 would put 60 in focus.
If selling extends further, the lower extreme sits around 57.
Weekly Decision Map
Upper Decision Area: 68-69
Upside Path: 71
Upper Extreme: 74
Equilibrium: 66
Lower Decision Area: 63
Downside Path: 60
Lower Extreme: 57
Weekly View
Silver begins the week with equilibrium centered around 66, making it the main reference point for the weekly structure.
The first important upside battle is 68-69. Clearing this area would open the path toward 71, with 74 representing the upper extreme.
On the downside, 63 is the key level to watch. Losing it would shift attention toward 60, followed by the 57 lower extreme.
This gives Silver a very clear weekly map: 69 above, 66 in the middle and 63 below. A sustained break away from this structure could determine the direction of the week's larger move.
1 Hour COMEX Silver (SI1!) Futures Trading Plan1 Hour COMEX Silver (SI1!) Futures Trading Plan
Basic Trading Information
• Trading Asset: COMEX Silver Futures (SI1!)
• Trading Timeframe: 1-Hour Chart
• Trading Direction: Long
• Risk-Reward Ratio: 1:8.15
Core Trading Parameters
• Entry Price: Around 64.745
• Stop Loss Price: 64.440
Hierarchical Take-Profit & Stop-Loss Protection Strategy
1. First Target Level: 65.950
Half of the position will be closed when price reaches the first target. Move stop loss to break-even to lock in profits and remove risk on the position.
2. Second Target Level: 67.000
Half of the remaining position will be closed when price reaches the second target. Raise the stop loss further to secure accumulated floating profits.
3. Third Target Level: 68.155
Half of the remaining position will be closed when price reaches the third target. Adjust stop loss protection again to maximize returns from the intermediate trend.
The final small portion of the position will be held flexibly, following the trend, with dynamic stop-loss adjustments based on real-time price action.
Risk Warning
1. Commodity futures trading involves high leverage and substantial market volatility. Price fluctuations may result in partial or complete loss of trading capital.
2. Historical price performance and trading plan logic do not guarantee future profitability. All trading setups have probabilistic limitations, and no strategy achieves a 100% win rate.
3. Unexpected macroeconomic data releases, US dollar index swings, precious metal inventory reports, geopolitical events and large institutional order flow may trigger price gaps and slippage, leading to execution away from your predefined stop-loss and take-profit levels.
4. Trades with a high risk-reward ratio typically carry a lower win rate. Do not over-leverage or allocate excessive capital to any single trade. Strict capital management is mandatory.
Disclaimer
This trading plan is for educational and reference purposes only. It does not constitute investment advice, trading recommendations or any solicitation to execute trades. All trading decisions must be made independently by the reader, and all trading profits and losses are the sole responsibility of the reader. The author accepts no liability for any losses incurred from using this trading plan. Trading futures products poses significant risks to your capital. Please trade responsibly.
Silver: A Case for a Fall to $30Chart
Price is currently testing the orange centerline again.
This time, we will see a decline if price can't open & close above it.
CCI and RSI, both show a case for a bear market in this weekly chart. Only MACD-V is signalling a tiny hope for a further increase in price.
Overall the chart tells a Bear-Story and the fundamentals support it.
Fundamentals
SUMMARY
Silver still has room to fall.
Industrial demand is weakening, physical market pressure has eased, investors remain heavily positioned, and high real interest rates make holding silver expensive. The supply deficit provides support, but it may not be strong enough to defend the current price.
---
And here's the story behind:
Silver climbed to $121.60 an ounce after a spectacular surge driven by retail enthusiasm, investment inflows, and a shortage of readily available metal in London. It was the kind of move that attracts headlines, excites late buyers, and makes almost any price seem reasonable. But markets built on excitement eventually meet reality.
Silver now trades near $68. That looks cheap beside the peak. But the peak is the wrong benchmark. The real question is whether current demand can justify a price that remains far above the levels seen before the buying frenzy. Right now, the answer is not convincing.
Total silver demand is expected to decline by 2 percent in 2026.
Industrial fabrication, the largest source of demand, is forecast to fall by 3 percent to a four year low. Jewellery and silverware consumption remain weak because high prices discourage buyers. Indian demand has also softened, showing that even a substantial correction has not restored physical buying.
Solar manufacturers face an especially powerful incentive to use less silver or replace it with cheaper materials. When one input becomes painfully expensive, engineers do what engineers have always done. They find a way to reduce it. That process may be gradual, but the direction is clear.
The shortage story has weakened as well.
Metal has returned from the United States, investment funds have reduced holdings, and more silver is available in London vaults. Lease rates have normalized. The conditions that helped create the previous squeeze are no longer as severe.
Then there is speculative positioning.
COMEX traders still hold a large net long position representing roughly 134 million ounces. That is almost three times the projected annual market deficit. If confidence fades, the liquidation of those positions could overwhelm the price effect of the physical shortage.
Interest rates add another problem.
Silver pays no income. With ten year real Treasury yields above 2 percent, investors are paid handsomely to hold assets with far less volatility. If the Federal Reserve keeps rates elevated or raises them again, silver becomes harder to justify at premium prices.
The bullish case cannot be dismissed.
The market is still expected to record a deficit of about 46 million ounces. Mine supply is forecast to decline, and renewed investment demand could tighten the market again. A weaker dollar, falling real yields, or another rush into precious metals would also support prices.
But, facts are facts.
Silver does not need terrible fundamentals to fall. It only needs fundamentals that fail to justify the remaining premium. With industrial demand weakening, physical liquidity improving, and financial conditions staying restrictive, that risk is real.
The conclusion is straightforward.
A further decline over the next three to twelve months is fundamentally plausible. The bearish case is not without risk, but the balance of evidence suggests that silver may still have more excess to surrender before durable value buyers return.
I appreciate your feedback, even if it's only a like, thank you.
September 7–13: Silver Weekly Forecast: Watchout for 65 & 70Silver enters the week with the model equilibrium at 65.45-65.88, slightly below the 66-67 area seen in the earlier forecast.
The weekly distribution remains wide, with the main predictive boundaries at 67.59 above and 63.31 below.
Upside Levels
The first major upside test is the Upper Predictive Rail at 67.59.
A sustained move above this level would put 68.45 in focus, followed by 70.16.
The upper extreme is 72.73. Movement toward this level would represent a larger expansion into the upper end of the weekly forecast range.
Downside Levels
The first downside level is 64.17, just below the equilibrium area.
The more important level is the Lower Predictive Rail at 63.31. A sustained break below this level would bring 61.60 into focus.
The lower extreme is 59.89.
Weekly Decision Map
Upper Decision Level: 67.59
Upside Path: 68.45 -> 70.16
Upper Extreme: 72.73
Equilibrium: 65.45-65.88
First Downside Level: 64.17
Lower Decision Level: 63.31
Downside Path: 61.60
Lower Extreme: 59.89
Weekly View
Silver's main weekly balance range is 63.31-67.59, centered around the 65.45-65.88 equilibrium.
Acceptance above 67.59 would shift focus toward 68.45 and 70.16.
Below 63.31, the forecast range opens toward 61.60.
The key levels for the week are therefore 67.59 on the upside and 63.31 on the downside, with 65.45-65.88 remaining the central reference area.
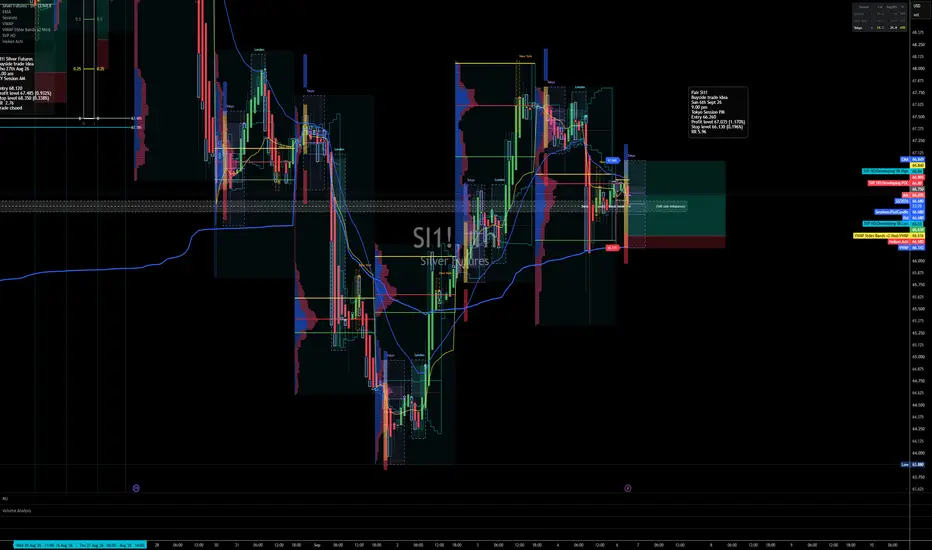
Long trade
📊 SI1! SILVER FUTURES — POC / VALUE READ
Sunday, 6 September 2026
Entry Time: 9:00 PM NY Time
Session: Tokyo Session PM
Direction: 🟢 Buyside
Entry: 66.260
Target: 67.035 (+1.170%)
Stop: 66.130 (0.196%)
Planned RR: 5.96R
POC / Value Structure
The chart shows Silver trying to rebuild after a sharp downside leg and then a recovery back into the lower-middle portion of the active value structure.
Key visible references are approximately:
Developing VAL: ~66.60
Developing POC: ~66.80
Developing VAH: ~66.84–66.85
Mod VWAP: ~66.61
Broader VWAP / lower structural support: ~66.25
Entry: 66.260
Target: 67.035
Your entry is therefore taken close to the broader VWAP / lower support base and below the developing POC, which is constructive for a value-reversion long.
Why the Buyside Idea Has Logic
Price already completed a deep sell-side run before recovering.
The entry sits close to the lower support/VWAP region rather than chasing at a premium.
The developing POC and VAH are above entry, creating a natural sequence of upside magnets.
The 1H structure shows price stabilising after the selloff and beginning to reclaim value.
If price can hold above the lower support and rotate through POC, the target becomes much more realistic.
This is best viewed as:
lower-value reclaim → POC migration → VAH acceptance → external-liquidity continuation
Expected Route
66.13–66.26 support
→ 66.60 Mod VWAP / VAL
→ 66.80 POC
→ 66.84–66.85 VAH
→ 66.95
→ 🎯 67.035
The key confirmation is not simply holding the entry.
It is whether price can reclaim and accept above the 66.60–66.80 value cluster.
SNAP / POC Path
MAP → entry positioned around lower VWAP/support after sell-side delivery
RAID → downside liquidity already worked beneath the recent range
RECLAIM → price must recover 66.60+
SHIFT → bullish internal structure above lower value
CONFIRM → POC reclaim around 66.80 + sustained bullish pressure
EXECUTE → 66.260
DISPLACE → 66.60 → 66.80 → 66.85
PAY → 🎯 67.035
Main Risk
The main weakness is that the trade is being taken before full POC reclaim.
So the long is strongest only if price quickly builds acceptance above the value cluster.
If price instead loses 66.13, the recovery thesis is invalidated, and another sell-side rotation becomes possible.
Final Read
This is a solid discount-to-POC buyside recovery model.
The strongest confluence is:
lower VWAP/support entry + prior sell-side delivery + POC overhead + VAH target path
Primary support: 66.13–66.26
POC magnet: ~66.80
VAH: ~66.84–66.85
Primary PAY: 67.035
A lower value indicates the location. POC reclaim gives the confirmation. VAH acceptance opens the path to PAY.
@SNAPTradingFramework
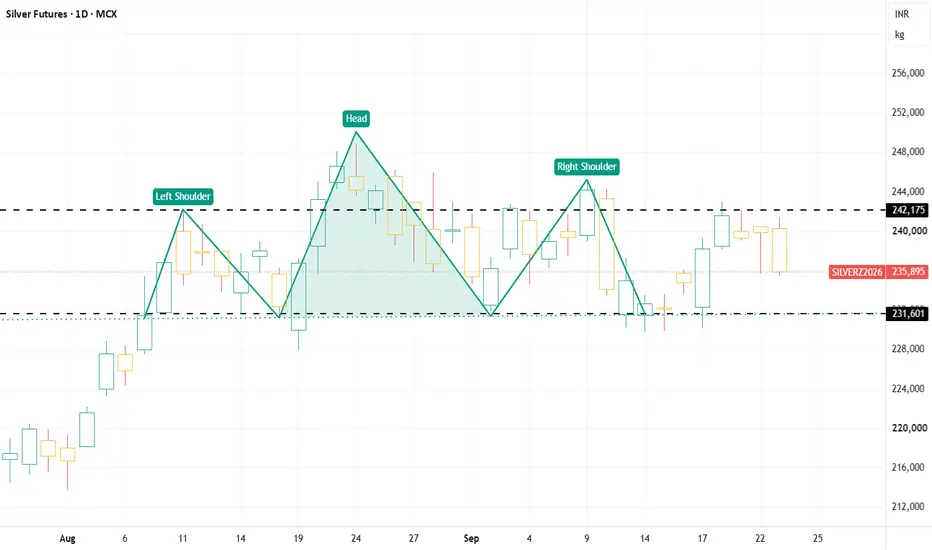
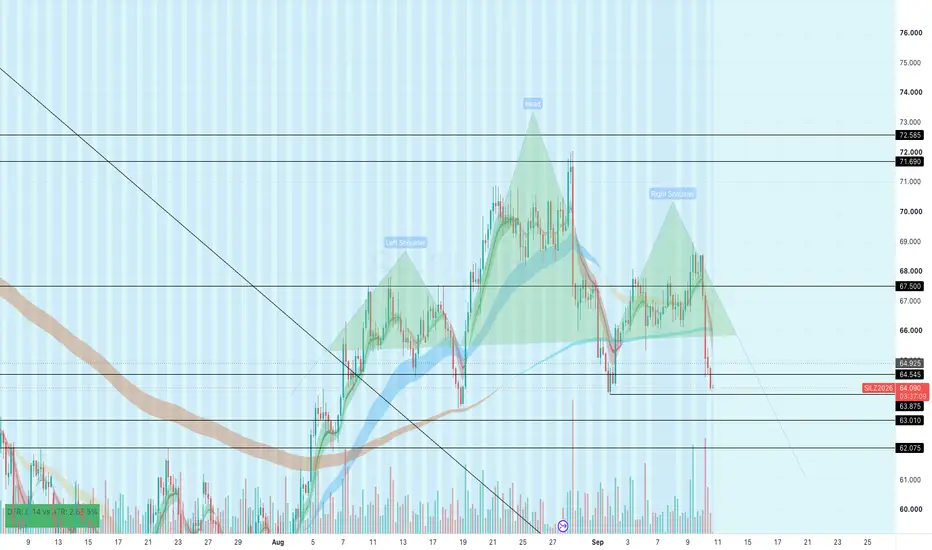
4hr Head and Shoulders SilverPossibly the most broadcast-able head and shoulders is developing in Silver on the 4 hr chart. While my last post was bullish on an inverse head and shoulders in silver, that chart looks to be deteriorating quickly.
At this point $66.18 or thereabouts is the line in the sand. If broken significantly it means that the upward sloping trend line in white has broken and it's more likely that a downtrend develops.
However as noted, this is possibly the most broadcasted head and shoulders ever seen. It's so obvious on the chart that it makes me feel like I'm being watched.
We'll see how this plays out.
Silver Weekly Weakly to $44.00?Silver returned above the 0.236 Fib on our extension, a move that generally indicates that we re-enter our short position and load up again with a stop loss at $72.91.
Because silver sat around the 0.50 Fib for months and didn't meaningfully crash through it's possible that we'll see silver just mess around between these levels.
However, our general thesis is that until silver breaks through $72.91 and invalidates the weekly Fib extension, it's possible it's headed for $44.40. This could be achieved by a broad market pullback causing broad selling. With Warsh likely to hike 0.25% at the next meeting this could cause a little market chaos even though Bessent is out there to keep a lid on the long-end. I believe that by the end of the year the Fed will cut 0.50% at least, so by the end of the year we'll have a net 0.25% cut on the books. However, between now and then it could get wild.
Bullion bulls say that the bottom is in. Podcasts, traders, furus are all onboard. More regular Joe's are waking up to bullion being the last life raft. However, unlike the gentlemen on the Titanic, the rich managers on Wall Street are more than happy to wait for you to load the life raft, drop into the cold Atlantic, flip, and then get in themselves at a much lower price as you drown in the cold depths.
While the $44.00 target is excessively bearish, it is in the chart. I wouldn't be surprised at all if silver were to wipe out most believers before turning higher. As stated, above $72.91 this Fib is toast. As of right now however it's working as intended.
On a much shorter 4-hr timeframe the contract HAS to move up from right here ($64.50) and start re-igniting an uptrend. If not, then my 4-hr thesis that we just had a Valley Bridge pattern in silver will be bunk and the weekly Fib trend is more supported.
Potential Head and Shoulders 4hr SilverWe have a potential Head and shoulders forming in Silver should this hold.
So far my original 4hr thesis has played out well but the drop this morning is definitely confidence shaking when 2 days of gain is wiped out in an hour.
Like I said I'm a bull above $63 but I'm watching with right stops on breakdowns. Be prepared to take some profits to lock in gains as this market is doing its best to flip the life raft before sailing away.
Silver Futures: This Bullish Pattern Hints At MoonshotCorrective structure in silver futures has built a Falling Wedge Bullish pattern
All parameters set perfect:
-converging trendlines (yellow) shaped perfect wedge
-volumes down from top to bottom
Price already broke above the pattern and it was confirmed
both by volume increase and RSI breakout into bullish area
Conservative target is aimed to revisit the all-time high of $121.8
which is 78% away from current price
Invalidation area is set below the bottom of the pattern at $55
I added Volume Profile indicator to spot the largest barrier within $74-81 range
where the next largest volume on futures was traded
This video is about a continuation of the E mini which went loweIt's Tuesday the second. I wanted to talk about the issues that can very quickly change the outcome of your trades and I wanted to emphasize that this is an important aspect on how you take your profits and how you stay in markets when the markets may be telling you that you may be on the wrong side of the trade. there's a guy I who's well known in the markets and he runs shadow stats to give you a more realistic representation that is almost always different from the Federal Reserve and other sources of information. I used to subscribe to him for years but it was two mathematical for me so I stopped but any time I see him commenting on the market I make sure I watch what he's talking about inflation to his calculations is 20% plus that is not good I can't remember his name but if you look for Shadowstats and get the gist of what's going on and it'll give you a different perspective from the federal Reserve's analysis of the market
4-Hr Last Gasp for Silver? I just published my bearish outlook for Silver that is in play.
I'm publishing this chart as the bullish antithesis to that weekly chart. If silver were to invalidate the weekly chart, it needs to start it's chance right now.
Our Fub extensions show that silver has returned to the 0.236 level, indicating an automatic re-entry long on this chart. This Fib extension was clean, surpassing one internal and one external peak. It then took out a second external peak in the rally. That's a fairly decent move and a good chart. I hesitate because the ferocity with which it took out the the same levels to the downside usually doesn't indicate good things.
However what gives me a sliver of hope is that the pattern setup within the past week or two looks like a Mountain/Valley Bridge, one of my favorites. It probably has an official name somewhere but I don't know it. When there is a nearly vertical move, followed by a nearly horizontal consolidation, followed by a nearly equal vertical move in the opposite direction this gives me the Mountain/Valley Bridge. Like a bridge strung between two mountain peaks or at the bottom of a valley. Silver ran up, went sideways almost perfectly, tried to escape during Jackson Hole and got pounded straight down. This sets up the Bridge. The question is did the Jackson Hole spike up invalidate the pattern? Usually the bridge will have semi-equal legs up and down, and then the price will rebound to take out the bridge. If that's the case then I expect silver to get through $72.91 in the next two weeks or so.
This Bridge along with the Fib give me a clear entry and stop-loss setups. Losing $63.26 will show that both the Fib and the Bridge failed and it is likely that silver continues lower, as shown in my weekly chart.
The Fib entry was $65.68 while the Mountain Bridge entry would be around $64.50 (there is no exact number). If we wanted confirmation of both we could use a regular Fib extension which would put an entry at around $66.31 as of the current low ($64.54) which would become our stop-loss upon entry.
We would be looking for $73.00 as the profit target.
SILVER: just as expected!Primary Scenario
ADJUSTMENTS: At this stage, we see silver in the final phase of a corrective upward move. Once this high is reached, we anticipate a significant decline into our blue Long-Term Entry Range ($39.41–$25.75). After a long-term bottom is established here, a strong upward move is likely to follow.
Alternative Scenario
In our alternative scenario, price could soon break above resistance at $90.11, initially setting a new intermediate high before a significant downward move is also likely (probability: 30%).
Long-Term Outlook
ADJUSTMENTS: Based on the substructure in the weekly chart, it appears the corrective rally in silver is also nearing completion on a higher level, with price expected to correct below support at $55.00. Alternatively, there’s a possibility of an imminent rally that could push silver above resistance at $90.11 to a new all-time high (probability: 30%).