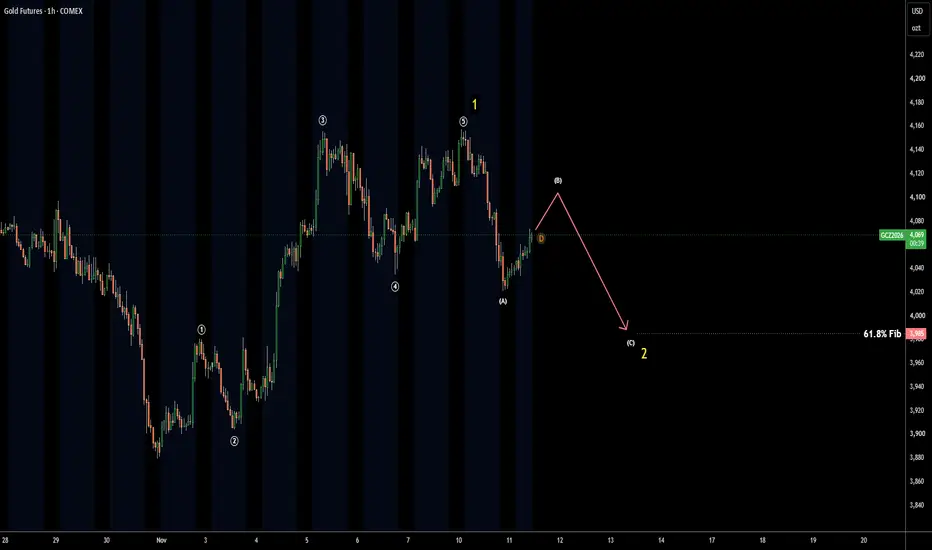
Gold Hourly Chart: First Correction gold has same structure as silver on hourly
it only looks more smooth as large players are there
compared to more volatile silver
wave has been retraced within the first correction of wave
the latter has wave A done and wave B in progress
wave C might follow to hit the classic 61.8% Fibonacci
Sorry, this is only available to registered users
MCX provides data to our registered users only, so to get it you'll need to sign up for a TradingView account.
Peers for comparison
Gold 4H: Lower Highs Since 4,755 - Bears in Control Below 3,985Gold has been in a clean 4H downtrend since the August top at 4,755.
STRUCTURE
- Top: 4,755 (Aug 24)
- Lower highs: 4,558 (Sep 3) > 4,440 (Sep 18) > 4,259 (Oct 2) > 4,158 (Nov 9)
- Lower lows: 4,329 > 4,273 > 4,143 > 3,989 > 3,879 > 3,857 (Nov 12)
The early-November rally printed a bullish CHoCH a
MGC 15M: Watching the Retest After a Strong RecoveryGold has staged a sharp recovery following the earlier selloff. On the 15-minute chart, price formed a base, reclaimed 3,892.08, and pushed through 3,909.80 before trading above 3,920.50.
My focus is whether buyers can defend the latest breakout area and extend this recovery toward 3,943.60.
Prima
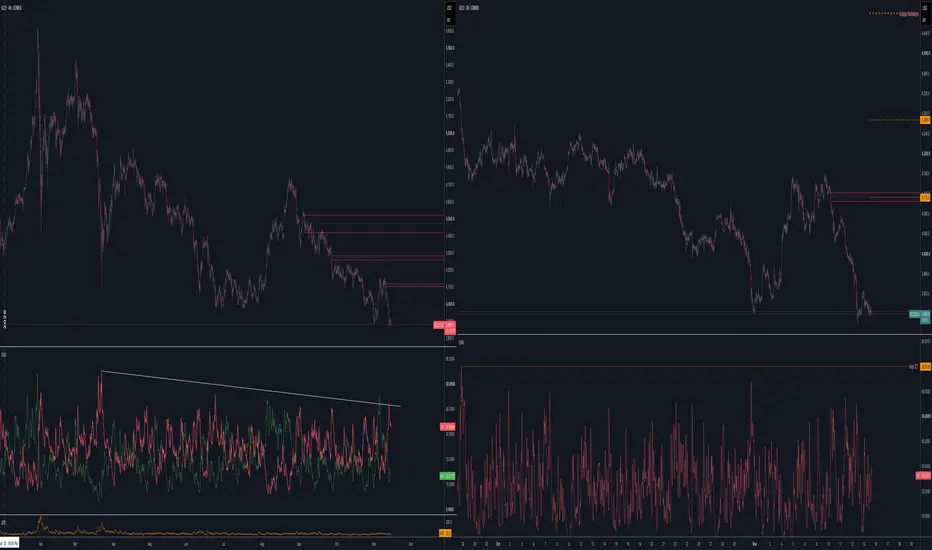
Staring into the Volume VoidBetween 3900 and 3500 the volume profile shows a void where relatively few trades have taken place. When price enters this void, it can traverse across it in the downward direction just as easily as it did on the way up when it created it. Price has closed below 3900 for 2 days and therefore has e
Will Hawkish Fed Bets Break Gold Futures Below $4,000?Macroeconomics and Economics
Gold futures slipped below the critical $4,000 threshold on November 12, 2026, touching an intraday low near $3,968. Hotter US October inflation data fueled market bets on a December Federal Reserve interest rate hike. Traders now fully price a 25-basis-point increase,
Gold 1H: Swing low broken, pinned under 4,000 and a daily FVGGold is around 3,991 after breaking the 4,020.8 swing low, and it's stuck just under 4,000. Tonight the question is whether the 4,005.9-4,020.8 daily gap caps it or buyers take it back.
Market structure
Daily trend is down: price is below the 20, 50 and 200-day, and the bounce to 4,157.7 faile
Gold Futures Rebound – Is a Bullish Reversal Taking Shape?Gold futures are showing signs of a strong recovery after a significant downward move. Buyers have stepped in, pushing price back toward the $3,920 resistance area.
I’m watching closely to see whether bullish momentum continues or sellers step back in.
Key levels to watch:
* Resistance: $3,920–$3
Bull Div Delight -GCGC has dropped roughly 400 pts lower without printing a HH on sell pressure on 30m.
For November, GC has dropped over 300 pts from monthly high yet has not printed higher high on sell pressure for intra day tfs since Nov 10, and before that Sep 27.
It's a heavy fix to the downside, but a discount
The Levels to Watch in Gold Futures After Its Rise & FallEarly this year, Gold staged a powerful move higher, driven by persistent inflation narratives, central bank demand, and a steady bid for safety. After a run like this, price becomes less about the story, and more about the levels.
Here’s how to frame it.
📌 1. The Breakout Zone (Now Support)
Gold Is Bearish-Neutral, Waiting For CPI & PPI NewsIn this Weekly Market Forecast, we will analyze Gold for the week of Nov 9 - 13th.
Gold (XAU/USD) enters the coming week with a mixed-to-cautious outlook, leaning slightly bearish-to-neutral as traders await key US inflation data (Consumer Price Index and Producer Price Index).
Personally, I am wa
See all ideas
A representation of what an asset is worth today and what the market thinks it will be worth in the future.
Sorry, this is only available to registered users
MCX provides data to our registered users only, so to get it you'll need to sign up for a TradingView account.
Displays a symbol's price movements over previous years to identify recurring trends.
Frequently asked questions
One way to gain exposure to GOLDV2021 is through a broker that offers futures. Before trading, make sure you understand how the product works and the risks involved.
You can trade GOLDV2021 directly from TradingView:
– Choose a broker: Explore our supported trading partners and pick one that fits your needs
– Compare options: View available brokers side by side to evaluate fees and features
– Connect your account: Open Supercharts, click "Trade", select your broker, and log in
– Start trading: Place orders directly from the chart
Tip: If you're new to trading, try paper trading first — it lets you practice strategies in real market conditions without risking funds.
You can trade GOLDV2021 directly from TradingView:
– Choose a broker: Explore our supported trading partners and pick one that fits your needs
– Compare options: View available brokers side by side to evaluate fees and features
– Connect your account: Open Supercharts, click "Trade", select your broker, and log in
– Start trading: Place orders directly from the chart
Tip: If you're new to trading, try paper trading first — it lets you practice strategies in real market conditions without risking funds.
The nearest expiration date for GOLDV2021 is Oct 5, 2021.
Futures contracts expire on predetermined dates. As expiration approaches, many traders roll positions into the next contract to maintain exposure to the market.
Key metrics to watch near expiration:
• Volume and liquidity: Trading activity often shifts to the next contract month
• Open interest: Falling open interest may signal positions being closed or rolled forward
• Forward curve: Differences between contract prices can help identify market structure, including contango and backwardation
Explore the GOLDV2021 chart to monitor active contracts and contract-month activity.
Futures contracts expire on predetermined dates. As expiration approaches, many traders roll positions into the next contract to maintain exposure to the market.
Key metrics to watch near expiration:
• Volume and liquidity: Trading activity often shifts to the next contract month
• Open interest: Falling open interest may signal positions being closed or rolled forward
• Forward curve: Differences between contract prices can help identify market structure, including contango and backwardation
Explore the GOLDV2021 chart to monitor active contracts and contract-month activity.