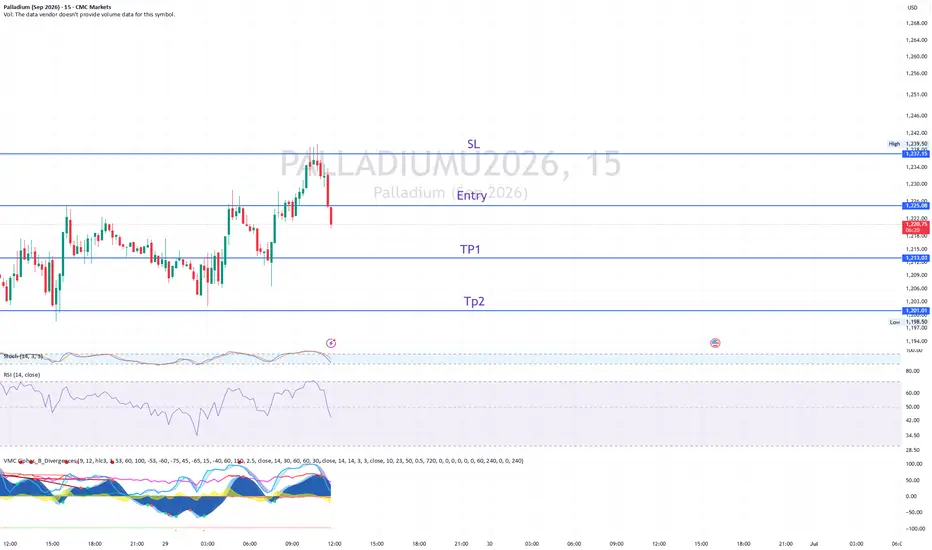
Palladium — Quick Signal Pro: BUY (15m, all timeframes aligned)Trend score: +2.27 (strong bull) — Daily +1.7, 4H +2.8, 1H +1.8, all pointing up together. No conflicting signals.
📍 Entry: 1224
🟢 TP1 (50%): 1230.5
🟢 TP2 (full): 1237
🔴 SL: 1217.5
Plan: take 50% at TP1, move stop to breakeven, let the rest run to TP2 with the trend. Will update this idea with the outcome (✓ TP2 / ↔ BE / ✗ SL), win or lose.
Not financial advice — educational example of the indicator in action.
Palladium Futures
No trades
No trades
In-depth trading ideas
Palladium — Quick Signal Pro SELL (15m)Quick Signal Pro fired a SELL on Palladium (15-minute chart).
Higher-timeframe trend leaning bearish — Daily −1.3, 1H −1.0.
📍 Entry: 1222.75
🟢 TP1 (50%): 1215.08
🟢 TP2 (full): 1207.41
🔴 SL: 1230.42
Plan: take 50% at TP1, move stop to breakeven, let the rest run to TP2.
Will update this idea as it plays out — outcome posted either way (✓ TP2 / ↔ BE / ✗ SL).
Is Palladium's Rally a Squeeze or a Structural Trap?Palladium sits at a genuine inflection point. The metal trades near $1,700 an ounce after a rally of more than 80% in 2025, driven by supply fears and a US trade shock rather than by industrial demand growth. The investment question is unusually binary: an acute near-term supply squeeze is colliding with a structural long-term threat to palladium's core market. How those two forces resolve determines whether the rally lasts.
The bull case rests on supply concentration and trade policy. Russia supplies roughly 40% of the world's palladium and South Africa another 38%, leaving Western buyers exposed. In February 2026, the US imposed a preliminary 132.83% anti-dumping duty on unwrought Russian palladium, effectively closing the American market to its single largest source. North American fabricators must now compete for South African and recycled metal, creating a premium, two-tier market for non-Russian material. Trump-era moves to end the EV tax credit and relax tailpipe rules further prolong the gasoline-engine demand that palladium depends on.
The bear case is structural and harder to escape. More than 80% of palladium demand comes from catalytic converters, and every battery electric vehicle sold permanently removes that need. The market has run in deficit since 2012, but the World Platinum Investment Council and others now project a shift toward surplus between 2026 and 2028 as EV penetration rises and recycling expands. The forecasts capture the uncertainty: 2026 targets run from Heraeus near $950 to Bank of America at $1,725, with a Reuters survey averaging about $1,263. That dispersion is the real signal, because it reflects a genuinely binary outcome.
The honest read is that palladium is a tactical, event-driven trade rather than a structural holding. The tariff regime and concentrated supply can produce sharp spikes, particularly in certified non-Russian metal, and the hybrid vehicle bridge offers near-term support. But the secular direction points the other way, toward EV-driven demand destruction and an eventual surplus that caps the long-term case. The swing factors are the pace of battery electric adoption against the durability of the trade remedy. Trade palladium for its supply-shock volatility with tight risk control, and do not mistake the current squeeze for a lasting repricing.
(TF 1D): Palladium. Wait for 1650 TriggerIn the long-term outlook, Palladium looks long. In the medium and short term, the price has to get confirmation before trend continuation.
1. Global Trend: Bullish. Medium-term: Bearish. Short-term: Bullish. The price is trading around the Support/Resistance zone which has existed since Mar. 2019. Along the distance, this S/R zone played out as an important targeting point for price movements; therefore, it is assumed that the current price fluctuations around the zone are the big capital accumulating a position.
2. The exact next movement will be seen after the price either breaks and closes above 1650 or below 1480 . It is possible to see a squeeze to the opposite side of the movement, so be aware of setting the stop-loss aside the stop-limit orders on a breakout—because the price can do a quick turnaround.
3. There are significant liquidity pockets which the HFT robots can set as targets, so I will set 1300 and 1150 as the targets for short and 1900 , 2150 , and 2350 as targets for long.
4. The price has recently corrected to a healthy 0.618 Fibonacci; therefore, I assume that the probability of long continuation might overwhelm the short continuation, but with one (1) important BUT: the price has to close 1 or 2 1D candles above 1650 . Otherwise, the same scenario applies for short, but with closes below 1480 .
# - - - - -
Long Scenario:
🟢 Entry (LONG): Trigger: 1650
🔴 Stop: 1415
🟡 Target 1: 1900
🟡 Target 2: 2150
🟡 Target 3: 2350
🔵 Risk/Reward: 1:3.13
Short Scenario:
🟢 Entry (SHORT): Trigger: 1480
🔴 Stop: 1615
🟡 Target 1: 1300
🟡 Target 2: 1150
🔵 Risk/Reward: 1:2.37
Good Luck! ☺️
# - - - - -
DISCLAIMER: Not financial advice. Everyone must make trading decisions at their own risk, guided only by their own criteria and strategy for opening or not opening a trade.
# - - - - -
P.S. What do you think where the Palladium will go? Leave your thoughts below 👇
Palladium Long#Invest #Palladium #PALL #PA #XPDUSD
A weaker dollar after soft US inflation data has increased expectations for a Fed rate cut
US President Trump's announcement of tariffs of up to 100% on India and China to pressure Russia is increasing demand for safe haven assets, including palladium
Palladium prices have lagged behind other precious metals
Palladium production is gradually declining due to the depletion of deposits in South Africa, the US and Canada.
Recycling from old cars only partially compensates for the deficit
Despite the growth of electric vehicles, hybrid vehicles with internal combustion engines retain market share, and this supports demand for palladium for catalysts
New areas of demand:
China and India invest in hydrogen infrastructure. Palladium is used to purify hydrogen
Innovative technologies for using palladium to synthesize ammonia without CO₂ emissions
Supply reduction:
Producers Anglo American, Wesizwe Platinum and others are cutting investments due to low prices
Production in Russia is stable, but growth is only possible with the launch of the Chernogorsk deposit in 2026
Palladium is attractive as an alternative to gold due to its growth potential
From a technical point of view
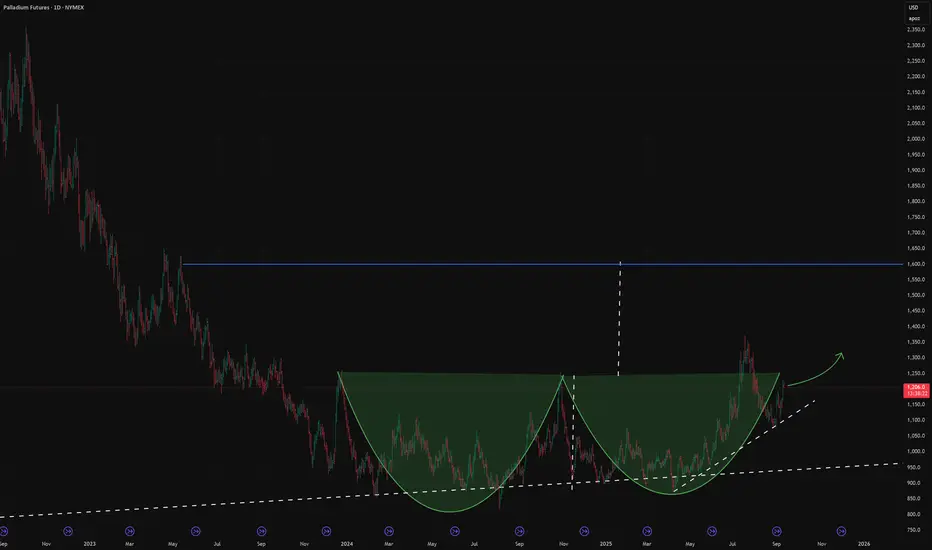
-formation of a double bottom.
-There was already an exit, a false exit upward.
-Now a cup with a handle is being drawn.
How to participate in the growth?
-Buying a futures contract (US NYMEX ticker PA)
-buying through an ETF (for the US, ticker PALL).
*The ticker may be different on the stock exchange in your country
You can also look at companies with exposure to palladium
Norilsk Nickel, Sibanye-Stillwater and Anglo American
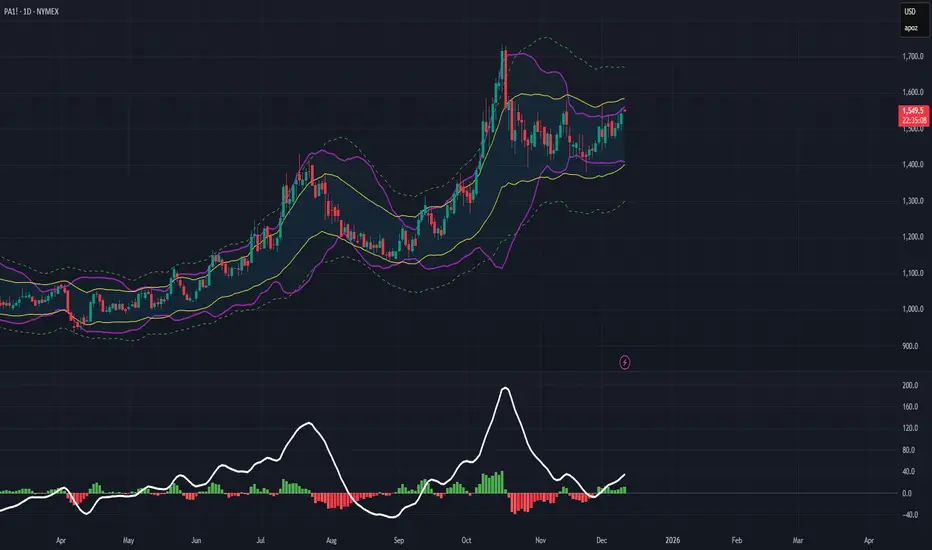
Palladium’s Bullish Outlook Amidst a Market FakeoutPalladium has emerged as the second strongest precious metal this year, demonstrating notable resilience. Over the past three weeks, however, its price has experienced a retracement, revealing two potential weekly demand zones on the chart. An analysis of the Commitment of Traders (COT) report indicates that this pullback is not driven by non-commercial traders, who are actually increasing their positions. This discrepancy suggests that the recent decline may be a false move by the market. Consequently, I am considering placing limit orders within the two identified demand areas to capitalize on a potential rebound.
✅ Please share your thoughts about PA1! in the comments section below and HIT LIKE if you appreciate my analysis. Don't forget to FOLLOW ME; you will help us a lot with this small contribution.
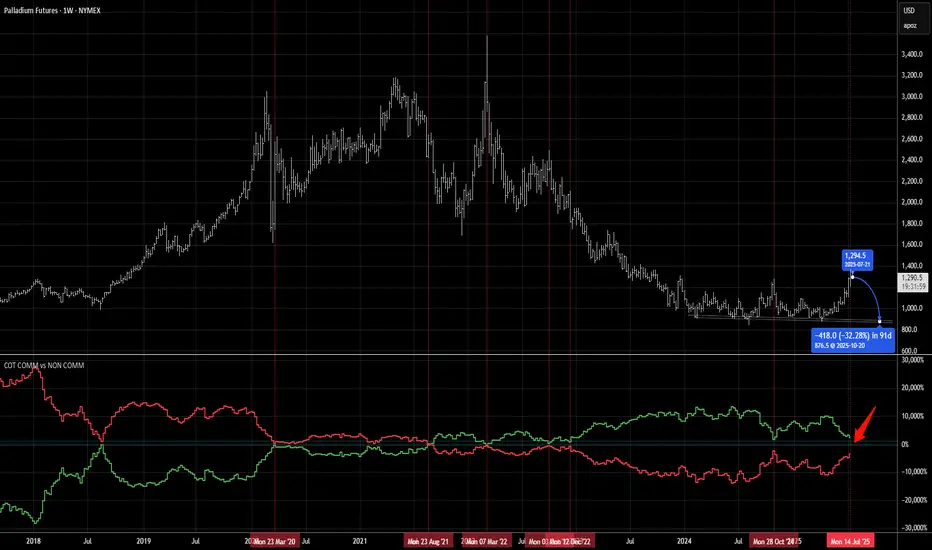
Palladium Crash Incoming; 30%+ Drop ExpectedPalladium is indeed a very small market and hence exhibits very unique and highly predictable COT patterns. When the producers begin to heavily sell after large price rallies, XPD is destined for a fall back down into its intermediate term supply/demand zone. Which in this case represents the $850-$900 range. So a nice 30%+ down swing over the course of several months can be predicted based on previous builds in the NYMEX COT report.
There is absolutely ZERO material reason for the PGMs to have staged such a large rally these last few months other then as a liquidity fueled move coupled with massive price divergence with gold. The PGM market could not have worse demand fundamentals, especially for Palladium which is mostly used for automotive use as catalytic converters in gasoline powered vehicles (ICE). With the largest customer of the metal being China who is in a secular economic slowdown, then the US/EU where vehicle prices have exploded. The market is well supplied especially as EVs take over in dominance across Asia and emerging more in western markets which require no such catalytic functions.
Market Call: We are scaling into short positions on XPD anticipating a market convergence back to its normally supplied price level of $875/oz.
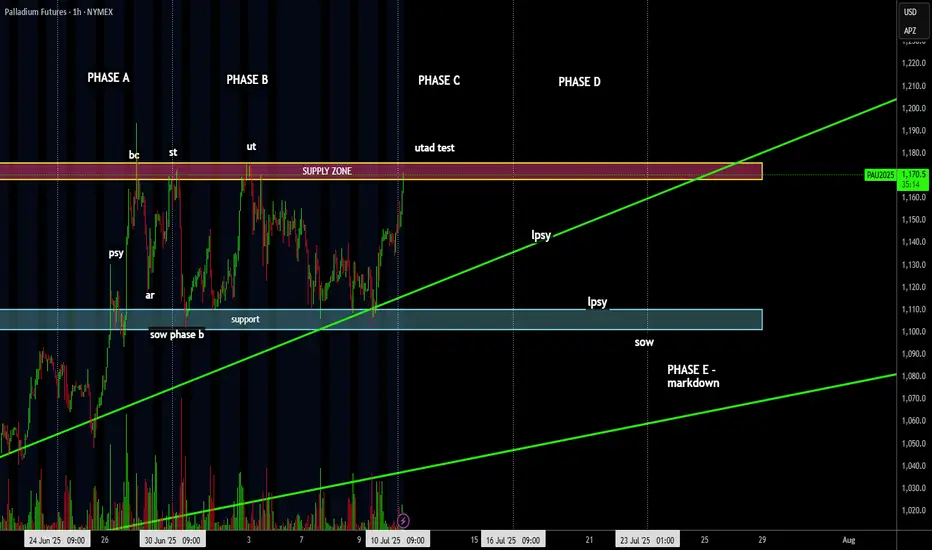
following the distribution phase - palladium futures. PA1!following the wyckoff distribution phase for palladium.
after a markup on palladium for the past months it seems that correction is about to happen soon.
just following the chart, waiting for the markdown to begin.
for the brave of us, this one seems like a an entry point to sell palladium. right now. at the UTAD test.
Palladium Futures (PA1!) Approach Key Supply ZonePalladium Futures (PA1!) Approach Key Supply Zone: Is a Reversal Imminent?
June 30, 2025 – Palladium Futures (PA1!) opened the new trading week with a bullish candle, reaching a fresh high at 1,161 after last week’s uncertain Doji rejection near 1,193.5. The metal is now approaching a critical supply zone between 1,199 and 1,255, where traders should watch for potential reversals.
Key Technical Levels in Play
Current Price Action: After a strong push today, PA1! is testing higher levels, but the previous week’s Doji near 1,193.5 suggests hesitation among buyers.
Supply Zone (1,199 – 1,255): This area has not acted as resistance previously, and with price nearing it, a pullback or reversal could be in play.
Daily & Weekly Timeframes: The daily chart shows steady bullish momentum, but the weekly reveals a bearish divergence in Non-Commercial (smart money) positions—raising caution.
COT Report Signals Warning Signs
The latest Commitment of Traders (COT) report reveals interesting dynamics:
Commercials (Hedgers): At their lowest levels since February, suggesting producers are hedging aggressively at these prices.
Non-Commercials (Large Speculators): Still holding elevated positions but showing divergence—price is rising while their net-long exposure weakens.
Retail Traders: Remain bullish, which often acts as a contrarian signal when combined with Commercial hedging.
What’s Next for Palladium?
Given the confluence of factors:
Supply Zone Resistance (1,199 – 1,255): A logical area for profit-taking or short entries.
Bearish Divergence in Non-Commercials: Suggests weakening bullish conviction.
Commercials Hedging at Highs: Indicates potential downside ahead.
✅ Please share your thoughts about CL1! in the comments section below and HIT LIKE if you appreciate my analysis. Don't forget to FOLLOW ME; you will help us a lot with this small contribution.
Upside Bias as Palladium found strong support around $850Palladium has found strong support around $850 and remains above the 200-day moving average (MA).
A bullish RSI divergence has formed on the weekly chart, and $850, previously a resistance level, has now turned into support.
However, a break and close below $850 would negate this bullish setup.
Important changes in the market today1.10.25 days like today are exciting days because are significant markets that are expanding. even though you may miss some opportunities or the markets appear to treacherous to you...
such as the copper Marketeven if you don't take a trade today the market is going to give you an opportunity as a buyer and a seller depending on your Market and if you didn't establish a trade position today don't worry about it because this Market is going to give opportunity to buyers and sellers because it's expanded. I try to show a couple of examples in this video where I gave my opinion on previous days that copper was setting up to go higher.... and I would hope that you would look at the previous video on copper and look at what copper is doing today. generally the best trades are on markets where the price action looks to risky for the Trader that doesn't know how to read for Price action... or even worse... the market looks like a no-brainer trade to the trader who does not know why his not only wrong but he completely assess the pattern incorrectly. I have done that many times in my life I discovered that that kind of thinking is too expensive.... so I had to find tutors and I read... or at least bought many books.... I even went to a practicing well-trained psychologists who specialized in helping Traders... he claimed that he helped some of the most successful traders in the United States. he was about $300 an hour. there is a price to pay for an education. by the way and this is some years ago... the advice that I got from that psychologists ended up being useful but that's psychologist didn't want to see my charts and apparently he was a successful Traders well and I never saw his charts..... and that probably would seem unusual to most people.....the bed actually in the end I was okay with the experience the contracted for 10 sessions and I have no regrets.
PALLADIUM | XPDUSD: Prepare to SELL!Over the next couple of weeks, be ready to sell Palladium on the pullback! This is a ERL to IRL to ERL move in the making! Don't miss it!
Check the comments section below for updates regarding this analysis throughout the week.
Enjoy!
May profits be upon you.
Leave any questions or comments in the comment section.
I appreciate any feedback from my viewers!
Like and/or subscribe if you want more accurate analysis.
Thank you so much!
Disclaimer:
I do not provide personal investment advice and I am not a qualified licensed investment advisor.
All information found here, including any ideas, opinions, views, predictions, forecasts, commentaries, suggestions, expressed or implied herein, are for informational, entertainment or educational purposes only and should not be construed as personal investment advice. While the information provided is believed to be accurate, it may include errors or inaccuracies.
I will not and cannot be held liable for any actions you take as a result of anything you read here.
Conduct your own due diligence, or consult a licensed financial advisor or broker before making any and all investment decisions. Any investments, trades, speculations, or decisions made on the basis of any information found on this channel, expressed or implied herein, are committed at your own risk, financial or otherwise.
This could be the lowLooking at the RUS:PD1! contract:
After completing the three impulse waves (1, 3, 5) upward, Palladium futures entered a steep downward correction, reaching the final Fibonacci level (76.4%). It appears that the price is now forming the first green daily candle in a long time. With an upward-pointing elliptical trendline, this could mark the low. We’ll need to wait for confirmation in the coming trading days. Additionally, Palladium’s bullish seasonality is set to begin soon, suggesting a potentially strong end to the year. Let’s see how it unfolds!
Palladium: Analyzing the Recent Surge in PricesSince the beginning of August 2024, Palladium has experienced a notable surge in value, reaching approximately $1,250 today. This strong bullish rally signals renewed interest in the precious metal, driven by various market dynamics. However, as the price approaches a critical supply area, traders must exercise caution and prepare for potential market reversals.
Price Movement and Historical Context
The recent price increase in Palladium has not gone unnoticed, and it coincides with a historical trend. Over the past five years, data shows that Palladium has typically encountered a reversal in value around this time of year. This historical pattern serves as a vital reference point for traders considering their next moves.
Evaluating Supply Areas and Potential Reversals
As Palladium nears a significant supply area, it becomes essential to analyze price action carefully. Before contemplating any short positions, it is prudent to wait for a clear bearish pattern to emerge. This approach minimizes the risk of entering prematurely, particularly in a market characterized by bullish momentum.
Commitment of Traders (COT) Report Insights
The latest Commitment of Traders (COT) report reveals contrasting positions among market participants. Retail traders appear to be holding long positions, indicating optimism regarding Palladium's future performance. Conversely, "smart money" or institutional investors have begun to build bearish positions, suggesting that they anticipate a potential downturn. This divergence in sentiment may create a volatile environment as both sides adjust their strategies.
The Importance of Patience
In the current landscape, patience is crucial. Rushing into trades without solid confirmation can lead to unfavorable outcomes. By waiting for a clear bearish signal, traders can better position themselves for potential market reversals. This disciplined approach aligns with the principles of risk management and enhances the chances of executing successful trades.
Conclusion
In summary, Palladium's recent rally to $1,250 places it at a critical juncture. As it approaches a historically significant supply area, traders must remain vigilant and analytical. Observing the emergence of a bearish pattern, coupled with insights from the COT report, will be essential in determining the appropriate timing for any potential short positions.
With patience and a strategic mindset, traders can navigate the current market conditions effectively. What are your thoughts on Palladium's trajectory, and how do you plan to position yourself in this evolving landscape?
✅ Please share your thoughts about PA1! in the comments section below and HIT LIKE if you appreciate my analysis. Don't forget to FOLLOW ME; you will help us a lot with this small contribution.
Ducks in A Barrel Long Setups - BTC, SOL, TON & PADISCLAIMER: This is not trade advice. This for educational purposes only to show how I am looking to participate in these markets. Trading involves significant risk, do your own homework and due diligence.
Ducks in a Barrel Weekly-Daily Strategy
LONGS: BTC, SOL, TON
SHORT: PA
LONGS:
The crypto market is overall in a strong up trend based on weekly MA's sloping up. We see that BTC, SOL & TON are undervalued vs the price of Gold and Treasuries, and are oversold on stochastic. If we see a trend change to the upside on the Daily chart, I'll look to long these markets. I admit, I'd like to see sentiment more bearish, as currently sentiment is in the middle of the road. Perhaps one more flush to the downside would create some panic and bearish sentiment, which would make this trade idea even more valid.
SHORTS:
Palladium is in a strong weekly downtrend. Right now we are overvalued vs treasuries, but not yet overvalued vs gold or overbought. I'd like to see this market get overbought & overvalued vs gold to qualify looking for shorts on the daily time frame.
Good luck & Good trading.