Record pump prices: funds buy gasoline, sell crudeUS drivers paid a record for gasoline in September, and the futures market shows where the squeeze really sits. It is in refined fuel, not in crude oil.
The pump. AAA puts the September national average at 4.33 dollars a gallon, 50 cents above the previous September record of 3.83 set in 2023. The
Peers for comparison
Contract highlights
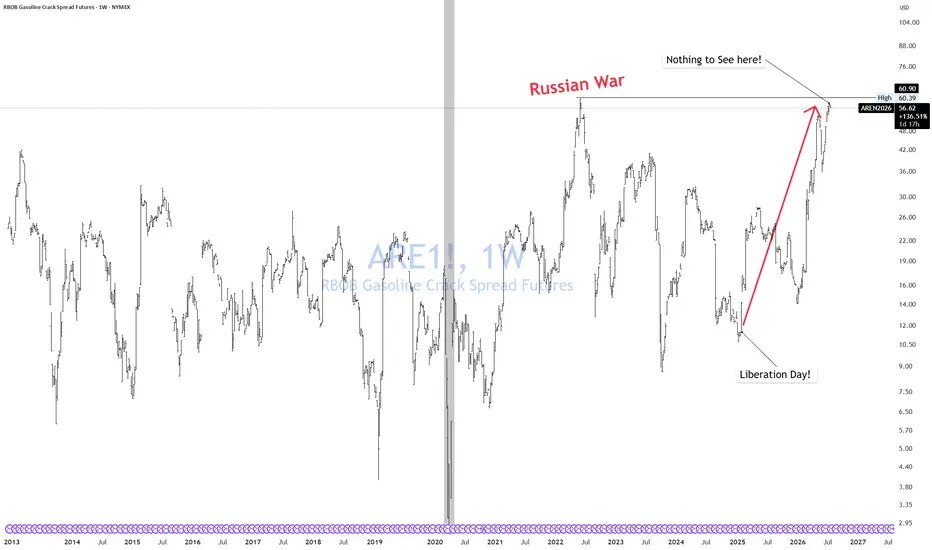
Refining Margins Drive Gas Costs as Crack Spreads Reach ATH 📊 Crack spreads: Refining Margins Drive Gas Costs as Crack Spreads Reach ATH ⛽
📈 Strengths and Catalysts:
Refining margins drive gasoline costs rather than raw crude prices. 📈
Crack spreads are trading well above historical exceptional price levels since February. 🚀
Ongoing war with Iran continues
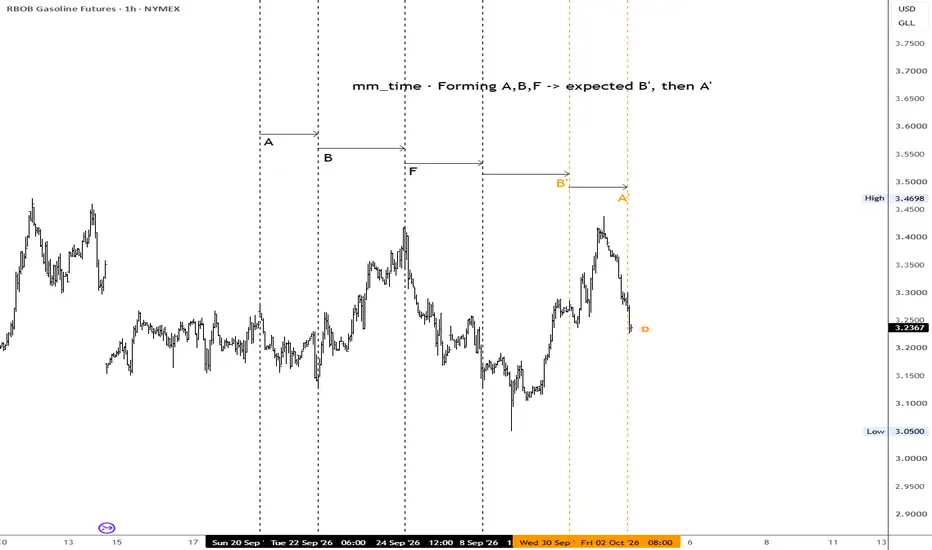
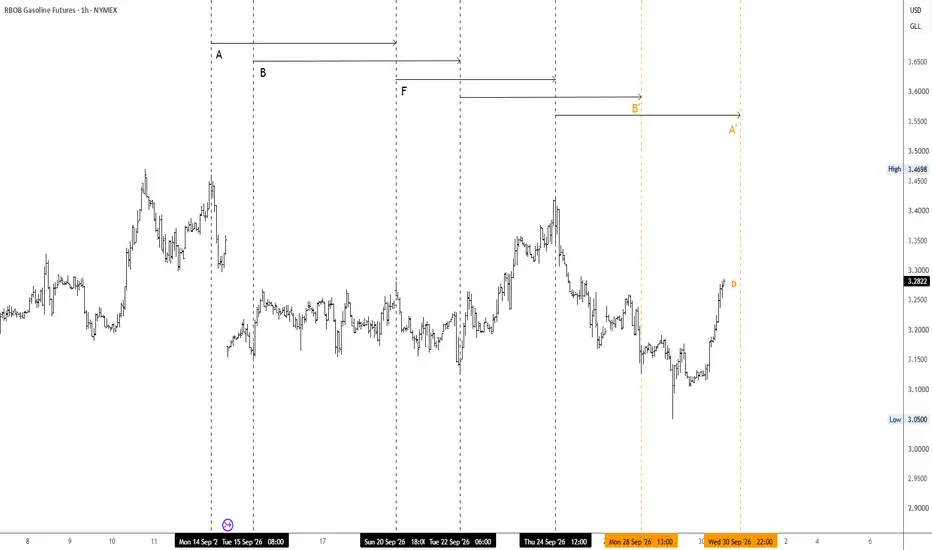
RB Long — RB shrugs off a failed breakdown and reclaims structurThis is a structural pullback play showing resilience, highlighted by a failed breakdown on the 1h trigger. Undeterred by the lack of fresh fundamental catalysts, the setup leans on clean price action and a favorable 1.5R profile to target overhead resistance. We will take this on pure structure giv
Why Are RBOB Gasoline Futures Surging Despite EPA Waivers?Regulatory Waivers Fail to Tame Prices
U.S. gasoline spot prices climbed 87 to 119 cents per gallon across major regional benchmarks in 2026. Environmental Protection Agency waivers expanded butane blending limits to lower pump costs. Yet market fundamentals completely overrode federal regulatory i
RB Long — Failed breakdown on the 1H flips this pullback into a…A pristine 4-hour bullish structure meets fundamental seasonal tailwinds as energy markets price in spring demand. The textbook 1-hour failed-breakdown trigger and robust 2.64R profile provide a high-quality entry for this structural long. We are taking this as the technical geometry and macro seaso
CRACK! Spread.The gasoline crack spread is approaching the same level reached after Russia invaded Ukraine—even though the disruption from Iran is far worse.
This isn’t booming demand. Refineries are already running near full capacity while war, damaged infrastructure and disrupted shipping have created a shorta
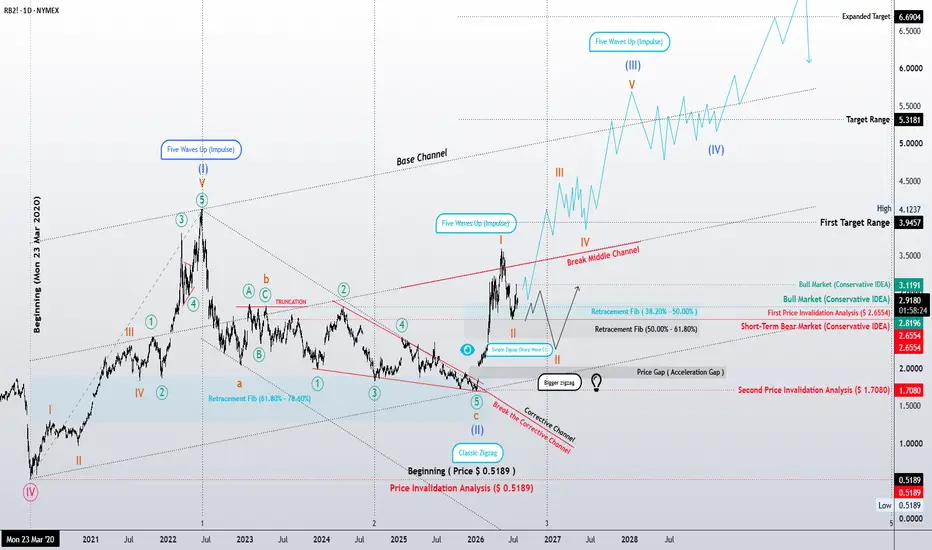
Elliott Wave Analysis | Preparing for Wave (III)?RBOB Gasoline (RB2!) Daily Chart
Following the completion of a Classic Zigzag correction, RBOB Gasoline appears to have broken above its corrective channel, suggesting that the larger bullish trend may have resumed.
My preferred wave count considers Wave (II) complete, with the current advance re
Weekly Chart – Elliott Wave Analysis | Final Supercycle Advance?RBOB Gasoline (RB1!) Weekly Chart – Elliott Wave Analysis | Final Supercycle Advance?
As one of crude oil's primary refined products, RBOB Gasoline has historically maintained a strong structural relationship with the broader oil market. Although its long-term historical data is less complete than
See all ideas
A representation of what an asset is worth today and what the market thinks it will be worth in the future.
Displays a symbol's price movements over previous years to identify recurring trends.
Frequently asked questions
One way to gain exposure to RBZ2017 is through a broker that offers futures. Before trading, make sure you understand how the product works and the risks involved.
You can trade RBZ2017 directly from TradingView:
– Choose a broker: Explore our supported trading partners and pick one that fits your needs
– Compare options: View available brokers side by side to evaluate fees and features
– Connect your account: Open Supercharts, click "Trade", select your broker, and log in
– Start trading: Place orders directly from the chart
Tip: If you're new to trading, try paper trading first — it lets you practice strategies in real market conditions without risking funds.
You can trade RBZ2017 directly from TradingView:
– Choose a broker: Explore our supported trading partners and pick one that fits your needs
– Compare options: View available brokers side by side to evaluate fees and features
– Connect your account: Open Supercharts, click "Trade", select your broker, and log in
– Start trading: Place orders directly from the chart
Tip: If you're new to trading, try paper trading first — it lets you practice strategies in real market conditions without risking funds.
The nearest expiration date for RBZ2017 is Nov 30, 2017.
Futures contracts expire on predetermined dates. As expiration approaches, many traders roll positions into the next contract to maintain exposure to the market.
Key metrics to watch near expiration:
• Volume and liquidity: Trading activity often shifts to the next contract month
• Open interest: Falling open interest may signal positions being closed or rolled forward
• Forward curve: Differences between contract prices can help identify market structure, including contango and backwardation
Explore the RBZ2017 chart to monitor active contracts and contract-month activity.
Futures contracts expire on predetermined dates. As expiration approaches, many traders roll positions into the next contract to maintain exposure to the market.
Key metrics to watch near expiration:
• Volume and liquidity: Trading activity often shifts to the next contract month
• Open interest: Falling open interest may signal positions being closed or rolled forward
• Forward curve: Differences between contract prices can help identify market structure, including contango and backwardation
Explore the RBZ2017 chart to monitor active contracts and contract-month activity.