Peers for comparison


Company info


Headquarters
Vancouver
Founded
2006
ISIN
CA17040B1013
CUSIP
17040B101
FIGI
BBG002N8R7H9
Identifiers
ISIN CA17040B1013
Choom Holdings, Inc. engages in the retail of cannabis. The company was founded By Craig D. Schneider on September 18, 2006 and is headquartered in Vancouver, Canada.
Performance
Revenue to profit conversion
Debt level and coverage
Earnings
Next:—

See all ideas 

Summarizing what the indicators are suggesting.
Oscillators
Neutral
Oscillators
Neutral
Summary
Neutral
Summary
Neutral
Summary
Neutral
Moving Averages
Neutral
Moving Averages
Neutral
Displays a symbol's price movements over previous years to identify recurring trends.

Frequently asked questions


Today, CHOOF trades at 0.000001 USD.

For broader market analysis, dive into the technicals on the Choom Hldgs Inc. stock price chart.
CHOOF stock is 0.00% volatile and has beta coefficient of −5.08.

What it means:
– Volatility: Shows how much the price fluctuates over time
– Beta > 1: More volatile than the market
– Beta < 1: Less volatile, more stable

Important to know:
– Volatility can increase during earnings, news events, or market stress
– Large-cap stocks like CHOOF are typically less volatile than smaller companies

Track every detail on Choom Hldgs Inc. stock chart and check out the list of the most volatile stocks — is Choom Hldgs Inc. there?
The safest way to buy Choom Hldgs Inc. stocks is through a reliable broker. Create an account, fund it, and place a buy order.

You can trade CHOOF directly from TradingView:
– Choose a broker: Explore our supported trading partners and pick one that fits your needs
– Compare options: View available brokers side by side to evaluate fees and features
– Connect your account: Open Supercharts, click “Trade”, select your broker, and log in
– Start trading: Place orders without leaving the chart

Tip: If you’re new to trading, try paper trading first — it lets you practice strategies in real market conditions without risking funds.
Investing in Choom Hldgs Inc. depends on your goals, risk tolerance, and market conditions. It’s essential to analyze the stock before making a decision.

First, study Choom Hldgs Inc. financials and track their dynamics on the Fundamental Graphs:
– Business fundamentals: Revenue, earnings, and growth trends
– Valuation: P/E ratio, market cap, and how it compares to peers
– Profitability: Margins, return on equity, and cash flow
– Dividends (if any): Yield, payout ratio, and consistency

Then explore our CHOOF technicals – signals based on essential indicators calculations:
– Today — sell
– 1-week — sell
– 1-month — sell

Combine fundamental and technical analysis for better results.
Choom Hldgs Inc. stock ticker depends on the exchange where it’s listed. On the OTC, its primary exchange, Choom Hldgs Inc. stocks trade under the symbol CHOOF.

About tickers:
– Unique identifiers: A ticker is a short code used to find and trade a stock
– Exchange-specific: The same company may have different tickers across exchanges
– Search shortcut: Used on trading platforms, charts, and screeners

Remember:
– Some companies have multiple listings
– Always check the exchange prefix to avoid confusion

Learn how to find your desired assets in our Symbol Search.
Yes, you can track Choom Hldgs Inc. financials in yearly and quarterly reports right on TradingView.

Use our Earnings Calendar to never miss important releases and spot opportunities early.
No, Choom Hldgs Inc. does not currently pay dividends to its shareholders.

Instead of distributing profits as cash payments, the company may choose to reinvest earnings back into the business — for example, in growth, innovation, acquisitions, or debt reduction.

What to consider instead:
– Earnings growth: Is the company increasing profitability over time?
– Revenue expansion: Is the business scaling its operations?
– Free cash flow: Does it generate enough cash to potentially support future dividends?
– Share buybacks: Some companies return capital through repurchasing shares instead of dividends
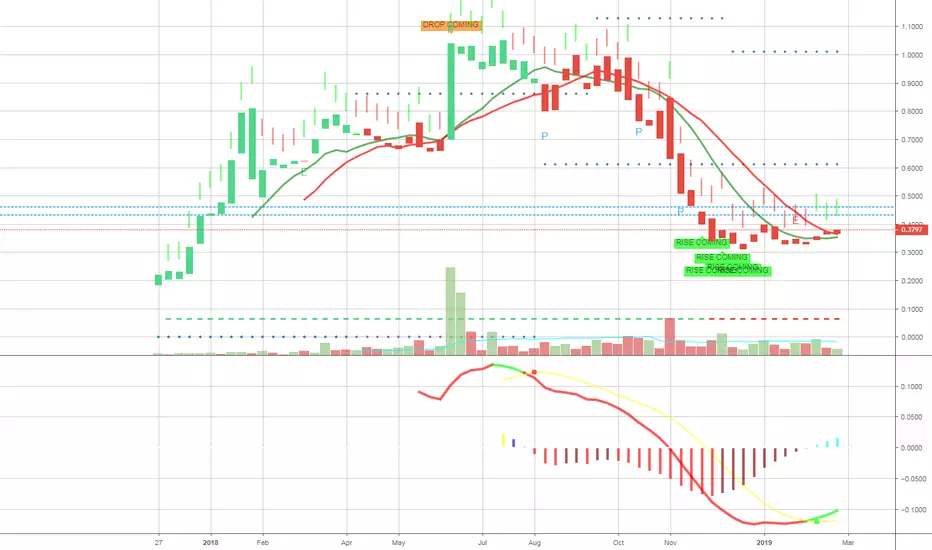
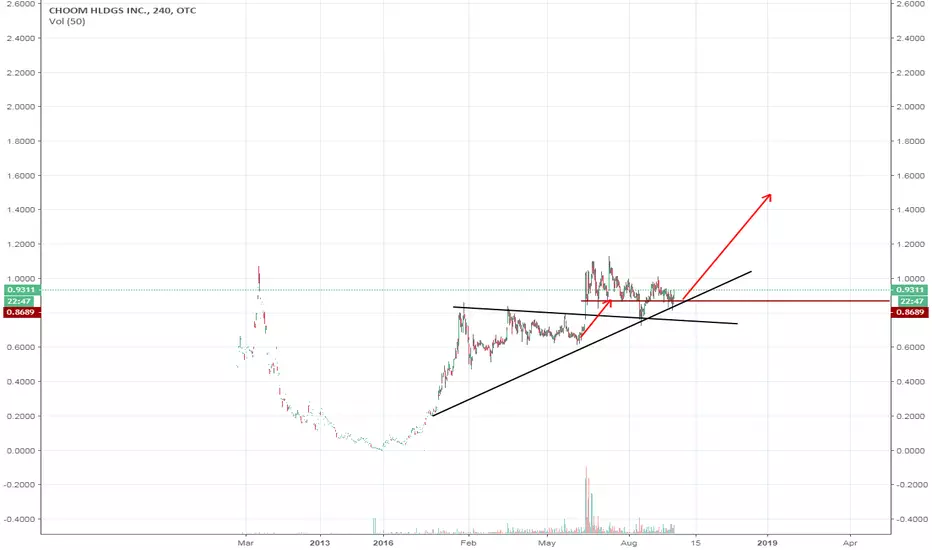
CHOOF reached its all-time high of 1.130000 USD on Jul 11, 2018. Its all-time low was 0.000001 USD and was reached on May 23, 2023.

Explore the Choom Hldgs Inc. stock price chart to see more price history, and discover companies reaching new all-time highs and lows.