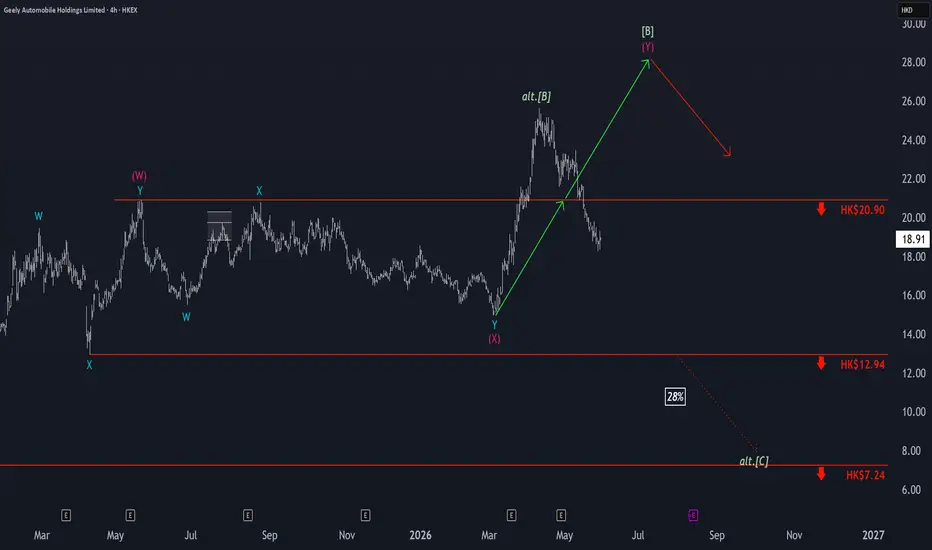
Geely: Top Already Established?Since Geely continues to trade below the HK$20.90 mark, we have to consider an alternative scenario: A corrective top may have already formed in mid-April, with the subsequent sell-offs representing a downward phase likely to end with a low just above the HK$7.24 support. This scenario would be trig
Geely Automobile Holdings Ltd.
No trades
No trades
Compare with Geely Automobile Holdings Ltd.
0.21 USD
2.35 B USD
48.10 B USD
6.27 B
Next report date
—
Report period
—
EPS estimate
—
Revenue estimate
—
Details
Sector
Industry
CEO
Sheng Yue Gui
Website
Headquarters
Hong Kong
Founded
1973
IPO date
Feb 23, 1973
ISIN
KYG3777B1032
CUSIP
G3777B103
FIGI
BBG000BYL455
Identifiers
ISIN KYG3777B1032
Geely Automobile Holdings Ltd. operates as an investment holding company, which engages in the research, production, marketing and sale of sedans and related automobile components. It operates through the following geographical segments: People's Republic of China, Eastern Europe, Pan Europe, Asia Pacific, Middle East, Latin America, Africa, and Other Countries. The Pan Europe geographical segment includes the Netherlands, Sweden, and France. The company was founded on January 1, 1973 and is headquartered in Hong Kong.
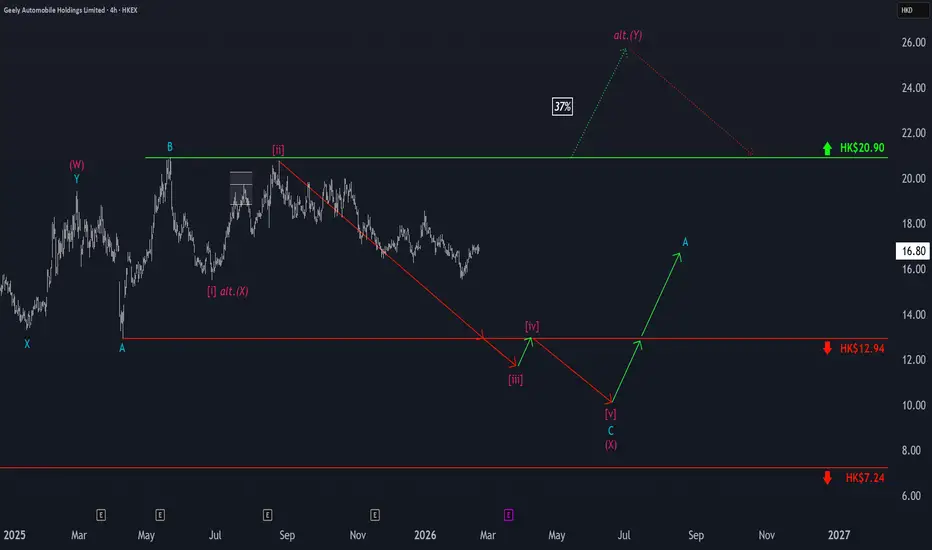
Geely: Further Sell-offs expectedGeely’s stock hasn't seen much movement recently due to the Chinese holidays. According to our primary scenario, we expect further sell-offs to push price below the HK$12.94 support. There, we anticipate the low of the magenta wave (X). However, if price climbs above the HK$20.90 resistance, it coul
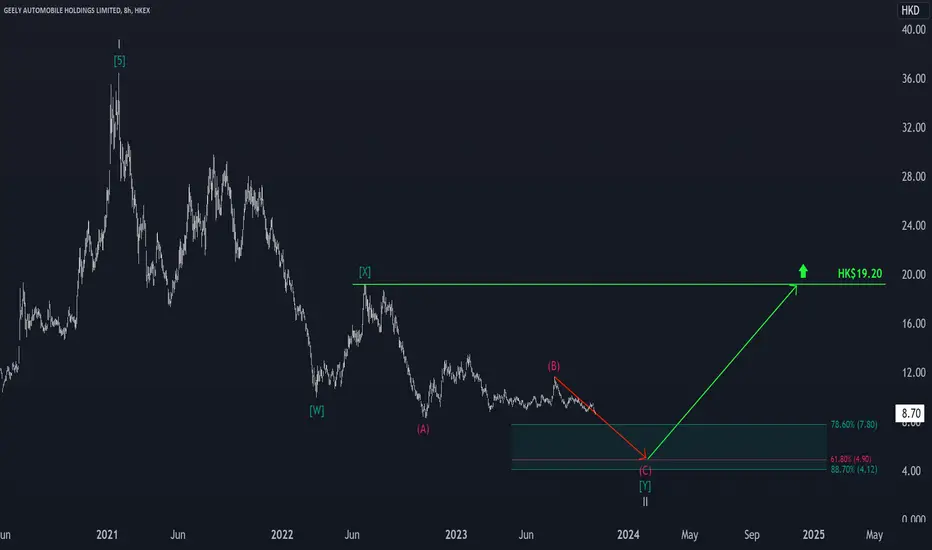
Geely: Bears are back 🍯🐻The bears have now pushed Geely stock back below its March low. This confirms our primary scenario that the stock is in the final phase of the overarching gray wave II from the high of the magenta wave (B). This move should now be advanced to the green target zone between HK$7.80 and HK$4.12. With t
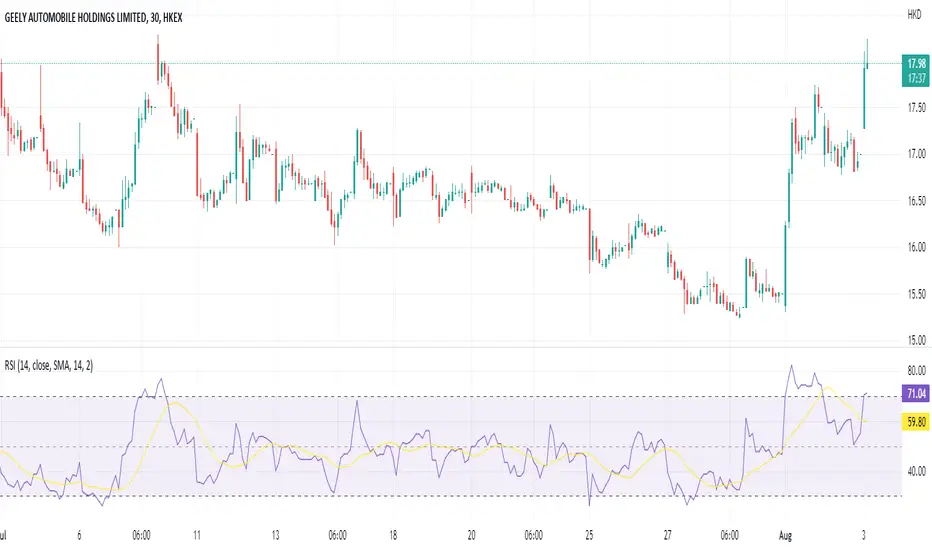
Geely has great chance to reboundGeely (175.HK) has great chance to rebound. It shows strong support at the resistance level of 16.5. The impact of Nancy Pelosi visit to Taiwan is expected to be short-lived in Hong Kong market. We expect the acquisition of Meizu, a popular mobile brand by the parent of Geely will contribute to Geel
See all ideas
Summarizing what the indicators are suggesting.
Neutral
SellBuy
Strong sellStrong buy
Strong sellSellNeutralBuyStrong buy
Neutral
SellBuy
Strong sellStrong buy
Strong sellSellNeutralBuyStrong buy
Neutral
SellBuy
Strong sellStrong buy
Strong sellSellNeutralBuyStrong buy
An aggregate view of professional's ratings.
Neutral
SellBuy
Strong sellStrong buy
Strong sellSellNeutralBuyStrong buy
Neutral
SellBuy
Strong sellStrong buy
Strong sellSellNeutralBuyStrong buy
Neutral
SellBuy
Strong sellStrong buy
Strong sellSellNeutralBuyStrong buy
Displays a symbol's price movements over previous years to identify recurring trends.
Weight0.03%
Market value198.13 M
Weight0.11%
Market value187.02 M
Weight0.12%
Market value178.08 M
Weight0.75%
Market value133.48 M
Weight2.56%
Market value83.00 M
Weight0.29%
Market value72.89 M
Weight0.12%
Market value50.45 M
Weight0.12%
Market value50.45 M
Weight0.14%
Market value38.62 M
Weight0.64%
Market value38.41 M
Weight1.15%
Market value36.18 M
Explore more ETFs
Frequently asked questions
The current price of GELYF is 2.45 USD — it has increased by 4.34% in the past 24 hours. Watch Geely Automobile Holdings Ltd. stock price performance more closely on the chart.
Depending on the exchange, the stock ticker may vary. For instance, on OTC exchange Geely Automobile Holdings Ltd. stocks are traded under the ticker GELYF.
GELYF stock has fallen by −2.34% compared to the previous week, the month change is a 14.09% rise, over the last year Geely Automobile Holdings Ltd. has showed a 1.45% increase.
We've gathered analysts' opinions on Geely Automobile Holdings Ltd. future price: according to them, GELYF price has a max estimate of 4.59 USD and a min estimate of 2.71 USD. Watch GELYF chart and read a more detailed Geely Automobile Holdings Ltd. stock forecast: see what analysts think of Geely Automobile Holdings Ltd. and suggest that you do with its stocks.
GELYF reached its all-time high on Jan 8, 2021 with the price of 4.40 USD, and its all-time low was 0.02 USD and was reached on Oct 29, 2008. View more price dynamics on GELYF chart.
See other stocks reaching their highest and lowest prices.
GELYF stock is 4.17% volatile and has beta coefficient of 0.55. Track Geely Automobile Holdings Ltd. stock price on the chart and check out the list of the most volatile stocks — is Geely Automobile Holdings Ltd. there?
Today Geely Automobile Holdings Ltd. has the market capitalization of 26.36 B, it has increased by 1.70% over the last week.
Yes, you can track Geely Automobile Holdings Ltd. financials in yearly and quarterly reports right on TradingView.
Geely Automobile Holdings Ltd. is going to release the next earnings report on Aug 17, 2026. Keep track of upcoming events with our Earnings Calendar.
GELYF net income for the last quarter is 599.52 M USD, while the quarter before that showed 527.32 M USD of net income which accounts for 0.00% change. Track more Geely Automobile Holdings Ltd. financial stats to get the full picture.
Yes, GELYF dividends are paid annually. The last dividend per share was 0.06 USD. As of today, Dividend Yield (TTM)% is 2.62%. Tracking Geely Automobile Holdings Ltd. dividends might help you take more informed decisions.
Geely Automobile Holdings Ltd. dividend yield was 2.79% in 2025, and payout ratio reached 27.66%. The year before the numbers were 2.23% and 18.22% correspondingly. See high-dividend stocks and find more opportunities for your portfolio.
As of Jul 27, 2026, the company has 73 K employees. See our rating of the largest employees — is Geely Automobile Holdings Ltd. on this list?
Like other stocks, GELYF shares are traded on stock exchanges, e.g. Nasdaq, Nyse, Euronext, and the easiest way to buy them is through an online stock broker. To do this, you need to open an account and follow a broker's procedures, then start trading. You can trade Geely Automobile Holdings Ltd. stock right from TradingView charts — choose your broker and connect to your account.
Investing in stocks requires a comprehensive research: you should carefully study all the available data, e.g. company's financials, related news, and its technical analysis. So Geely Automobile Holdings Ltd. technincal analysis shows the buy rating today, and its 1 week rating is buy. Since market conditions are prone to changes, it's worth looking a bit further into the future — according to the 1 month rating Geely Automobile Holdings Ltd. stock shows the buy signal. See more of Geely Automobile Holdings Ltd. technicals for a more comprehensive analysis.
If you're still not sure, try looking for inspiration in our curated watchlists.