Tenet Fintech Group Canada Sun Storm Investment Trading Desk & NexGen Wealth Management Service Present's: SSITD & NexGen Portfolio of the Week Series
Focus: Worldwide
By Sun Storm Investment Research & NexGen Wealth Management Service
A Profit & Solutions Strategy & Research
Trading | Investment | Stocks | ETF | Mutua
Tenet Fintech Group Inc.
No trades
No trades
Peers for comparison
−0.0031 USD
−6.92 M USD
7.96 M USD
457.57 M
Next report date
Report period
EPS estimate
Revenue estimate
Company info
Sector
Industry
CEO
Johnson Joseph
Website
Headquarters
Toronto
Founded
2008
IPO date
Oct 23, 2015
ISIN
CA88035N1033
CUSIP
88035N103
FIGI
BBG006BJM258
Identifiers
ISIN CA88035N1033
Tenet Fintech Group, Inc. is an information technology portfolio management company, which engages in assembling, financing, and managing a portfolio of companies and assets in some of the tech sectors. It operates through the following segments: Fintech Platform, Financial Services, and Other. The Fintech Platform segment consists of procurement and distribution of products within supply chain or facilitating transactions in the commercial lending industry through technology platforms and the Canadian operating entities. The Financial Services segment provides commercial loans to entrepreneurs and SMEs and the activity of providing turn-key credit outsourcing services to banks and other lending institutions. The Other segment includes activity and unallocated portion of the Canadian parent company's services and all non-operating holdings registered in Hong Kong and China. The company was founded by Johnson Josephon May 13, 2008 and is headquartered in Toronto, Canada.
Tennet Fintech Canada Sun Storm Investment Trading Desk & NexGen Wealth Management Service Present's: SSITD & NexGen Portfolio of the Week Series
Focus: Worldwide
By Sun Storm Investment Research & NexGen Wealth Management Service
A Profit & Solutions Strategy & Research
Trading | Investment | Stocks | ETF | Mutua
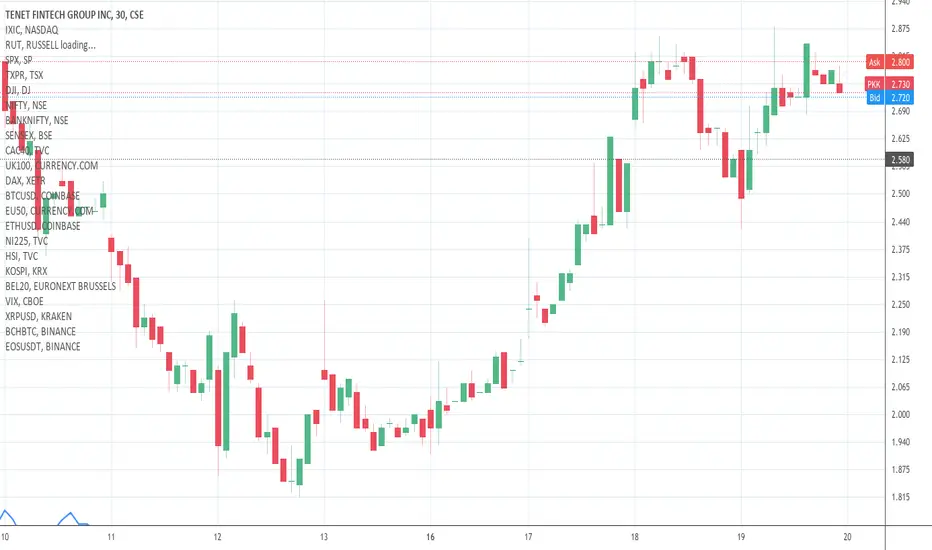
PKKFF should do a strong move next weekI have no position in this, but am keeping an eye on it. Time is running out on PKKFF and it should do a strong move soon but entering here is a gamble.
-As the daily hull (highlighted) starts to crash into the price, it acts as resistance.
-I see a pennant forming with the channel top as the resis
PKKFF 07-01-'22(1) Daily Demand zone Broken= Supply > Demand
+ Increase in Volume (Selling) iccw declining OBV
(2) Weekly Demand zone + 2x Legit Renko Support Line
(3) Decending Trendline still Legit
(4) RSI --> Oversold (Demand W Legit for bounce?)
(+) Support at Falling Wedge pattern, weak(?)
Conclusion:
PA
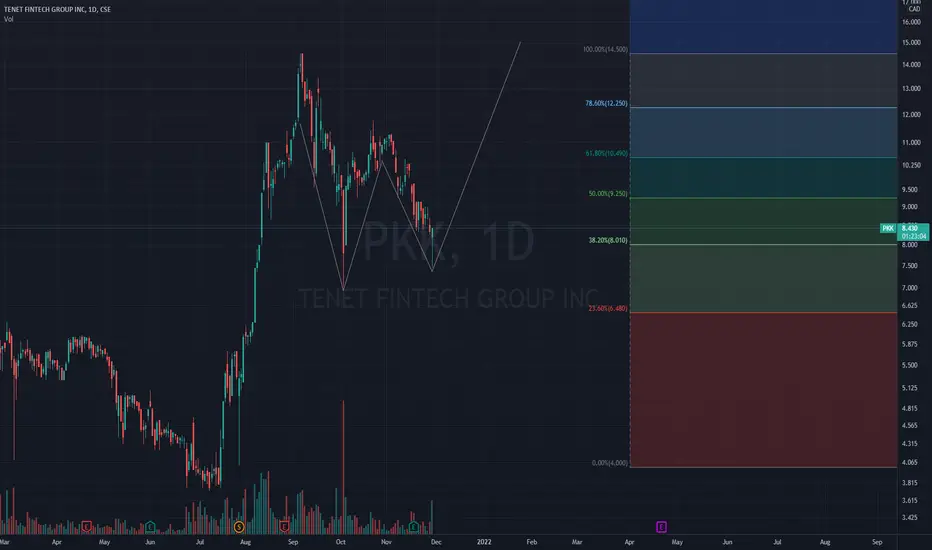
$PKK Double Bottom Reversal PatternThis is where Technical Analysis and strong company fundamentals collide.
CSE:PKK has their strongest quarter incoming (Q4) which is expected to surpass 2020's revenue in it's entirety.
This, combined with a NASDAQ listing, and other unknown catalysts should result in powerful capital market re
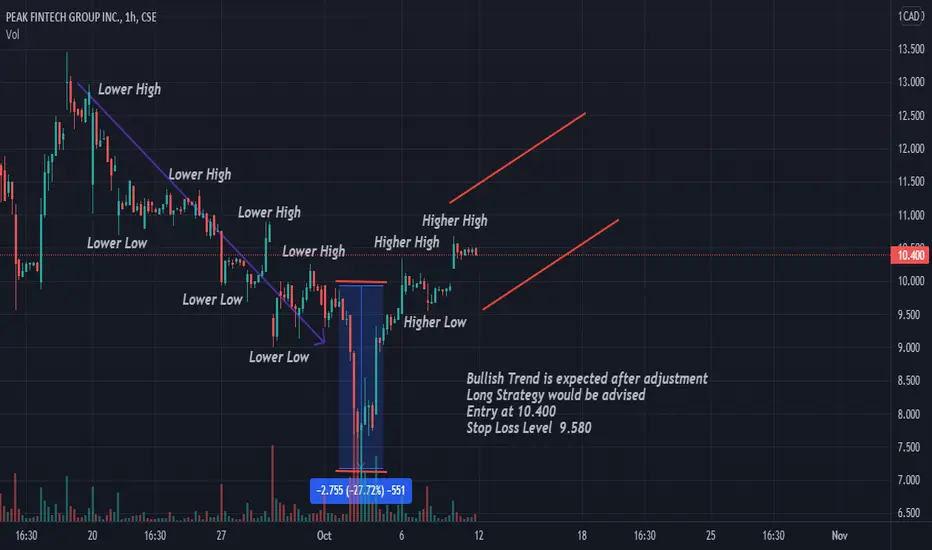
PKK to $17-18 in NovemberFollowing a rocky start after an uplisting and delisting from NASDAQ, PKK has been checking all the boxes in every other metric and has been hitting it's bull flag targets since the first run from 35 cents. Despite the pullback after losing the NASDAQ listing, we retraced only a little more than th
PKK hype vs resistance test this weekWEEK OF 30NOV:
PKK has been on a tear despite missing ER guidance and we are officially at a place nobody expected to see for about a year. Has already demonstrated interaction with our important fib lines (0.618 and 0.236). It has achieved every bull flag target while I have been watching (73 cents
Stock pick sharing: Peak Fintech GroupCompany Name: Peak Fintech Group Inc.
Stock ticker: PKK (CSE) / PKKFF (OTC) *** Plans to change ticker to TNT after NASDAQ uplisting
Sector: Technology
Industry: Information Technology Services
General Business:
- Parent company headquartered in Canada, has a group of subsidiaries operating
See all ideas
Summarizing what the indicators are suggesting.
Oscillators
Neutral
Oscillators
Neutral
Summary
Neutral
Summary
Neutral
Summary
Neutral
Moving Averages
Neutral
Moving Averages
Neutral
Displays a symbol's price movements over previous years to identify recurring trends.
Frequently asked questions
Today, PKKFF trades at 0.0577 USD.
For broader market analysis, dive into the technicals on the Tenet Fintech Group Inc. stock price chart and read the latest PKKFF news:
– Tenet Sets Dates for Annual General Meeting of Shareholders and Filing of Third Quarter 2026 Financial Results
– Tenet Fintech Group Inc. (PKK) Releases Cubeler Business Hub Mobile App
– Tenet Releases Mobile App Version of Cubeler Business Hub for iOS and Android Devices
For broader market analysis, dive into the technicals on the Tenet Fintech Group Inc. stock price chart and read the latest PKKFF news:
– Tenet Sets Dates for Annual General Meeting of Shareholders and Filing of Third Quarter 2026 Financial Results
– Tenet Fintech Group Inc. (PKK) Releases Cubeler Business Hub Mobile App
– Tenet Releases Mobile App Version of Cubeler Business Hub for iOS and Android Devices
Markets don't sleep, here's what's going on with PKKFF at the moment:
– Tenet Sets Dates for Annual General Meeting of Shareholders and Filing of Third Quarter 2026 Financial Results
– Tenet Fintech Group Inc. (PKK) Releases Cubeler Business Hub Mobile App
– Tenet Releases Mobile App Version of Cubeler Business Hub for iOS and Android Devices
See more updates in real-time with our News Flow.
– Tenet Sets Dates for Annual General Meeting of Shareholders and Filing of Third Quarter 2026 Financial Results
– Tenet Fintech Group Inc. (PKK) Releases Cubeler Business Hub Mobile App
– Tenet Releases Mobile App Version of Cubeler Business Hub for iOS and Android Devices
See more updates in real-time with our News Flow.
Tenet Fintech Group Inc. is scheduled to release its next earnings report on Nov 19, 2026.
Why it matters:
– Key event: Earnings often drive significant price moves
– Market expectations: Traders watch revenue, EPS, and guidance vs forecasts
– Volatility spike: Price swings can increase before and after the release
How to use it:
– Track upcoming reports in the Earnings Calendar
– Compare actual results with analyst estimates
– Monitor price reaction and volume on Supercharts
Why it matters:
– Key event: Earnings often drive significant price moves
– Market expectations: Traders watch revenue, EPS, and guidance vs forecasts
– Volatility spike: Price swings can increase before and after the release
How to use it:
– Track upcoming reports in the Earnings Calendar
– Compare actual results with analyst estimates
– Monitor price reaction and volume on Supercharts
PKKFF stock is 20.56% volatile and has beta coefficient of −3.26.
What it means:
– Volatility: Shows how much the price fluctuates over time
– Beta > 1: More volatile than the market
– Beta < 1: Less volatile, more stable
Important to know:
– Volatility can increase during earnings, news events, or market stress
– Large-cap stocks like PKKFF are typically less volatile than smaller companies
Track every detail on Tenet Fintech Group Inc. stock chart and check out the list of the most volatile stocks — is Tenet Fintech Group Inc. there?
What it means:
– Volatility: Shows how much the price fluctuates over time
– Beta > 1: More volatile than the market
– Beta < 1: Less volatile, more stable
Important to know:
– Volatility can increase during earnings, news events, or market stress
– Large-cap stocks like PKKFF are typically less volatile than smaller companies
Track every detail on Tenet Fintech Group Inc. stock chart and check out the list of the most volatile stocks — is Tenet Fintech Group Inc. there?
To understand the PKKFF stock performance, it's worth checking price changes for various periods to get the full picture:
– 1 day — +2.58%
– 1 week — −19.01%
– 1 month — −52.55%
PKKFF all-time low was 0.0100 USD (Jul 9, 2025), and its highest price is 63.6400 USD (Mar 31, 2017). Find more dynamics in the Stock Heatmap and on the Tenet Fintech Group Inc. stock chart.
– 1 day — +2.58%
– 1 week — −19.01%
– 1 month — −52.55%
PKKFF all-time low was 0.0100 USD (Jul 9, 2025), and its highest price is 63.6400 USD (Mar 31, 2017). Find more dynamics in the Stock Heatmap and on the Tenet Fintech Group Inc. stock chart.
Tenet Fintech Group Inc. market capitalization is 27.87 M, representing the total value of all its outstanding shares (price × shares outstanding).
What it means:
– Market cap is one of the key ways to classify companies (large-cap, mid-cap, etc.)
– It reflects how investors value the company today
– It changes constantly with stock price movements
What to look at next:
– Market cap trends: Rising cap may signal growth and investor confidence; falling cap can reflect risk or downturns
– Price vs shares: Changes can come from Tenet Fintech Group Inc. stock price moves or share count (buybacks, issuance)
– Valuation ratios: Compare market cap with revenue and earnings
– Peer comparison: See how Tenet Fintech Group Inc. stacks up against other companies
What it means:
– Market cap is one of the key ways to classify companies (large-cap, mid-cap, etc.)
– It reflects how investors value the company today
– It changes constantly with stock price movements
What to look at next:
– Market cap trends: Rising cap may signal growth and investor confidence; falling cap can reflect risk or downturns
– Price vs shares: Changes can come from Tenet Fintech Group Inc. stock price moves or share count (buybacks, issuance)
– Valuation ratios: Compare market cap with revenue and earnings
– Peer comparison: See how Tenet Fintech Group Inc. stacks up against other companies
The safest way to buy Tenet Fintech Group Inc. stocks is through a reliable broker. Create an account, fund it, and place a buy order.
You can trade PKKFF directly from TradingView:
– Choose a broker: Explore our supported trading partners and pick one that fits your needs
– Compare options: View available brokers side by side to evaluate fees and features
– Connect your account: Open Supercharts, click “Trade”, select your broker, and log in
– Start trading: Place orders without leaving the chart
Tip: If you’re new to trading, try paper trading first — it lets you practice strategies in real market conditions without risking funds.
You can trade PKKFF directly from TradingView:
– Choose a broker: Explore our supported trading partners and pick one that fits your needs
– Compare options: View available brokers side by side to evaluate fees and features
– Connect your account: Open Supercharts, click “Trade”, select your broker, and log in
– Start trading: Place orders without leaving the chart
Tip: If you’re new to trading, try paper trading first — it lets you practice strategies in real market conditions without risking funds.
Investing in Tenet Fintech Group Inc. depends on your goals, risk tolerance, and market conditions. It’s essential to analyze the stock before making a decision.
First, study Tenet Fintech Group Inc. financials and track their dynamics on the Fundamental Graphs:
– Business fundamentals: Revenue, earnings, and growth trends
– Valuation: P/E ratio, market cap, and how it compares to peers
– Profitability: Margins, return on equity, and cash flow
– Dividends (if any): Yield, payout ratio, and consistency
Then explore our PKKFF technicals – signals based on essential indicators calculations:
– Today — sell
– 1-week — strong sell
– 1-month — strong sell
Combine fundamental and technical analysis for better results.
First, study Tenet Fintech Group Inc. financials and track their dynamics on the Fundamental Graphs:
– Business fundamentals: Revenue, earnings, and growth trends
– Valuation: P/E ratio, market cap, and how it compares to peers
– Profitability: Margins, return on equity, and cash flow
– Dividends (if any): Yield, payout ratio, and consistency
Then explore our PKKFF technicals – signals based on essential indicators calculations:
– Today — sell
– 1-week — strong sell
– 1-month — strong sell
Combine fundamental and technical analysis for better results.
Tenet Fintech Group Inc. stock ticker depends on the exchange where it’s listed. On the CSE, its primary exchange, Tenet Fintech Group Inc. stocks trade under the symbol PKK.
About tickers:
– Unique identifiers: A ticker is a short code used to find and trade a stock
– Exchange-specific: The same company may have different tickers across exchanges
– Search shortcut: Used on trading platforms, charts, and screeners
Remember:
– Some companies have multiple listings
– Always check the exchange prefix to avoid confusion
Learn how to find your desired assets in our Symbol Search.
About tickers:
– Unique identifiers: A ticker is a short code used to find and trade a stock
– Exchange-specific: The same company may have different tickers across exchanges
– Search shortcut: Used on trading platforms, charts, and screeners
Remember:
– Some companies have multiple listings
– Always check the exchange prefix to avoid confusion
Learn how to find your desired assets in our Symbol Search.
Yes, you can track Tenet Fintech Group Inc. financials in yearly and quarterly reports right on TradingView.
Use our Earnings Calendar to never miss important releases and spot opportunities early.
PKKFF net income for the last quarter is 1.84 M USD, while the quarter before that showed 430.20 K USD of net income which accounts for 328.67% change.
How to read this data:
– Track changes: Compare net income across quarters to spot trends
– Watch expectations: Compare with estimates to gauge performance
– Check margins: Net income reflects profitability after all expenses
– Look beyond one quarter: Consistency matters more than a single result
Follow other essential metrics in Tenet Fintech Group Inc. financials:
– Revenue: Overall business growth
– Earnings per share: Rising EPS over time often points to improving business performance
– Margins (gross, operating): Efficiency and cost control
How to read this data:
– Track changes: Compare net income across quarters to spot trends
– Watch expectations: Compare with estimates to gauge performance
– Check margins: Net income reflects profitability after all expenses
– Look beyond one quarter: Consistency matters more than a single result
Follow other essential metrics in Tenet Fintech Group Inc. financials:
– Revenue: Overall business growth
– Earnings per share: Rising EPS over time often points to improving business performance
– Margins (gross, operating): Efficiency and cost control
No, Tenet Fintech Group Inc. does not currently pay dividends to its shareholders.
Instead of distributing profits as cash payments, the company may choose to reinvest earnings back into the business — for example, in growth, innovation, acquisitions, or debt reduction.
What to consider instead:
– Earnings growth: Is the company increasing profitability over time?
– Revenue expansion: Is the business scaling its operations?
– Free cash flow: Does it generate enough cash to potentially support future dividends?
– Share buybacks: Some companies return capital through repurchasing shares instead of dividends
Instead of distributing profits as cash payments, the company may choose to reinvest earnings back into the business — for example, in growth, innovation, acquisitions, or debt reduction.
What to consider instead:
– Earnings growth: Is the company increasing profitability over time?
– Revenue expansion: Is the business scaling its operations?
– Free cash flow: Does it generate enough cash to potentially support future dividends?
– Share buybacks: Some companies return capital through repurchasing shares instead of dividends
PKKFF reached its all-time high of 63.6400 USD on Mar 31, 2017. Its all-time low was 0.0100 USD and was reached on Jul 9, 2025.
Explore the Tenet Fintech Group Inc. stock price chart to see more price history, and discover companies reaching new all-time highs and lows.
Tenet Fintech Group Inc. EBITDA is 290.68 K USD, with an EBITDA margin of −68.66%.
EBITDA is a measure of core operating performance, showing how much profit the company generates from its main business activities before accounting for financing and accounting-related costs.
What it means:
– Operating strength: Helps assess profitability from core operations
– Efficiency signal: Rising EBITDA often reflects improving business performance
– Comparability: Useful for comparing companies with different capital structures
What to look at next in Tenet Fintech Group Inc. statements:
– Revenue growth: Shows whether the business is expanding
– Net income: Captures full profitability after all expenses
– Free cash flow: Shows actual cash generated
– Debt levels: Important when evaluating earnings quality
EBITDA is a measure of core operating performance, showing how much profit the company generates from its main business activities before accounting for financing and accounting-related costs.
What it means:
– Operating strength: Helps assess profitability from core operations
– Efficiency signal: Rising EBITDA often reflects improving business performance
– Comparability: Useful for comparing companies with different capital structures
What to look at next in Tenet Fintech Group Inc. statements:
– Revenue growth: Shows whether the business is expanding
– Net income: Captures full profitability after all expenses
– Free cash flow: Shows actual cash generated
– Debt levels: Important when evaluating earnings quality