Brent Crude: Complex Correction Might Slash Half of Priceworld energy might get some relief as chart structure of brent crude
gets more complex over time
updated structure implies more complex W-X-Y Double Three correction
it puts us back to the chart posted in June with the same target in place
yesterday's drop ignited the final wave C within terminal wave (Y) down
it can hit the $51 target where wave Y is equal to wave W
bearish confirmation comes from breakdown of previous valley below $78
watch RSI to break down below 50 "waterline" to confi
In-depth trading ideas
BZAlways use 2x–3x leverage. We build positions in stages, both long and short.
Max 4% of your account as margin per position. Split that 4% into 3–6 entries.
Example: $100 account → max $4 margin per position. Split it as $0.5, then $1, then $1.5. So $0.5 × 3x = $1.5 position size.
Don't get greedy.
Only add when your ROI is above -100%. Better: wait a few days between add-ons. Sleep on it — you might end up adding from higher.
Keep half your account in cash as a reserve. Balanced.
In a short mar
Oil could push higherGlobal central banks have started to increase rates as higher energy prices persist and feed through the global economy. Oil is still looking to make further gains, up around 15% since our bullish note in July.
HIgher prices are a function of three factors 1) Stronger than expected global economic growth, we haven't seen unemployment rise or services indicators dip despite higher rates 2) The market is starting to price in new energy demands from AI and data centres and 3) The obvious Middle
Brent oil trendBased on the chart, one might anticipate a rise in Brent crude prices—either from the current range or following a slight decline. Key factors driving this potential increase include rising oil demand from China, the heightened likelihood of renewed conflict between Iran and the US-Israel coalition, significant activity by Yemen’s Houthis (including the targeting of a Saudi Red Sea pipeline), and threats of attacks on oil refineries.
Brent FuturesBrent crude futures saw sharp fluctuations in August before ultimately closing above their 200-day moving average. With the long-term trend firmly bullish, there is a high probability of further upside. Finally, it is worth noting other bullish drivers for “black gold”: (1) the ongoing military conflict in the Middle East and the closure of the Strait of Hormuz, and (2) global oil inventories remaining at multi-year lows.
Long-term trend: Up
Resistance level: $120
Support level: $70, $86
Brent Oil: Buying a High-Confluence PullbackOne of the highest-probability trading opportunities doesn't come from predicting bottoms.
It comes from identifying healthy pullbacks inside established trends.
That's exactly what Brent Crude is showing right now.
After a strong impulsive advance, price has retraced into a technical area where multiple independent support factors are converging.
Rather than viewing this correction as weakness, I see it as a potential continuation setup.
---
## Buying Value, Not Momentum
Strong trends ra
Brent FuturesBrent crude futures rallied strongly in July, consolidating above the $86 support level and the 200-day moving average. As a result, our previous thesis played out: the downward trend reversal proved to be a false break. As a reminder, we previously questioned a sustained decline in oil prices due to: (1) the ongoing military conflict in the Middle East and the closure of the Strait of Hormuz, and (2) global oil inventories remaining at multi-year lows.
Long-term trend: Up
Resistance level: 120
Oil analysis update We have an oil update: 🛢️📈
According to the analysis we reposted on June 21, we expected to see increased demand for oil around the $75 mark, as well as increased tensions in the region. 🌍💥
After a month until now, everything has gone exactly according to the analysis, but we expect volatility in the $90 to $100 range due to the price hitting the uptrend line and a downward trigger. 📉📊
As a result, the regional atmosphere might be calm for about one or two weeks; any medium-term growth requir
Oil AnalysisHello friends
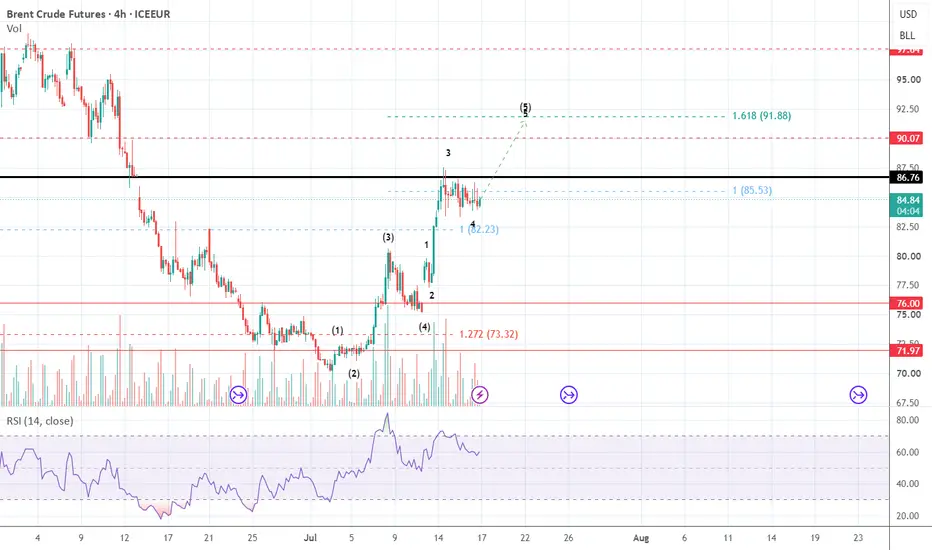
In the oil price chart, we are witnessing the formation of an Elliott wave pattern, which consists of waves 1 to 4 of the main wave and 1 to 4 of wave 5. Now, considering the Fibonacci projection and price resistance and the conflict between Iran and the United States in the Strait of Hormuz and the disruption of the Persian Gulf oil supply, the price will probably reach $90 and then $97
Good luck and be profitable.
Oil back in focus as tensions flareIn late June we said oil was looking for a base . The 200 day moving average has provided a strong support level and renewed tensions now back in play, it seems like oil is about to make a new move higher.
There's strong support in the high US$70 per barrel range. It doesn't seem like geopolitical tensions are going to be solved anytime soon. There could be more upside in the coming weeks.
An additional interesting anecdote - the gold to oil ratio has recently come back to the mid 40x level,
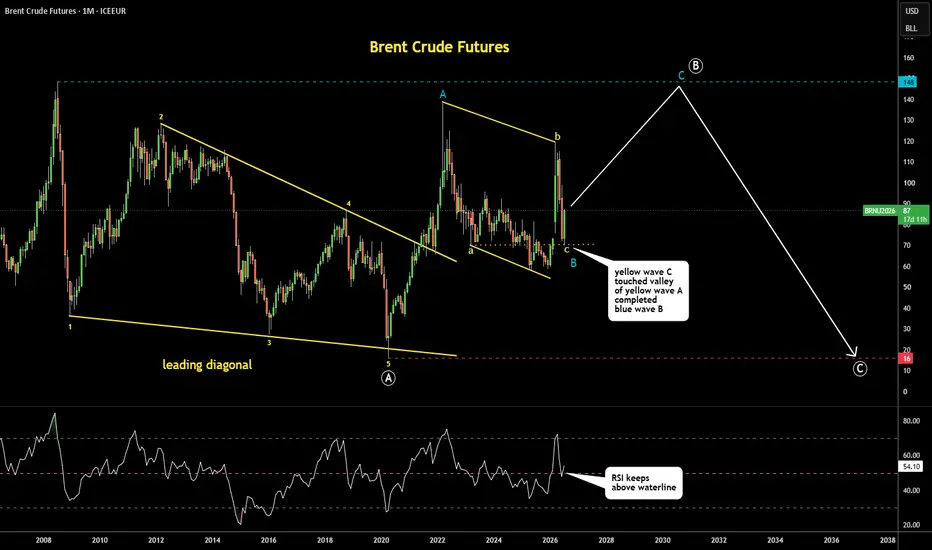
Brent Crude Update 14JUL2026: Upside Target at $148 Blue wave B might be over as irregular flat pattern was completed
when the yellow wave C of lower degree accurately retested the valley of yellow wave A at $70
RSI found support at 50 "waterline" confirming the reversal so far
In this case, the blue wave C might be in progress with the first bullish candle
to complete the white wave (B) of higher degree
It could revisit the all-time high of $148
After that, another drop in white wave (C) should follow
Brent oil extends rebound after holding key supportBrent crude oil prices recently fell back towards the support area around $70 per barrel, filling the gap that had remained open since 2 March. That support zone has held, and the market has since rebounded sharply.
The move has become more forceful since the TradingView chart was captured on 13 July, with Brent extending into the mid-$80s as renewed Middle East tensions add a fresh geopolitical risk premium to energy markets. That shift means the setup is no longer simply about whether Brent c
U
Buy crude oil around 71.50, with a target of 72.90-75.00Crude Oil Market Analysis:
Fundamentals directly drove crude oil to rebound to around 72.70, with a large bullish candle on the daily chart, indicating a market rebound. Currently, it's not entirely clear whether this is a rebound or a reversal. The bullish daily candle is due to fundamental factors, and the sustainability of these factors is uncertain. What is certain is that tensions in the Strait of Hormuz have escalated again, making further short-term declines in crude oil unlikely. Consi
WTI(20260708) Today's AnalysisMarket News:
According to Proactive Research, traders on the market prediction platform Polymarket are generally optimistic that gold will continue its rebound in July, but believe that gold prices will not return to the highs reached in January. Their bets are concentrated around the month's high of $4,300 per ounce.
Technical Analysis:
Today's Buy/Sell Threshold:
70.93
Support and Resistance Levels:
74.70
73.29
72.38
69.48
68.57
67.16
Trading Strategy:
A break above 72.38 suggests a bu
Crude Oil – Sell around 73.00, target 70.00-65.00Crude Oil Market Analysis:
Crude oil has been hovering on the daily chart recently. Short-term trading lacks clear momentum, and the overall trend remains bearish. It has approached the previous strong support level. The current trading is a normal technical game; sell on any rebound. Today, watch for selling opportunities around 73.00. The daily chart pattern for crude oil looks very bearish.
Fundamental Analysis:
The situation in the Middle East has been relatively calm recently, but ris
WTI(20260707) Today's AnalysisMarket News:
Saudi Arabia has initiated a price war in the Asian market. With the Strait of Hormuz reopening and global oil supply continuing to increase, Saudi Aramco on Monday lowered its official selling price (OSP) for its flagship crude oil sold to Asia in August by the largest margin in at least 26 years, in an effort to attract Asian buyers.
According to price lists obtained by foreign media, Saudi Aramco lowered its OSP for August Arab Light crude oil by $11 per barrel, representing
WTI(20260706) Today's AnalysisMarket News:
The World Gold Council predicts that gold prices will hover around $4,100 this year under its baseline scenario. State Street Bank expects gold prices to rise to $5,000/ounce by early 2027. Royal Bank of Canada believes that a drop in gold prices to $4,000/ounce or below will attract more buying. CICC believes that the current gold market's pricing in interest rate hike expectations may be excessive. An OMFIF survey shows that global central banks plan for the first time to net re
Crude Oil - Sell around 72.00, target 68.00-65.00Crude Oil Market Analysis:
The outlook for crude oil remains bearish today. Sell on any rebounds. Crude oil has broken through multiple support levels. The long-term situation in the Middle East is still developing in a positive direction. The opening of the Strait of Hormuz has caused crude oil to fall sharply. Consider selling around 73.00 today. Resistance for crude oil is around 80.00. As long as this level holds, you can continue selling.
Fundamental Analysis:
Due to the US Independen
Crude Oil – Sell around 74.00, target 70.00-68.00Crude Oil Market Analysis:
The market has been suppressing crude oil prices. Currently, even with fundamental stimuli, crude oil is struggling to rebound. Moving averages are starting to decline, and another rapid drop is expected. Sell crude oil around 74 today. Resistance for crude oil is around 80. Furthermore, the daily moving average has started to decline to around 80, indicating short-term weakness below 80.
Fundamental Analysis:
The White House has recently been intensively discuss
WTI(20260701) Today's AnalysisMarket News:
Federal Reserve's Hamak: Inflation remains too high, and a rate hike may need to be considered; interest rate futures show the probability of a Fed rate hike in September has risen to 80%.
Technical Analysis:
Today's Buy/Sell Threshold:
70.14
Support and Resistance Levels:
72.42
71.57
71.02
69.26
68.71
67.86
Trading Strategy:
If the price breaks above 70.14, consider buying, with a first target price of 71.02.
If the price breaks below 69.26, consider selling, with a first
Crude Oil – Sell around 73.50, targeting 70.00-68.00Crude Oil Market Analysis:
The main reason for the continuous decline in crude oil prices is the reopening of the Strait of Hormuz. While short-term frictions and new developments exist, crude oil has not seen a significant rebound, indicating it is still giving back its previous gains. Today, the strategy is to sell on any rebounds. The fundamentals for crude oil largely support selling, with downward resistance around 73-75.
Fundamental Analysis:
The Iranian and US negotiating teams were