Gold - Is the correction over?Gold has spent the past few months consolidating after the strong decline from the highs earlier this year. Price found significant support around the $4,000 area and has since started to build a more constructive structure. After weeks of sideways price action, buyers have recently shown strength a
Compare with Gold Futures
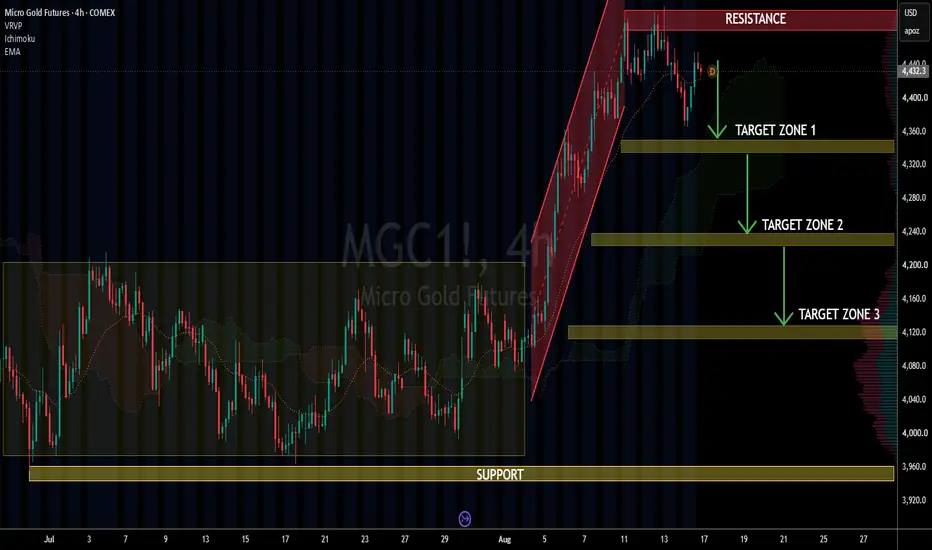
This is the Micro Gold Futures - MGC1! 4-Hour chart on COMEX.This is the Micro Gold Futures - MGC1! 4-Hour chart on COMEX.
Chart Analysis:
1. Accumulation Done: Price was ranging in the "SUPPORT" zone around $3940 - $3960 for a while. Multiple tests and held.
2. Breakout + Channel: Then we got a strong bullish move up inside a red ascending channel. Clean st
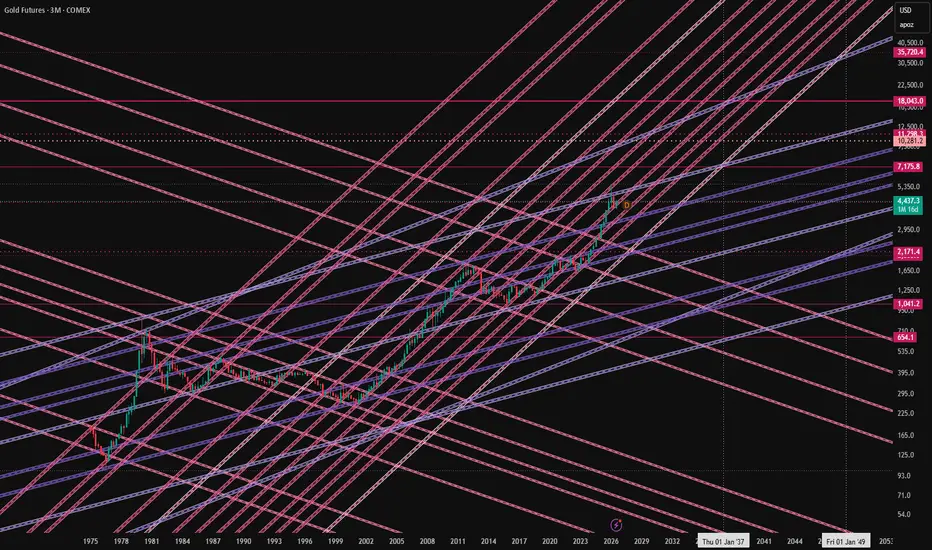
gold future with preferred angles Hi!, trying to look into the future (2050) , not so easy but if chart shows the physics, very much possible , plotted levels needs the consideration.
u can see the preferred angles here followed by the gold future for rising and for correction , gold followed the sharper rising angle for last many
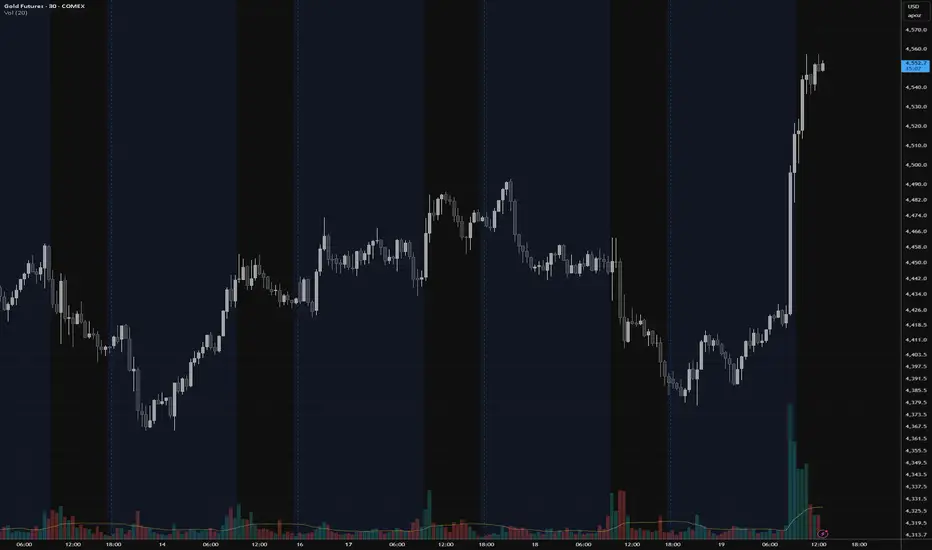
Back to Basics with Chart Setups but with modern indicatorsI love this chart set up - and i believe it reflects the fact that we really don't need too many indicators on our TV charts to identify and action possible winning trades.
yes, the Gold Futures chart here has only 2 indicators
1- MagicRibbon, which is essentially a bunch of moving averages wi
GOLD: Bullish Going Into This Week. But Is It A Buy?In this Weekly Market Forecast, we will analyze Gold for the week of Aug 10-14th.
Gold enters the week with a bullish bias after a strong rally pushed prices near $4,400/oz, though the potential for high volatility looms.
As bullish as it may have ended last week, it closed in a potentially resista
Who Is Selling Gold While Central Banks Keep Buying?Gold has been correcting over the past quarter. But here’s something interesting.
While the gold price was falling, central banks around the world continued to show a strong appetite for gold.
According to the latest World Gold Council research, central banks continued to accumulate gold. From Apr
GOLD: A Superposition at $4,400 — Which State Collapses First?My own system is printing Sell on the weekly right now. On the monthly, the same
system prints Strong Buy with a first target near 5,195. Same indicator, same
data, opposite conclusions.
My indicators are private, so the chart here is clean price action and I am
quoting their readings instead of sh
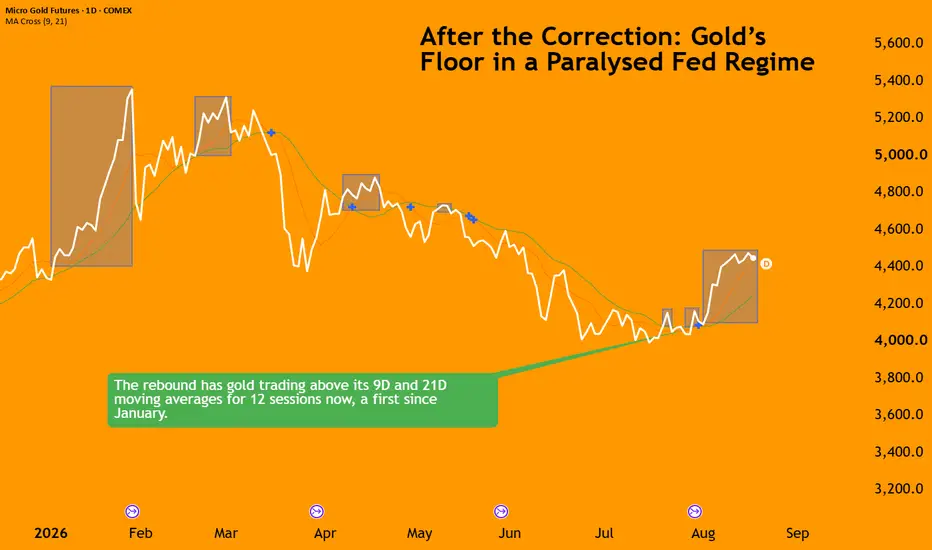
After the Correction: Gold’s Floor in a Paralysed Fed RegimeGold is still well below its January peak, but the correction has started to stabilise. Currently, COMEX futures are trading near $4,385, roughly 22% below the $5,602 high.
The immediate trigger comes from a change in the rate outlook.
July payrolls fell by 23,000, with May and June revised down
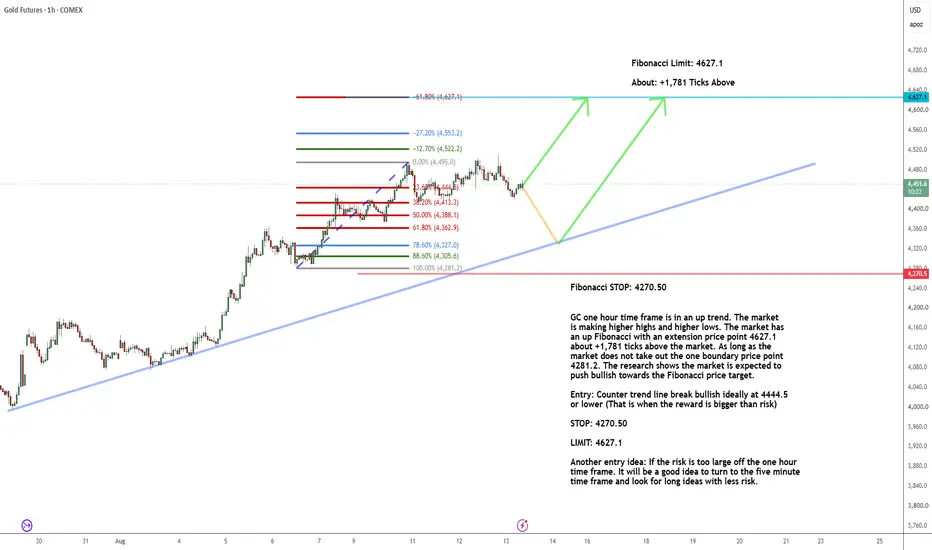
GC One hour_+1,781 ticks to targetGC one hour time frame is in an up trend. The market
is making higher highs and higher lows. The market has
an up Fibonacci with an extension price point 4627.1
about +1,781 ticks above the market. As long as the
market does not take out the one boundary price point
4281.2. The research shows the m
See all ideas
A representation of what an asset is worth today and what the market thinks it will be worth in the future.
Displays a symbol's price movements over previous years to identify recurring trends.