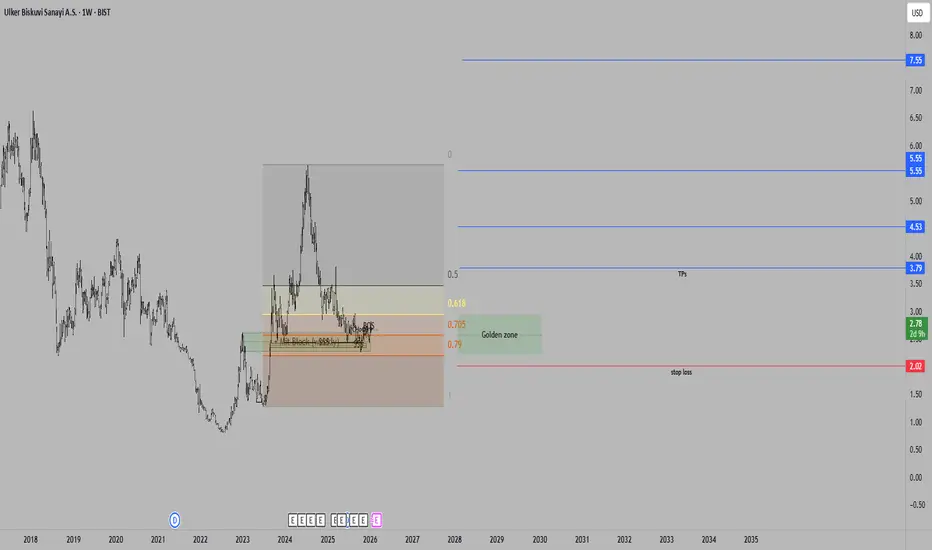
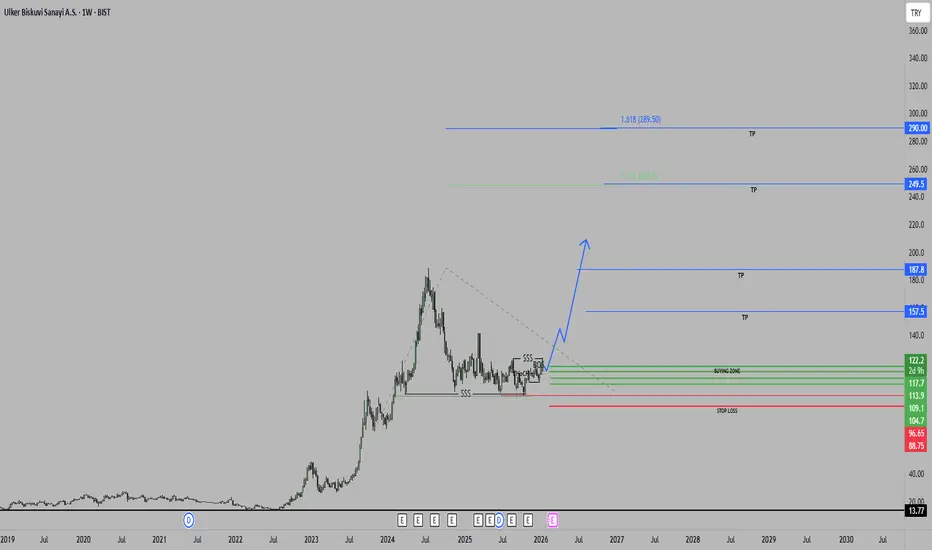
ULKER/USDAnalyzing the stock against USD is more accurate, since the TRY is collapsing, even weak stocks will have up trend against the TRY.Longby Aswadov80
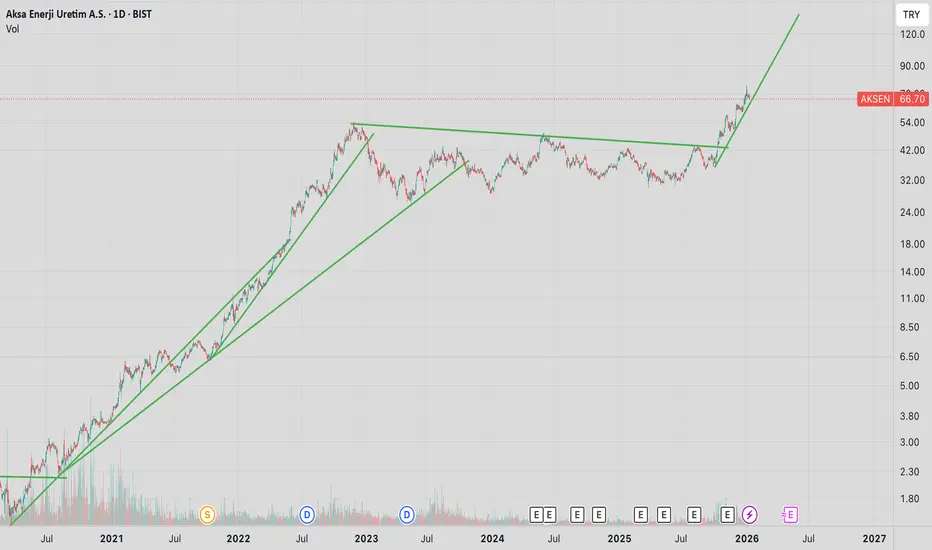
After a sharp increase what is nextAs you see the increase is obvious and if it passes the trend line again another increase is unstoppable. This is not an advice.by safveguzel0
AKSEN yükselen trende devamAKSEN had broken out of its approximately 3-year horizontal movement. It continues its movement on the upward trend it has formed. This is not investment advice.Longby O0mer0O1
$BIST:DENGE /USDTRY looking for a tradeBIST:DENGE uptrend formation confirmed, looking for an entry. Will update the plan when price reaches "entry2" area. Not a financial advice - DYORLongby voltkrugerUpdated 1
$BIST:DENGE/FX:USDTRY update$BIST:DENGE/FX:USDTRY risk of a decending triangle. cancelling long idea for now Shortby voltkruger0
$BIST:ICBCT long opportunity with good r/REntry: 12.21 TP: 18.18 SL: 11.5 r/R: 8.41 BIST:ICBCT ⚠️ DYOR 🚫 Not a financial adviceLongby voltkruger0
$BIST:HURGZ approaching opportunity zone #hurgzEntry: 4.13 TP: 8.55 SL: 4.22 r/R: 9.54 BIST:HURGZ still needs time for a lower risk opportunity. ⚠️ DYOR 🚫 Not a financial advice Longby voltkruger0
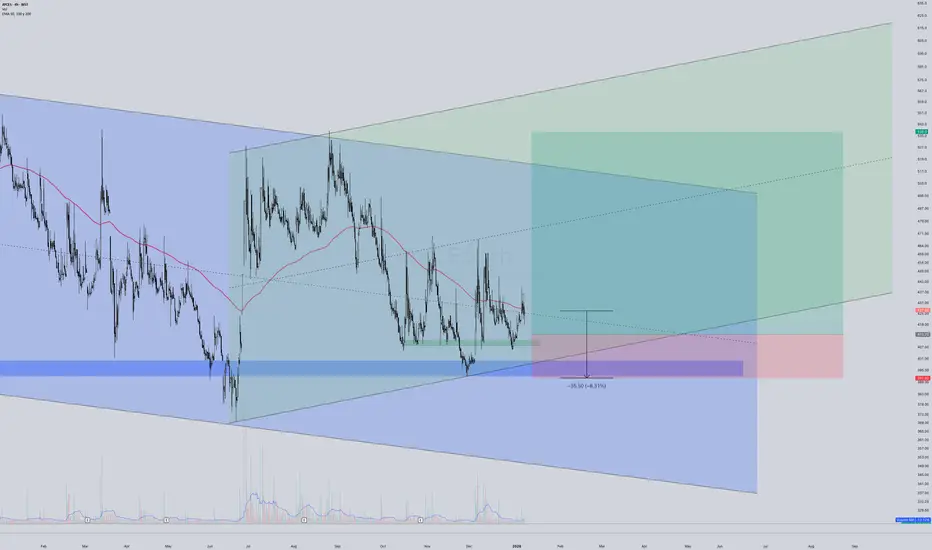
$BIST:AYCES short term opportunity Entry: 413.75 TP: 538 SL: 3.91 r/R: 5.45 BIST:AYCES looking bullish after being rejected from a possible trend support. ⚠️ DYOR 🚫 Not a financial adviceLongby voltkruger0
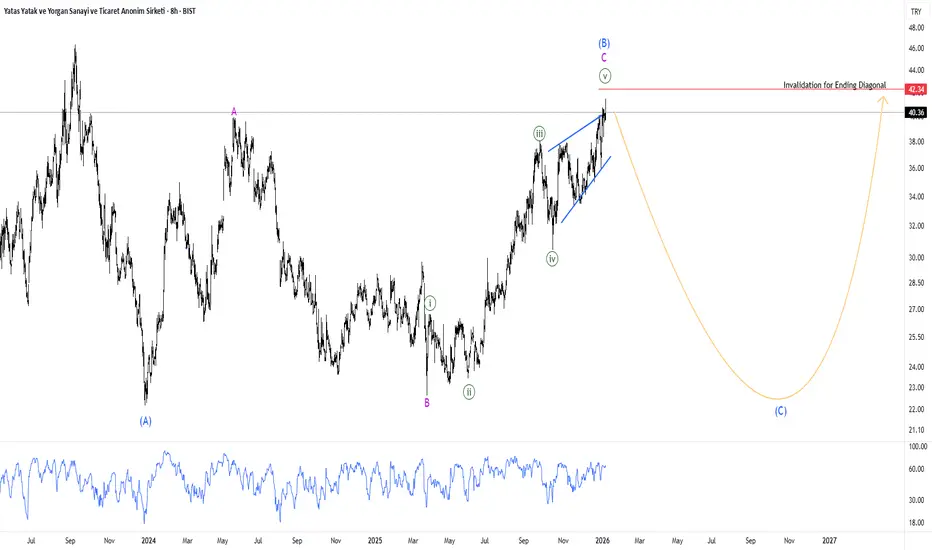
YatasYatas seems like completed wave B of the flat which is also a Flat itself... Now i expect a sharp 5 waves to the downside,after that we can expect it to climb upwards.by ey0100
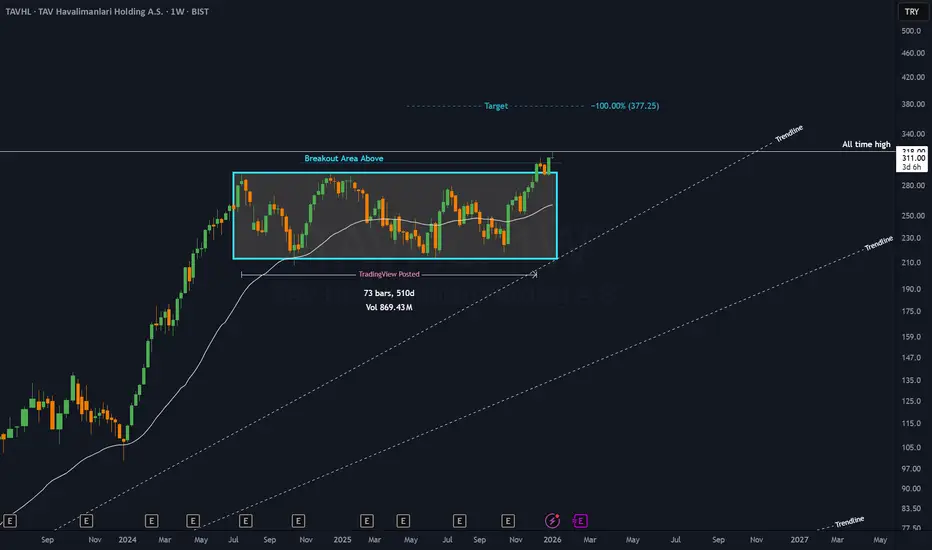
TAVHL - 17 months RECTANGLE══════════════════════════════ Since 2014, my markets approach is to spot trading opportunities based solely on the development of CLASSICAL CHART PATTERNS 🤝Let’s learn and grow together 🤝 ══════════════════════════════ Hello Traders ✌ After a careful consideration I came to the conclusion that: - it is crucial to be quick in alerting you with all the opportunities I spot and often I don't post a good pattern because I don't have the opportunity to write down a proper didactical comment; - sinLongby TheArtOfCharting0
#MAVI VCP (Volatility Contraction Pattern)On the weekly chart, BIST:MAVI looks like it’s developing a Minervini-style Volatility Contraction Pattern (VCP) beneath a clearly defined overhead supply zone (~45.5–47.2TL). After the prior decline and base-repair phase, price has been coiling under resistance with a series of higher lows and progressively tighter pullbacks (each retracement appears smaller/shorter than the previous one). That “tightening” action suggests selling pressure is drying up and the market is absorbing supply nearby Pixelindream0
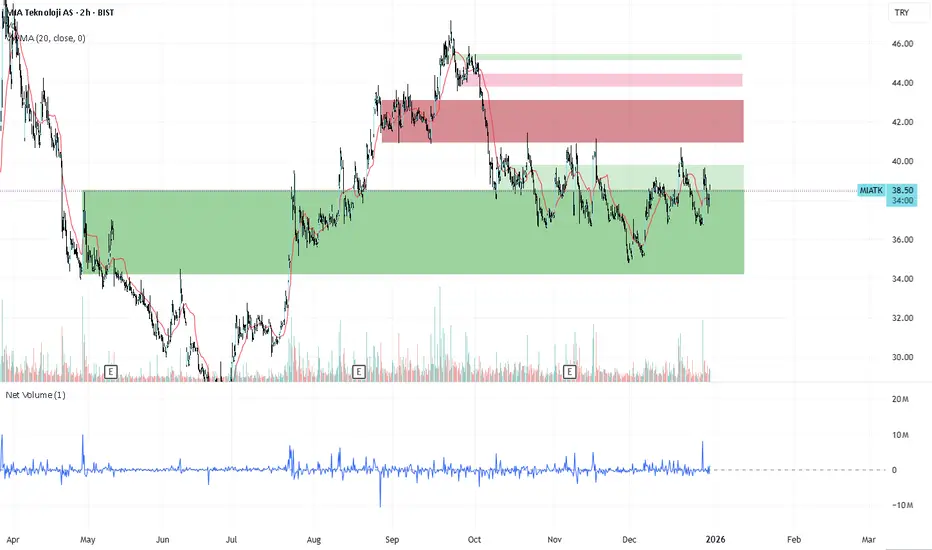
Net Volume Comment #MIATK In April, the shares traded between 34.2 and 38.5 TL showed strong buying interest, subsequently forming a solid support zone. In recent weeks, the reversal trend supported by company news and share buybacks appears to have gained momentum with current purchases. Toward the end of August, short-term price appreciation was confirmed by selling pressure, and today a strong resistance level has emerged between 40.9 and 43 TL. Depending on how this selling pressure is absorbed, it is possible to seby ilhankarbi0
FENER Stock Analysis CommentaryFENER Stock Analysis Commentary Daily technical indicators are Positive. The stock is currently trading at the 9.54 support level. Being very close to the 21-day moving average (9.87), if the stock breaks above this average, it may have a chance to fill the price gap at 10.10. If prices remain above this average and positive momentum continues, the stock may target higher price gaps. The highest price gap is at 11.89. If this gap is filled, the stock will also have moved above the 200-day moviLongby SinerjiPortfoy1
MIATK about the end abc correction after 5 waves upTurkish stock MIATK has completed 5 waves up now it's making it's correction in the shape of Zig-Zag.by ey010Updated 2
Mavi in a correctionmavi seems completed a diagnoal which may be Wave A or Wave 1 after the correction ends it should make new lows.by ey01020
GUBRF Turkish stock In my opinion,Gubrf even if it makes new highs it seems like an under correction...Which in this case it seems like a big Flat correction,in this particular case wave A of the Flat also a flat itself...If that scneraio proven itself correct than it's a huge think...Many people belive small traders get caught up in the downside corrections by manipulations but i don't see it that way.. There are multiple patterns in EWP which repeats itself over and over again...We will see if my analysis is corby ey0101
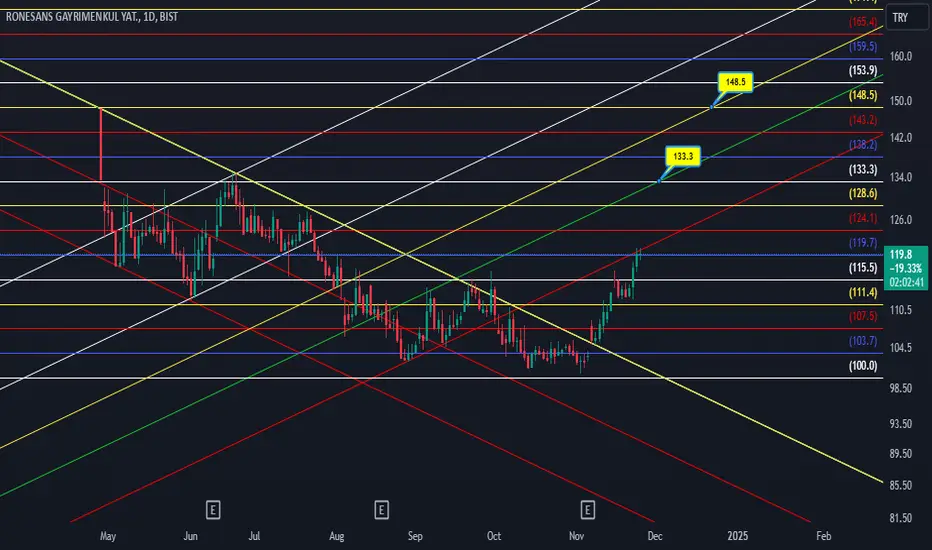
RGYASRönesans, one of the strongest construction companies in Turkey.. Rönesans Holding, the conglomerate's leading investment entity headquartered in Ankara, is the 53rd largest international contracting company globally and one of the largest in Europe. With operations spanning 30 countries across Europe, Central Asia, and Africa, including subsidiaries such as Ballast Nedam in the Netherlands and Heitkamp Industrial Solutions GmbH in Germany, Rönesans has been operating as the main contractor and Longby KHRYSOPELEAUpdated 1
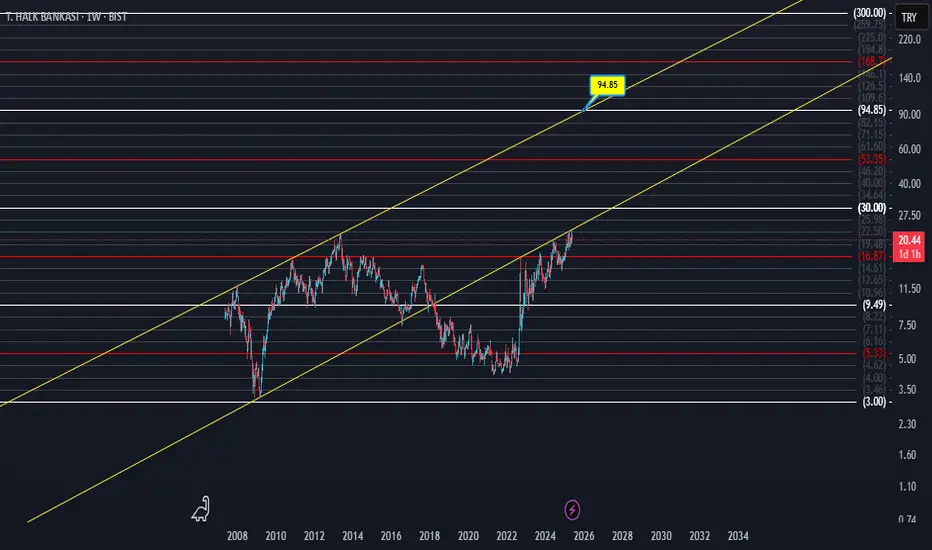
HALKBits not financal advise. the values that The financial future of this state-owned bank, which has added value in the fast-rising Turkish market, also looks brightLongby KHRYSOPELEAUpdated 3
Volume EPO – One bar, seven volume stories Volume EPO – One bar, seven volume stories (VAKFN, Borsa Istanbul) This idea illustrates how different volume-classification methods can produce very different interpretations of the same bar. The Volume EPO overlay is used as a research tool to display seven methods side by side in a compact HUD. The example is taken from VAKFN on Borsa Istanbul. On this market, TradingView provides extended intrabar volume data (BIST volume data plan), which allows the Intrabar row of the table to be built Educationby ata_sabanci9
Fortune telling w/ $BIST:AYCES BIST:AYCES near future reference 🚫 not a financial advice Longby voltkrugerUpdated 0
TRALT PA LongScenario 1: If sufficient, the current chart may continue its bullish movement after a small manipulation, with a sharp drop followed by a strong recovery. Scenario 2: If the price dips below 34 and then shows bullish signals, the uptrend may continue from where it left off.Longby Chart-Bender11
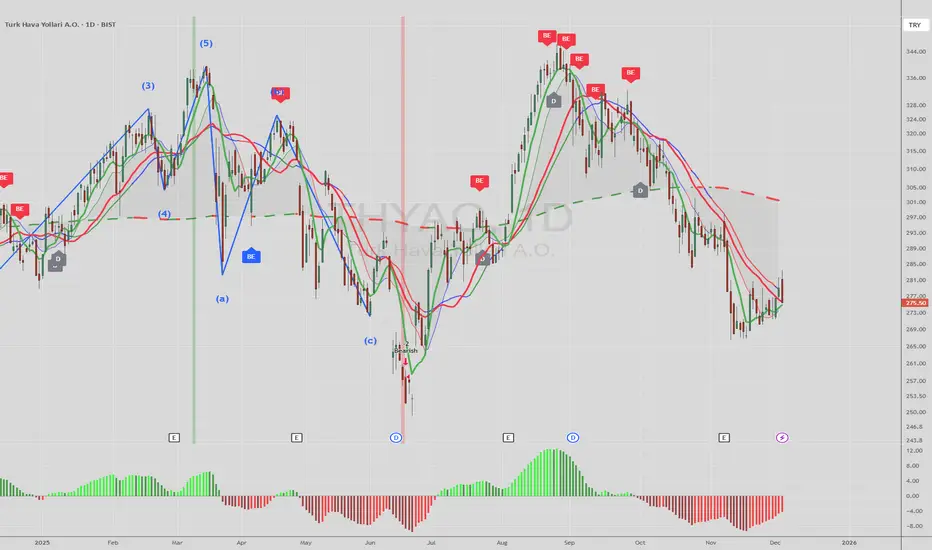
#thyao Daily Chart Fundamental Price / Fundamental Data Today’s price: approximately ₺275.50 – ₺279.00 range. 52-week range: ₺249.20 (low) – ₺346.25 (high) The Price/Earnings (P/E) and Market Value/Book Value (P/B) ratios appear relatively discounted compared to current price levels. Technical Outlook – Short Term The price is at the 50-day moving average level, which is a threshold that can technically signal a potential “Buy.” In the short term, THYAO seems to have found technical support around current leLongby mehmetgdogan1
 LongLongLong

 Long
 LongShort
 Long
 Long
 Long

 Long


 Long
 Long

 Long
 Long
 EducationLong
 Long
 Long