Long
Long
FENER Stock Analysis CommentaryFENER Stock Analysis Commentary
Daily technical indicators are Positive. The stock is currently trading at the 9.54 support level. Being very close to the 21-day moving average (9.87), if the stock breaks above this average, it may have a chance to fill the price gap at 10.10.
If prices remain above this average and positive momentum continues, the stock may target higher price gaps. The highest price gap is at 11.89. If this gap is filled, the stock will also have moved above the 200-day moving average (11.36).
Resistances: 10.05 – (10.11) – 10.68 – (10.77)
Supports: 9.54 – 8.97
We would appreciate it if you boost our posts.
Don’t forget to share them on your social media accounts as well.
Legal Disclaimer:
The information, comments, and recommendations provided here do not constitute investment advisory services. Investment advisory services are offered within the framework of an agreement between the investor and authorized institutions such as brokerage firms, portfolio management companies, or non-deposit banks. The views expressed here are personal opinions only and may not be suitable for your financial situation, risk tolerance, or return expectations. Therefore, investment decisions should not be made based solely on the information provided on this page.  Long
Long
 Long
Long
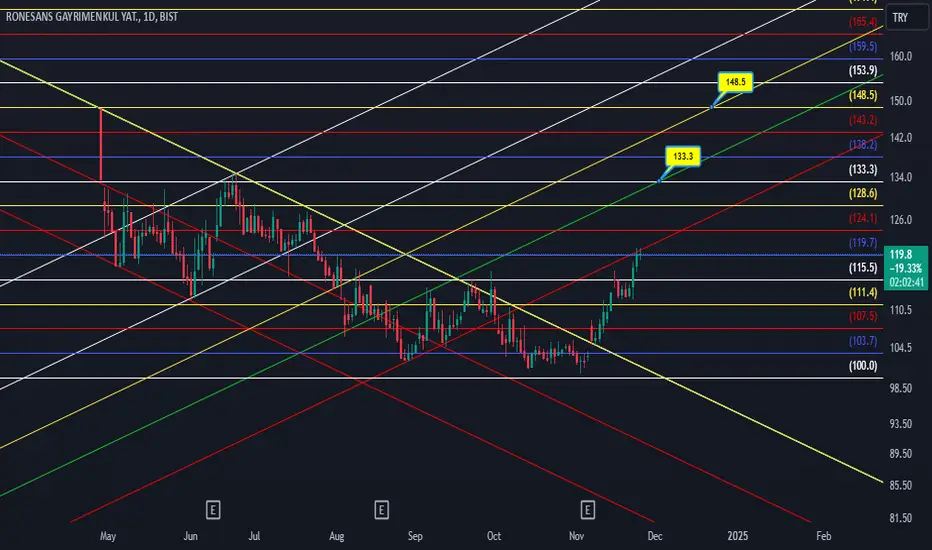
RGYASRönesans, one of the strongest construction companies in Turkey..
Rönesans Holding, the conglomerate's leading investment entity headquartered in Ankara, is the 53rd largest international contracting company globally and one of the largest in Europe. With operations spanning 30 countries across Europe, Central Asia, and Africa, including subsidiaries such as Ballast Nedam in the Netherlands and Heitkamp Industrial Solutions GmbH in Germany, Rönesans has been operating as the main contractor and investor successfully for 30 years in construction, energy, healthcare, real estate development and industrial investments. Putting resilience and growth through innovation at the core of the company, with a priority on sustainability and social development, Rönesans has developed projects supporting students with scholarships, academic platforms and initiatives; been a signatory of the UN Global Compact since 2015; and a signatory of the UN Women’s Empowerment Principles since 2016.
Under the leadership of its president, Erman Ilıcak, Rönesans, along with its partners GIC, Meridiam Infrastructure, Sojitz, Samsung C&T, TotalEnergies, and IFC of the World Bank Group (minority shareholder in the group), has invested more than EUR8 billion into pioneering projects globally.  Long
Long
 Long
Long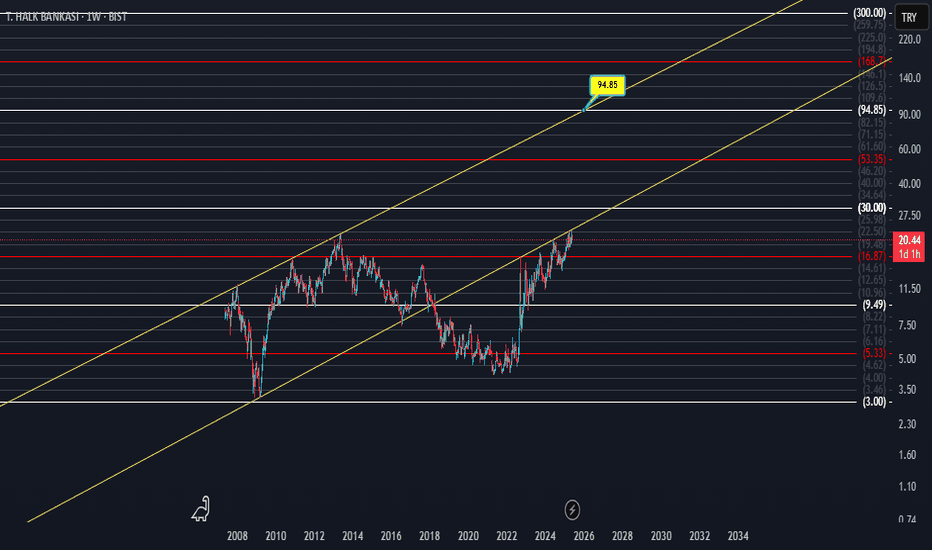
Volume EPO – One bar, seven volume stories Volume EPO – One bar, seven volume stories (VAKFN, Borsa Istanbul)
This idea illustrates how different volume-classification methods can produce very different interpretations of the same bar. The Volume EPO overlay is used as a research tool to display seven methods side by side in a compact HUD.
The example is taken from VAKFN on Borsa Istanbul. On this market, TradingView provides extended intrabar volume data (BIST volume data plan), which allows the Intrabar row of the table to be built from lower-timeframe up/down volume and used as a high-precision benchmark.
Price is shown on the daily chart inside an ascending channel. The last daily bar in that structure is analyzed with the Volume EPO table on the right. Total volume on that bar is the same for every row (66.49M), but each method splits it into buy / sell / delta differently:
- Intrabar (Ref) – lower-timeframe up/down volume
≈ 36.66M buy vs 29.83M sell → delta +6.83M (moderate net buying; benchmark “truth layer”).
- BVC (Smart) – probabilistic split via normal CDF on normalized price change
Delta ≈ +7.61M, very close to Intrabar (Diff ≈ 1.1%), confirming a mild buy imbalance.
- Tick Rule – classic uptick/downtick classifier
Because the close is above the previous close, the whole 66.49M is classified as buy volume
→ delta +66.49M (Diff ≈ 90%), an extremely bullish reading.
- Lee-Ready Style – delayed midpoint quote test with Tick fallback
On this bar the close falls on the sell side of the delayed midpoint, so the entire volume is classified as selling
→ delta −66.49M (Diff ≈ 110%), the exact opposite of Tick Rule.
- Wick Imbalance – geometric supply/demand from upper vs lower wicks
A strong upper wick and weak close again lead to a full sell reading
→ delta −66.49M (Diff ≈ 110%).
- ML-Logit – logistic model of normalized return and volume deviation
Shows only a small negative imbalance
→ delta ≈ −1.38M (Diff ≈ 12.1%), close to neutral flow.
- Geometry – legacy CLV-style candle approximation
With the close near the low of the range, more volume is assigned to sellers
→ delta ≈ −33.25M (Diff ≈ 60.1%), strong selling.
On this single daily bar of VAKFN, the conclusions range from “mild net buying” (Intrabar, BVC) to “massive buying” (Tick Rule), “massive selling” (Lee-Ready Style, Wick Imbalance), “almost neutral” (ML-Logit), and “strong selling” (Geometry).
Only the Intrabar row uses actual lower-timeframe up/down volume from TradingView; all other rows are models built on top of OHLCV. Access to deeper intrabar history on small timeframes (such as 1s/5s, depending on data plan and subscription level for BIST) strengthens this benchmark layer and makes it easier to see which methods stay close to the underlying flow and which ones drift away.
This idea is presented as a research and educational example on VAKFN, not as a trade signal or financial advice.
 Education
 Long
Long
 Long
Long
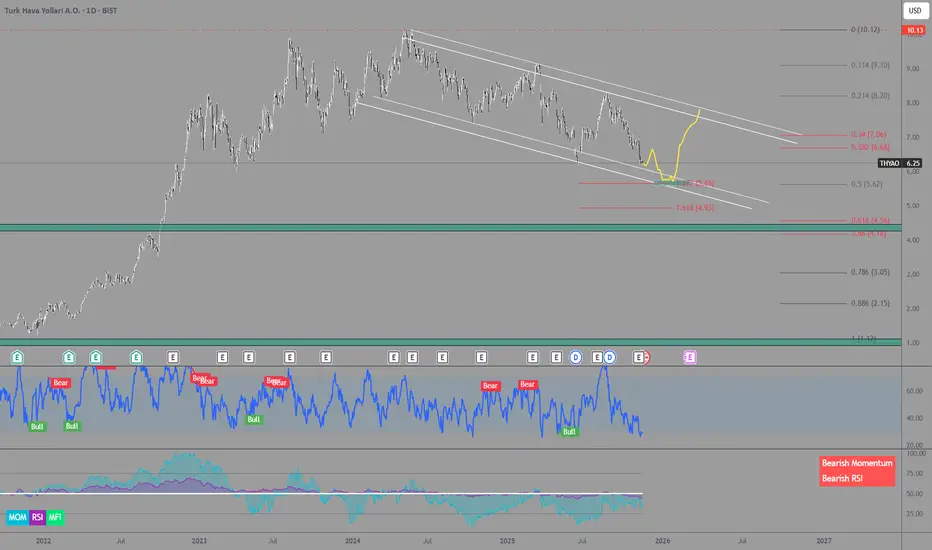
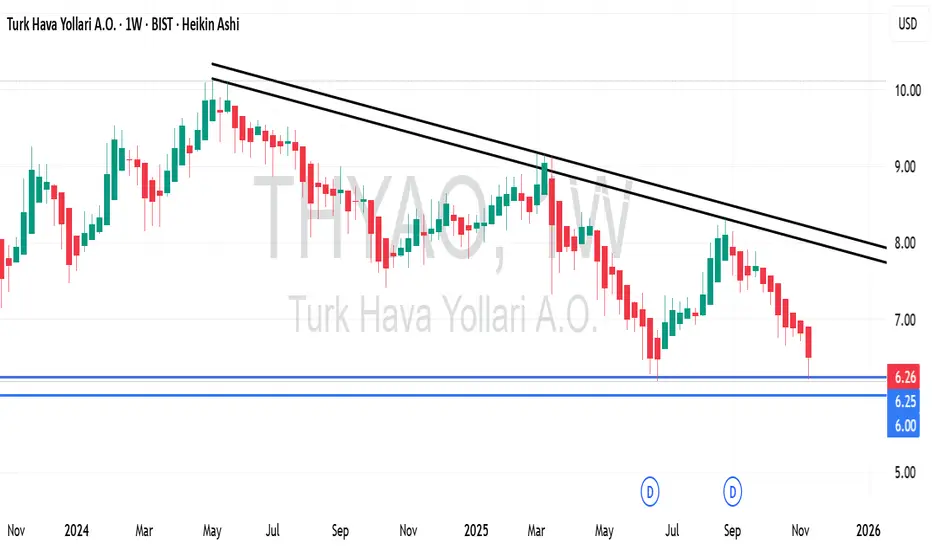
#thyao Daily Chart Fundamental Price / Fundamental Data
Today’s price: approximately ₺275.50 – ₺279.00 range.
52-week range: ₺249.20 (low) – ₺346.25 (high)
The Price/Earnings (P/E) and Market Value/Book Value (P/B) ratios appear relatively discounted compared to current price levels.
Technical Outlook – Short Term
The price is at the 50-day moving average level, which is a threshold that can technically signal a potential “Buy.”
In the short term, THYAO seems to have found technical support around current levels — this increases the probability of short-term rebound buying. However, some indicators and moving averages remain cautious, which may prevent the price from finding a clear direction.
Some analyses suggest significantly higher target price levels for the stock — for example, ₺478–₺575 range.
Summary
THYAO may be suitable for medium / long-term accumulation, as the price still appears undervalued compared to historical levels, with potential upside.
In the short term, it can be monitored for reaction moves, especially the ₺275–₺280 level, which could act as support — if the price holds this band, a rebound may occur.
Not investment advice (NIA).  Long
Long
 Long
Long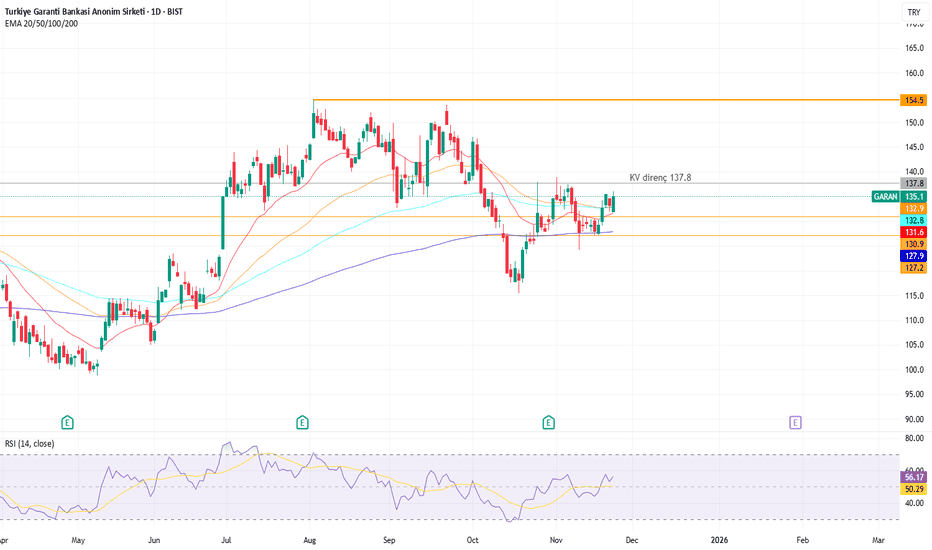
 Long
Long
 Long
Long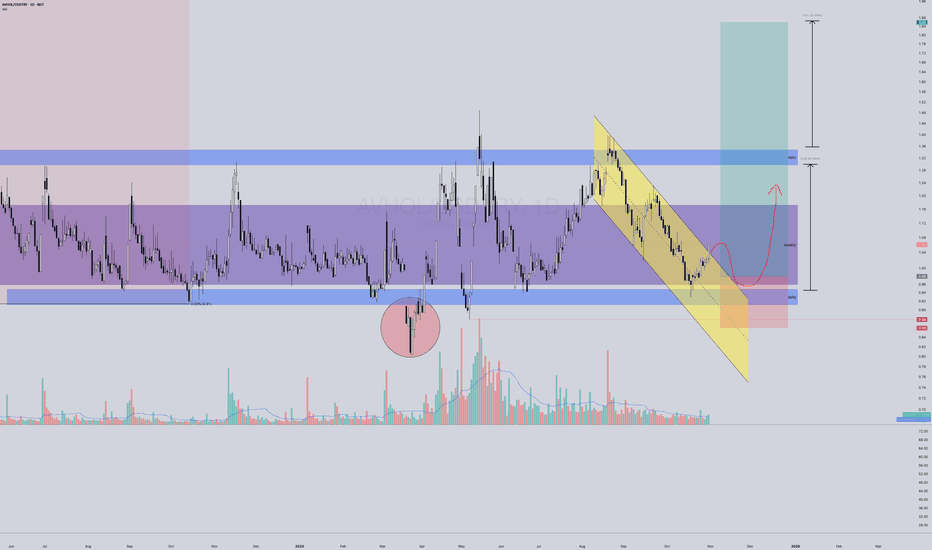
Long 
 Long
Long