 ShortShort
GEDYH DCA - Cup and Handle Company: Gedik Yatirim Menkul Degerler
Ticker: GEDYH
Exchange: BIST
Sector: Financials
Introduction:
Welcome to our weekly technical analysis, where today we're focusing on Gedik Yatirim Menkul Degerler (GEDYH), listed on the BIST in the Financials sector. The weekly chart showcases a Cup and Handle formation, suggesting a bullish continuation.
Cup and Handle Pattern:
A Cup and Handle pattern is a bullish continuation pattern that marks a period of consolidation followed by a breakout. I


GARAN DCA - Ascending TriangleCompany: Turkiye Garanti Bankasi
Ticker: GARAN
Exchange: BIST
Sector: Financials
Introduction:
Welcome to our daily technical analysis, focusing today on Turkiye Garanti Bankasi (GARAN), a leading player in the Financials sector, listed on the BIST.
Ascending Triangle Pattern:
This Ascending Triangle pattern forms during an uptrend and is viewed as a bullish continuation pattern. It's characterized by a horizontal resistance line (formed by equal highs) and an ascending trend line (form


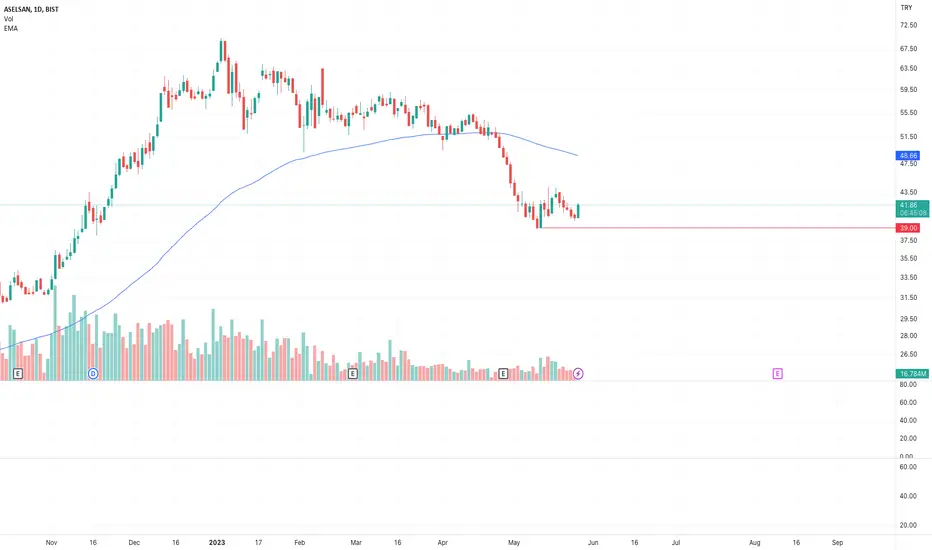
Target EMA100, LongFollowing daily chart, I got a long signal from my indicator.
TP - Following EMA100 for TP, I think it'll be around 45-47, pretty sure will be higher than 44.5
SL - 39
 Long
 Long
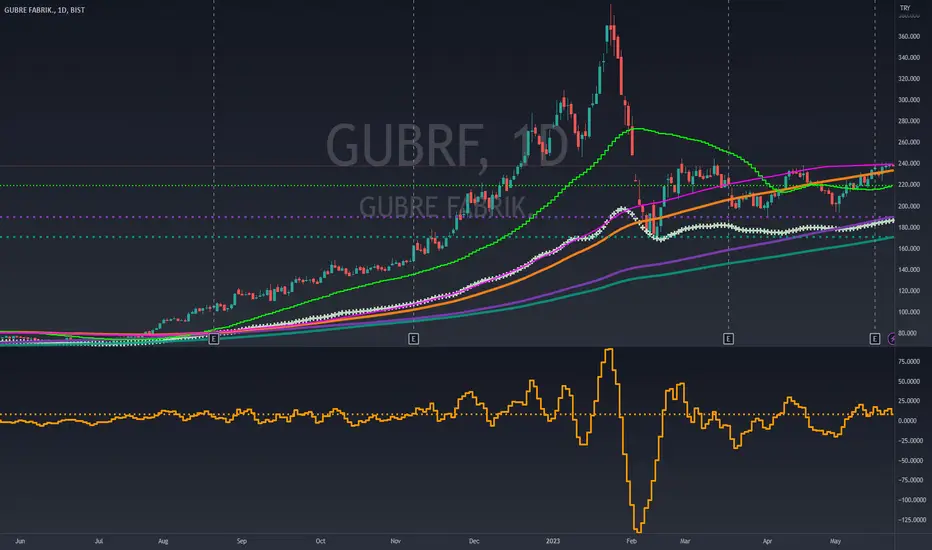
Kardemir 3 or 6 month long positionKardemir 3 or 6 month long position as far as known local condition
 Long

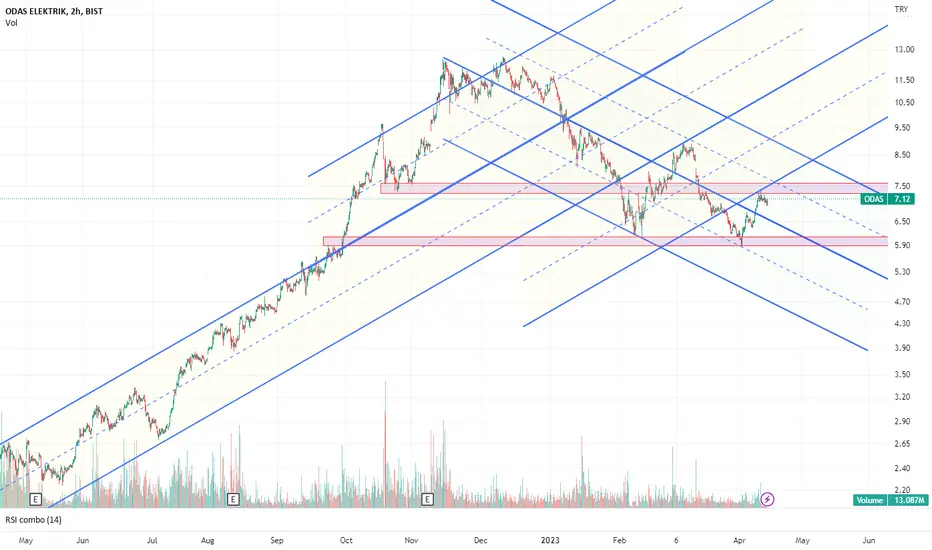
ODAS channelsODAS is abiding the parallel channels since April 2022.
Two levels are given according to the price action. You can swing trade between the red intervals if it gives an opportunity.

SMRTG bounced from its trend from June 2022SMRTG's trend fron July 2022 acted as a support for it in the last week.
It's a decent growth company that is, well, a bit overpriced in terms of the fundamental ratios as of now.
However, i think we will see a price movement towards 93 TL from here. The strategy is simple.
- Each time it touches the blue trend line, I'm a buyer,
- Each time it touches the red rectangle at the top, i'm a seller.
 Long

DEVA at the bottom of its channel in loggraphDEVA hit its bottom of the channel the last Tuesday. So this analysis is 3 days too late to be honest.
However, it is still looking great and the Risk Profit Ratio is pretty decent still.
Under 35.00 TL is risky, but other than that, I would accumulate DEVA in the upcoming week. There is a chance that it will re-try the bottom of the channel and get its confirmation around 38.00 TL which I would not miss for sure.
The fundamentals are strong and there's no strong reason why it would go dow
 Long

EREGL at the bottom of its channel in loggraph.I think it's time to accumulate EREGL as long as the price is between 33.00 - 36.00 TL. It is already oversold due to Arcelor Mittal batch-selling.
Two levels that are important are indicated in the chart, both of them are as a result of simple Price Action, and will most probably act as resistances.
FEF1! is not bad either, which will support EREGL's quarterly revenues for the upcoming months.
 Long


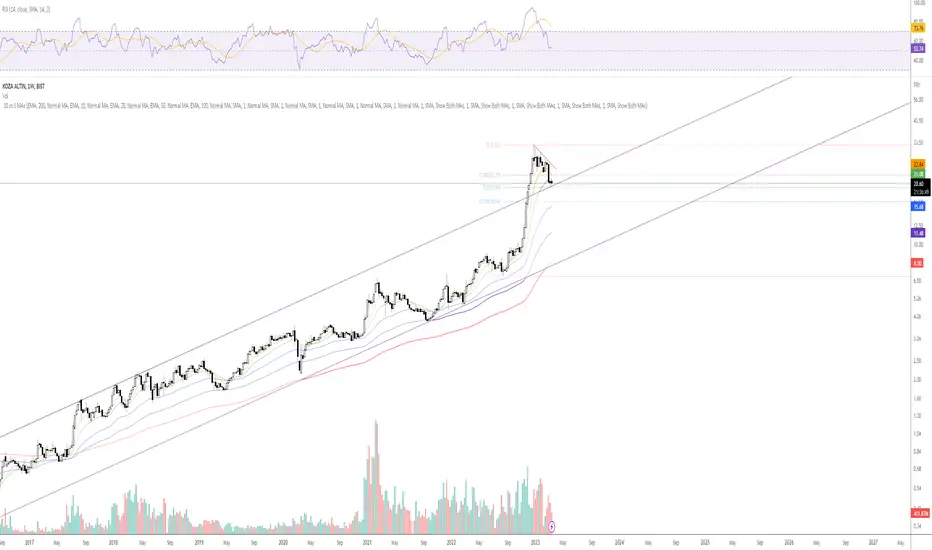
618 Tepki alimiOptimal alım bölgesine geldiğinde fiyat hareketi incelenip satın almak için fırsat aranmalı


turkish airlines - get ready for your millenium present. In any case, corona would hit Turkey, this one will drop below 1.3$
dolar/turkish lira would be up to 6.84-7.2TL( average 7TL)
1,3*7TL=9,1TL, my entry for Long


#ISCTR #BIST #TURKEY Ascending TriangleAscending Triangle breakout to All Time High !!
Probable target mentioned. .
 Long

Target 47.45Following daily chart.
There is a H&S formation which got a confirmation yesterday.
TP1 around 58-60 which is 200 EMA
TP2 - if it breaks EMA 200, then expecting 47.45 as formation target.
SL 78
 Short

 Long
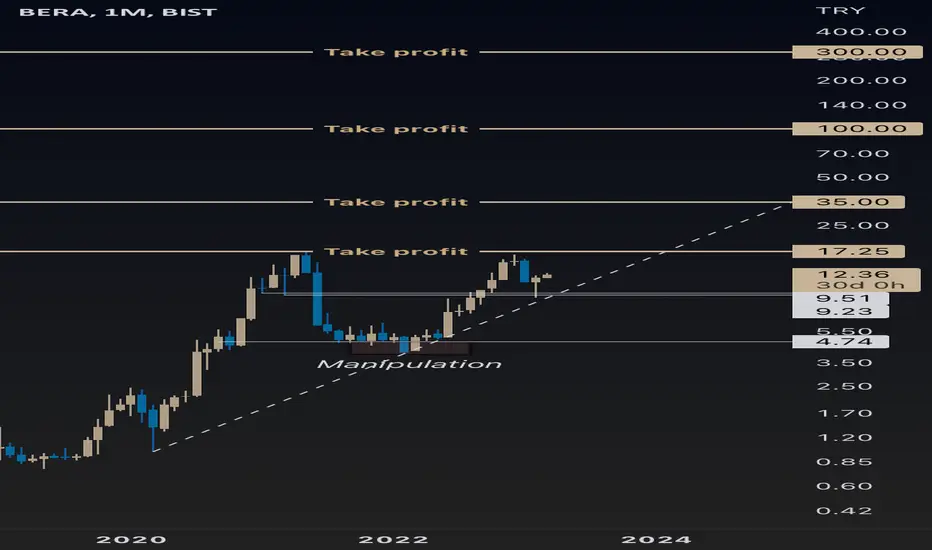
 Long

 Long

CEMTAS AB=CDAs per my analysis the CEMTAS on BIST is going to make a move around 76. Which will complete is measure move.NFA
 Long
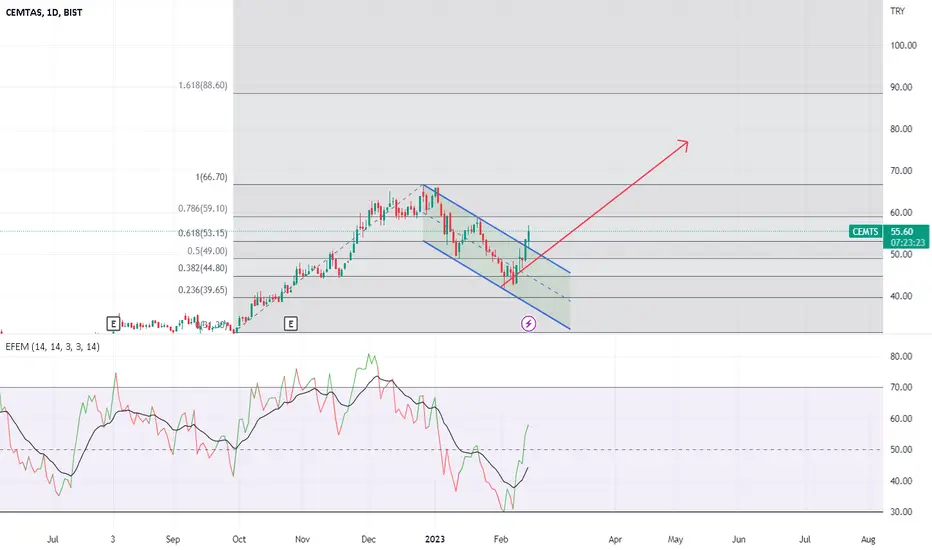
GARAN LONG PSITION Garan short term 5-20 days long position great risk/reward ratio. Educational purpose only. Not an investment advice
Long
PINAR ET VE UN +VE BAT PATTERNPETUN create postive BAT Harmonic patern
T1 : 57.00 (1.HEDEF)
T2 : 62.05 (2.HEDEF)
T3 : 65.9 (3.HEDEF)
STOP LOSS : 51.20~52.65
GOOD LUCK


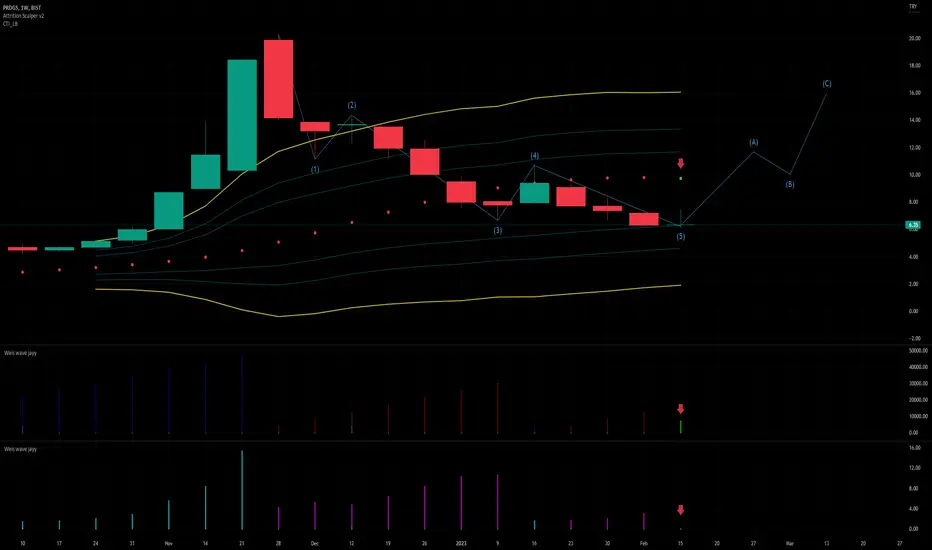
PRDGS Very Likely At Its BottomPRDGS will probably start its bounce starting from Monday next week and possibly extend it with the announcement of the quarterly balance sheet.
We can clearly see the 5 wave Elliot Wave and that the sellers are exhausted with the Weiss Wave Analysis, also a nice sign that the weekly closure was above the lower 1.618 fib line and depending on how the broad XU100 does this might probably be the end of a near 3 month downtrend.
Be greedy when others are fearful and be fearful when others are gree
 Long
a good pattern in a very bad market situationthis one in #borsaIstanbul is showing a nice pattern.
if you want not to be out of market for 100%. this one seems to be a reasonable risk.
below the 1st resistance (all time high) the RRR > 2.3 then you can sell or, shift your SL to buy point and continue
 Long

AKBNK LONGakbnk volume is important gotta keep an eye on it. Not an investment advice. Educational only
 Long
