• Products
  • Community
  • Markets
  • Brokers
  • More
Get started
  • Markets
  • /Turkey
  • /Stocks
  • /Ideas
BIST TRGYO MBCalculatorThe transaction performed based on the value obtained using the MBCalculator calculator and the support and resistance levels determined by technical analysis is shown. This is not investment advice. It is shared for educational purposes.
BIST:TRGYOLong
by ZorkanErkan
1
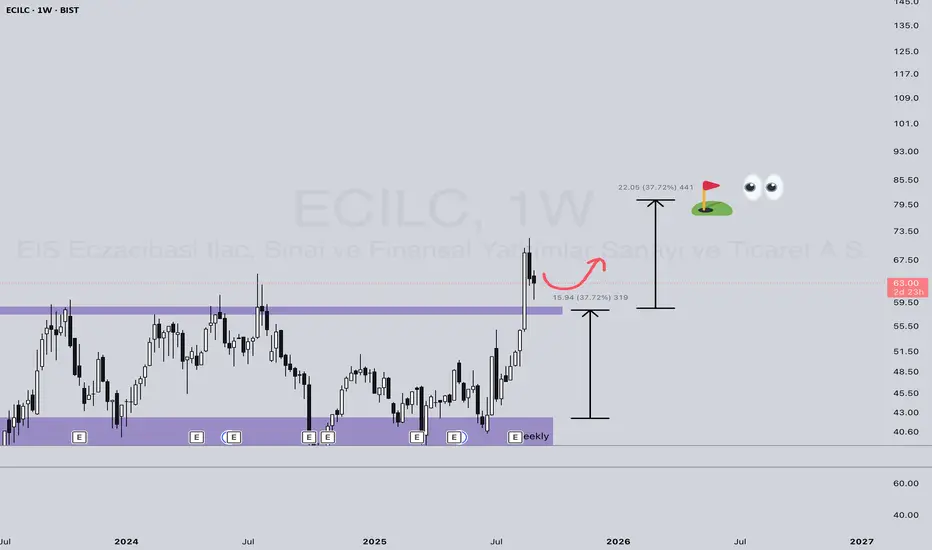
ECILC potential win at 37% Been following this one for a while: finally #ECILC broke the parallel channel resistance and coming back for a retest. dyor.
BIST:ECILCLong
by voltkruger
HUNER (1D) — Seller Bias After OB Cluster; Descending BA SlopesHUNER (1D) — Seller Bias After OB Cluster; Descending BA Slopes, 4.00 Support Under Test Executive read (VPA, 55-bar window) ◉ OB/OS: An OverBought 4/7 tag printed at the apex; no confirmed OS on the right edge. That OB cluster preceded the entire red B→A leg and frames the current risk. ◉ Ranked volume peaks (Top-3): - B1 (H 4.35/L 4.00) ↑ 68.33M, ↓ 53.3M, Δ +15.03M. - B2 (H 5.00/L 4.75) ↑ 56.06M, ↓ 44.72M, Δ +11.34M. - B3 (H 4.71/L 4.39) ↑ 49.81M, ↓ 33.61M, Δ +16.19M. - S3 (H 4.79/L 4.5
BIST:HUNER
by ata_sabanci
Seller Strength Evident as Volume Peaks Fail to Propel Price HigAnalysis Context – This 1D chart uses the ATAI Volume Pressure Analyzer to study the A→B→C structure over the last 11 trading sessions. Segment C→B captures the advance (blue), while B→A captures the subsequent decline (red). Each bar’s up‑ and down‑volume is measured on a lower timeframe to detect buying and selling pressure. Volume ranking – Within this 11‑bar window, the indicator identifies the three largest buying (B1–B3) and selling (S1–S3) bars. Although the B1 bar shows the highe
BIST:CONSEShort
by ata_sabanci
#trilc getting readyCheck TP SL before taking position Fibo levels are essential and indicators support the price
BIST:TRILCLong
by SamurayBoga
1
Volume and Structural Analysis of THYAO — Reaching Resistance at📝 Analysis: My initial focus in this chart was on the daily buy and sell volumes. According to the table displayed at the bottom of the chart for August 6th: Buy Volume (t-0): 46.305M Sell Volume (t-0): 24.566M These values show a clear increase compared to previous checkpoints (t-13 and t-26). Notably, the buy volume is 28.3M higher than t-13 and about 1.6M higher than t-26. This gives us a broader picture: buying strength remains dominant, even though delta volume has not surpassed its va
BIST:THYAO
by ata_sabanci
Updated
MID-TERM LONG OPPORTUNITY FOR JANTSAs the descending trend was broken out after 16 months, new bullish move is possible for JANTS. There may be ranging price for a while but 19 TL will be a strong support and the stop loss should be set to below 19 TL weekly closure. I believe every downward move to 19-20 TL will be a buy opportunity with lower risk. As this is mid term perspective, 10% loss in possible if the stop loss is triggered. Past performance and win ratio of weekly MACD in JANTS look supportive in this long trade.
BIST:JANTSLong
by Aykut_Celikkol
GRTHO - 3 months HEADS & SHOULDERS══════════════════════════════ Since 2014, my markets approach is to spot trading opportunities based solely on the development of CLASSICAL CHART PATTERNS 🤝Let’s learn and grow together 🤝 ══════════════════════════════ Hello Traders ✌ After a careful consideration I came to the conclusion that: - it is crucial to be quick in alerting you with all the opportunities I spot and often I don't post a good pattern because I don't have the opportunity to write down a proper didactical comment; - sin
BIST:GRTHOLong
by TheArtOfCharting
For A Long Time, Maybe The Expected Moment Has Come, The Range BFor A Long Time, Maybe The Expected Moment Has Come, The Range Break Can Be Followed
BIST:AKFGY
by selahattineknci
Günlük Grafik Fikir AmaçlıFor A Long Time, Maybe The Expected Moment Has Come, The Range Break Can Be Followed
BIST:AKFGY
by selahattineknci
#aefes#AEFES Weekly Chart Is For Idea Purposes. This sharing is based on my own drawing and personal technical analysis. It does not have any investment advice. For educational and sharing purposes only. My interpretation in the relevant stock is shaped through historical data and graphical behavior. The decision and responsibility belong entirely to the person. YTD
BIST:AEFES
by selahattineknci
1
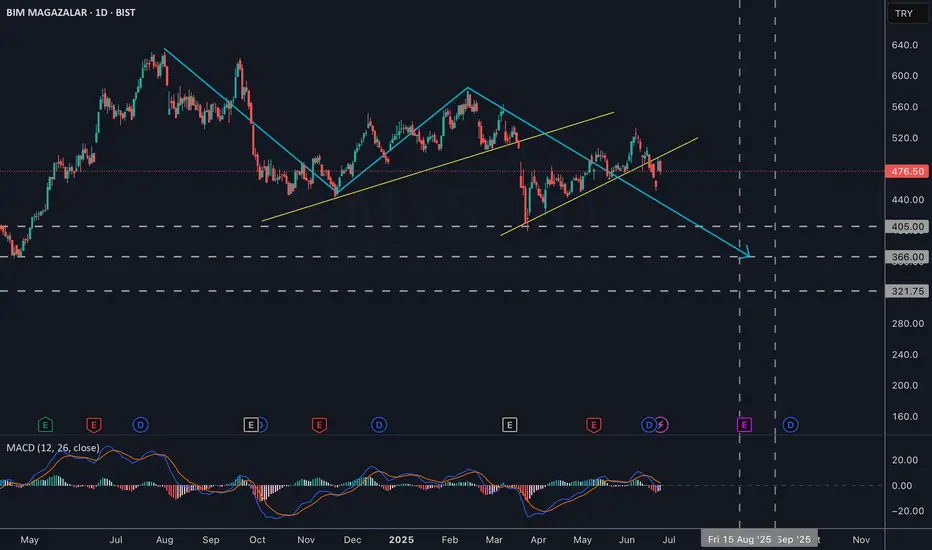
BIMAS - 1DBIMAS has been undergoing a corrective move since August of last year. I anticipate this correction will be completed after a full year. Target zones (in terms of both time and price) have been marked accordingly based on this scenario.
BIST:BIMAS
by ekgencsoy
ayocrypt akfye trend analysis shows a huge uptrendAn analysis for artificial intelligence TO CHECK. Please share your ideas with me.
BIST:AKFYELong
by ayocrypt
1
GUBRF - 1DTwo target zones are marked in yellow. Expect to see a downward movement.
BIST:GUBRF
by ekgencsoy
High Risk/reward Ratio for ODAS Long TradeI believe ODAS has not much time for breakout. Stop level should be weekly closure below 4.5 TL which is the testing area of double bottom. Take Profit should be set to fibonacci level 8TL.
BIST:ODASLong
by Aykut_Celikkol
Low Risk for KRDMD Long TradeAs we are close to the bottom line of the horizontal band, long trade is my suggestion in KRDMD. As the stop level would be weekly closure below 22 TL, there is very high risk/reward ratio. I see 25-30% profit is possible if we set the TP as fibonacci 0.618.
BIST:KRDMDLong
by Aykut_Celikkol
AKBNK - 1DMy previous post related to AKBNK was on 3rd of June, 2024 for the maked IV th wave correction. 17th of March, V wave completed and a correction phase has started, we are now heading to marked area to complete the last wave of the correction. Later on we will understand whether this is a simple or a complex correction.
BIST:AKBNK
by ekgencsoy
Updated
2
MARKA – C Leg of ABC Ending as Diagonal, Breakout May Target 74₺The C leg of the ABC structure appears to be ending in a diagonal formation. If the channel breaks upward, the move may extend toward the 74₺ region.
BIST:USHOLLong
by CakirInsights
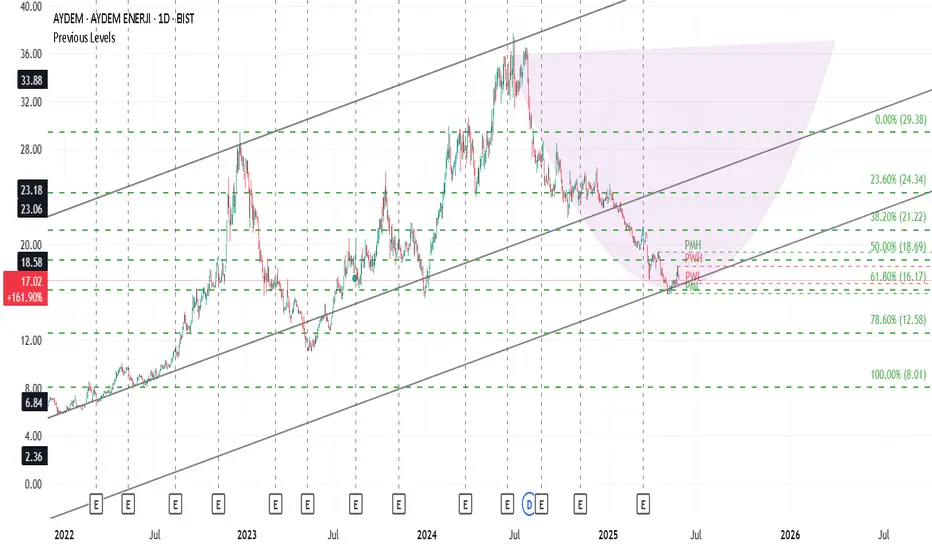
" AYDEM " is undervalued" AYDEM " is undervalued I would expect a CUP formation based on its financials and strong FIBO suppor. Good Luck
BIST:AYDEMLong
by ibrTacos
SISE 1DUnfortunately, SISECAM continues to display a negative outlook. In the current chart, it appears that the third wave of the first leg of a zigzag correction has been completed. In this case, a brief corrective upward move is expected, followed by a fifth wave. Potential target zones are marked on the chart.
BIST:SISE
by ekgencsoy
agrot hisse olabiliritesi agrot stock performance and currently being at the bottom of the bowl, if the bowl is completed on July 1, 2026, targets have been determined, fibonachi highest target is 165 liras, after the bowl is completed, the target is 87 liras
BIST:AGROT
by MertKisacik
AKSGY - MID TURN CORRECTIONImpulsive wave started in mid 2023 has just ended and I expect to see a correction till %38.2 5.17-4.86 area.
BIST:AKSGY
by ekgencsoy
Doas düşeni kırdıIt broke the downtrend with volume. There is no obstacle for it to go up anymore. It has been holding for a long time.
BIST:DOASLong
by bulentakyol2002
BOBET Is FineI think BOBET will continue its ride but for now Im waiting for horizontal resistance area.
BIST:BOBET
by BorsaRadarim
123456789101112131415161718192021222324252627282930313233343536373839404142
…999

Made by humans

Select market data provided by ICE Data Services. Select reference data provided by FactSet. Copyright © 2026 FactSet Research Systems Inc.Copyright © 2026, American Bankers Association. CUSIP Database provided by FactSet Research Systems Inc. All rights reserved. SEC filings and other documents provided by Quartr.© 2026 TradingView, Inc.

SOC 2 CompliantGDPR Compliant
More than a product
  • Supercharts
Screeners
  • Stocks
  • ETFs
  • Bonds
  • Crypto coins
  • CEX pairs
  • DEX pairs
  • Pine
Heatmaps
  • Stocks
  • ETFs
  • Crypto coins
Calendars
  • Economic
  • Earnings
  • Dividends
  • IPOs
More products
  • News Flow
  • Portfolios
  • Fundamental Graphs
  • Yield Curves
  • Options
  • Macro Maps
  • Pine Script®
  • MCP Server
Apps
  • Mobile
  • Desktop
Community
  • Social network
  • Wall of Love
  • Refer a friend
  • Creator program
  • House Rules
  • Moderators
Ideas
  • Trading
  • Education
  • Editors' picks
Pine Script
  • Indicators & strategies
  • Wizards
  • Freelancers
  • Marketplace
Tools & subscriptions
  • Features
  • Pricing
  • Market data
  • Gift plans
Trading
  • Overview
  • Brokers
  • Brokers comparison
  • The Leap
Special offers
  • CME Group futures
  • Eurex futures
  • US stocks bundle
About company
  • Who we are
  • Space mission
  • Blog
  • Help Center
  • Careers
  • Media kit
Merch
  • TradingView store
  • Tarot cards for traders
  • The C63 TradeTime
Policies & security
  • Terms of Use
  • Disclaimer
  • Privacy Policy
  • Cookies Policy
  • Accessibility Statement
  • Trust Center
  • Security tips
  • Bug Bounty program
  • Status page
Business solutions
  • Widgets
  • Charting libraries
  • Lightweight Charts™
  • Advanced Charts
  • Trading Platform
Growth opportunities
  • Advertising
  • Brokerage integration
  • Partner program
  • Education program
Community
  • Social network
  • Wall of Love
  • Refer a friend
  • Creator program
  • House Rules
  • Moderators
Ideas
  • Trading
  • Education
  • Editors' picks
Pine Script
  • Indicators & strategies
  • Wizards
  • Freelancers
  • Marketplace
Business solutions
  • Widgets
  • Charting libraries
  • Lightweight Charts™
  • Advanced Charts
  • Trading Platform
Growth opportunities
  • Advertising
  • Brokerage integration
  • Partner program
  • Education program
Look FirstLook First