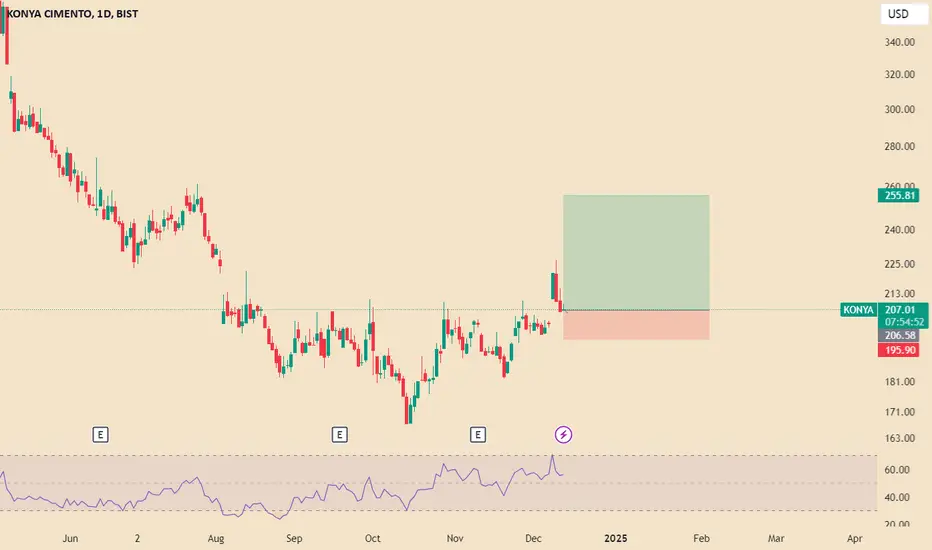
KONYA - 4 months HEAD & SHOULDERS══════════════════════════════
Since 2014, my markets approach is to spot
trading opportunities based solely on the
development of
CLASSICAL CHART PATTERNS
🤝Let’s learn and grow together 🤝
══════════════════════════════
Hello Traders ✌
After a careful consideration I came to the conclusion that:
- it is crucial to be quick in alerting you with all the opportunities I spot and often I don't post a good pattern because I don't have the opportunity to write down a proper didactical comment;
- sin
TURSG - 4 months HEAD & SHOULDERS══════════════════════════════
Since 2014, my markets approach is to spot
trading opportunities based solely on the
development of
CLASSICAL CHART PATTERNS
🤝Let’s learn and grow together 🤝
══════════════════════════════
Hello Traders ✌
After a careful consideration I came to the conclusion that:
- it is crucial to be quick in alerting you with all the opportunities I spot and often I don't post a good pattern because I don't have the opportunity to write down a proper didactical comment;
- sin
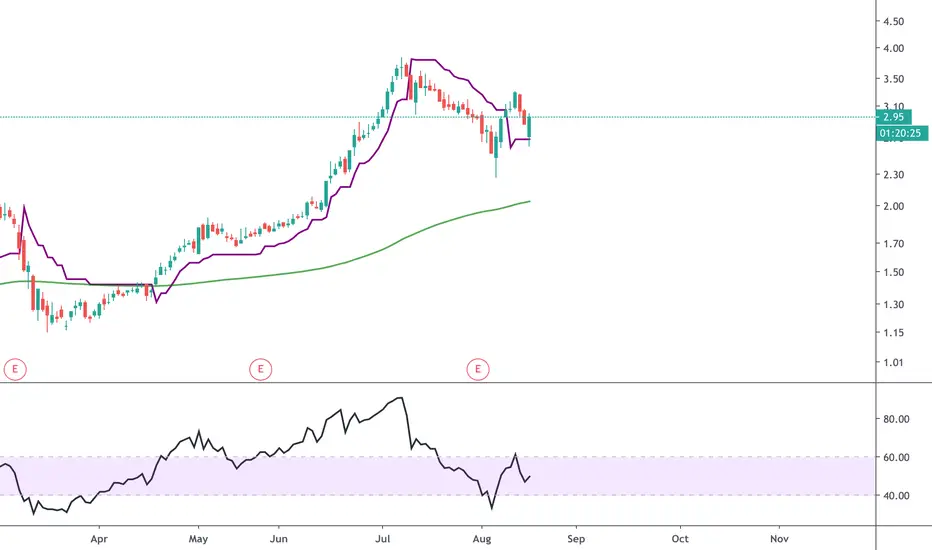
Lost DecadesTrend Analysis, RSI Strength Determination, Support and Resistance Determination
In the chart, the last blue balloon is important (I think). The support is below this balloon, and the resistance is above it.
I hope and believe in ISCTR because it's one of the top 3 most powerful banks in Turkey.
This is not financial advice.
Short, target 104.3Following weekly chart.
It's under EMA13 and got a short confimmation.
There is a reversal cup & handle formation which can speed up short.
Following power indicators and they're weakening.
TP1 104.3 - around 5% gain
TP2 98.45 - Fibo level
SL - Not super RR but following 121 level.
SASA Polyester (BIST) Technical Analysis: Bullish Falling Wedge Price Movement: The stock experienced a significant upward rally, as highlighted in blue. The percentage gain noted in the image is around 1321.64%, indicating a massive price surge. This rally is measured from a lower price level to a peak at approximately 9.50.
Bullish Falling Wedge: After the price reached its peak, the stock has been consolidating within a "falling wedge" pattern, which is typically considered a bullish continuation pattern. The falling wedge pattern is represented by two c
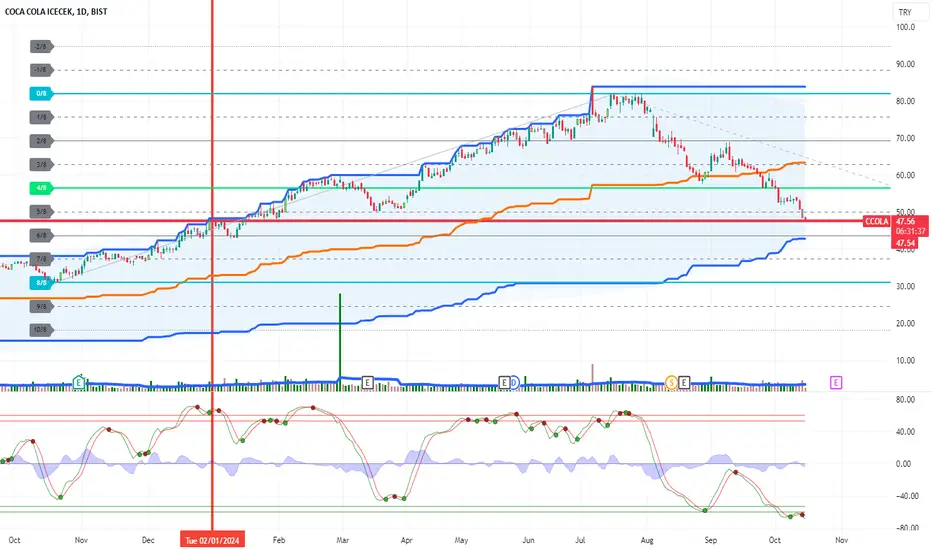
Coca Cola ? The price has recently exhibited a significant downward movement, influenced by geopolitical reasons, but this seems like a good opportunity to buy and hold.
The price is trading below the 4/8 level (approximately 50 TL) in the analysis made using Murrey Math levels, indicating that an important support level has been broken.
Currently in the consolidation phase, there may be another rise afterwards.
The price had especially moved outside the lower bands in recent days, This situation indicates
AGHOL - 5 months HEAD & SHOULDERS (Sloping Down)══════════════════════════════
Since 2014, my markets approach is to spot
trading opportunities based solely on the
development of
CLASSICAL CHART PATTERNS
🤝Let’s learn and grow together 🤝
══════════════════════════════
Hello Traders ✌
After a careful consideration I came to the conclusion that:
- it is crucial to be quick in alerting you with all the opportunities I spot and often I don't post a good pattern because I don't have the opportunity to write down a proper didactical comment;
- sin
DMRGDShort position on DMRGD
Short position on DMRGDShort position on DMRGDShort position on DMRGDShort position on DMRGDShort position on DMRGDShort position on DMRGDShort position on DMRGDShort position on DMRGDShort position on DMRGDShort position on DMRGDShort position on DMRGDShort position on DMRGDShort position on DMRGDShort position on DMRGDShort position on DMRGDShort position on DMRGDShort position on DMRGDShort position on DMRGDShort position on DMRGDShort position on DMRGDShort position